ECPGR recommended Simple Sequence Repeat loci for analyses of European plum (Prunus domestica) collections
Abstract
A set of nine Simple Sequence Repeat (SSR) loci, approved by the ECPGR Prunus working group, are proposed as a standard set for genotyping European plum accessions. These loci show sufficient reliability in spite of problems caused by hexaploidy. Polymorphism in the loci is high and enables differentiation between unique plum accessions as well as analyses of genetic grouping and overall genetic structure. A set of seven reference accessions are described. A compiled dataset with allelic information for 165 accessions is presented. Genetic structure reveals three different K-values (2, 4 and 9) demonstrating a major dichotomy between Prunus insititia-related accessions and cultivars belonging to Prunus domestica sensu stricto, as well as differentiation among minor subgroups defined by pomological traits and geographical origin.
Keywords
DNA fingerprint, genetic resources, molecular markers
Introduction
Simple Sequence Repeats (SSR), also known as microsatellites, were introduced in plant research almost three decades ago (Akkaya, Bhagwat, & Cregan, 1992). Due to their abundance, reproducibility, and polymorphism, SSRs have proven highly useful for confirming identity of accessions in plant collections and in quantifying their relatedness. In clonally propagated crops, which include most of the fruit and berry crops, each cultivar originates from a single recombination event and all cultivated plants of a particular cultivar would therefore be expected to have the same SSR profile (Nybom & Weising, 2010). Sports, e.g. mutants that differ in fruit colour, usually differ so little from the original cultivar that they cannot be distinguished with SSRs.
The ability to correctly identify plant material from different cultivars has economic importance (e.g. regarding infringement on plant variety ownership) as well as forms a basis for management of plant collections and their utilization in plant breeding and research. Compared to some of the more recently developed approaches like Single Nucleotide Polymorphisms (SNP) and Next Generation Sequencing (NGS), SSRs are comparatively easy to apply and interpret, and can be very cost-effective for developing smaller datasets. This means that specific questions asked by growers, plant nursery owners, amateur pomologists and genebank curators can be solved by analysing just a few plant samples and comparing their SSR profiles with previously obtained SSR profiles for other samples in a large database.
The possibility of adding new SSR-based data to an already existing database, even when developed in a different laboratory, is thus regarded as a major asset. However, this option is dependent on the application of the same set of SSR markers and suitable standardisation procedures including the appointment of closely defined control or reference genotypes. In crops like apple (Malus x domestica), where the standardization of loci and procedures has taken very long to achieve, use of separate sets of SSR loci has resulted in many datasets that cannot be compared across different research groups (Sehic, Garkava-Gustavsson, & Nybom, 2013). This situation may have been improved recently since several apple studies are now based on the same set of loci as used in the international research project FruitBreedomics (Urrestarazu et al., 2016).
The European Cooperative Programme for Plant Genetic Resources (ECPGR; www.ecpgr.cgiar.org) aims to ensure long-term conservation of important germplasm in Europe as well as facilitate increased utilization of this germplasm, e.g. in plant breeding. An important task is to select unique and well-documented accessions with valuable traits, of European origin or important to Europe, for the establishment of a decentralized European Collection under the rules of AEGIS (A European Genebank Integrated System; www.ecpgr.cgiar.org/aegis). A second task is to assess variability among the accessions and investigate possible subgroupings due to, e.g. geographic differentiation. In fruit tree crops like pears (Pyrus communis) and sweet cherries (Prunus avium), sets of recommended SSR loci have been appointed by ECPGR and published (Clarke & Tobutt, 2009; Evans, Fernández-Fernández, & Govan, 2009). Since then, numerous research groups have used these SSR loci for analyses of genetic identity and relatedness in these crops, and, in the case of cherry, also for sour cherries (Prunus cerasus).
Until recently, relatively few SSR-based studies have been undertaken on genetic diversity in European plums, a major reason being that this is a hexaploid (x = 7; 2n = 6x = 42) crop and therefore less amenable to molecular marker-based analyses. European plums are usually treated as Prunus domestica, although small-fruited primitive cultivars and landraces are sometimes referred to a separate mostly wild species Prunus insititia or to a subspecies P. domestica subsp. insititia. P. domestica is generally thought to result from hybridization between the diploid cherry plum (Prunus cerasifera), the tetraploid sloe (Prunus spinosa) and potentially an additional species (Reales, Sargent, Tobutt, & Rivera, 2010).
Results and Discussion
Selected SSR loci
Most of the hitherto published studies on SSR diversity in European plums are based on differing sets of loci (Abdallah et al., 2019; Gharbi, Wünsch, & Rodrigo, 2014; Halapija-Kazija et al., 2014; Horvath et al., 2011; Makovics-Zsohár et al., 2017; Manco et al., 2019; Merkouropoulos, Ganopoulos, Tsaftaris, Papadopoulos, & Drogoudi, 2017; Pop et al., 2018; Urrestarazu, Errea, Miranda, Santesteban, & Pina, 2018; Xuan et al., 2011; Öz et al., 2013). In order to facilitate harmonization between future studies, we propose a standard set of nine SSR loci, approved by the ECPGR Prunus working group, for European plum (Table 1). These loci have already been used for investigations of genetic diversity, first in plum cultivars and landraces from Norway and Sweden (Sehic, Nybom, Hjeltnes, & Gasi, 2015) and subsequently in two ECPGR-funded projects with accessions sampled in a total of 14 European countries: ‘PRUNDOC’ (Sehic et al., 2019) and ‘Prunus Alignment’ (Gaši et al., 2020); reporting data from both ECPGR studies).
| Locus | DNA sequence | Reference | Annealing temp. °C |
|---|---|---|---|
| CPSCT026 | 3’-TCTCACACGCTTTCGTCAAC-5’ 3’-AAAAAGCCAAAAGGGGTTGT-5’ | 23 | 46 |
| BPPCT034 | 3’-CTACCTGAAATAAGCAGAGCC AT-5’ 3’-CAATGGAGAATGGGGTGC-5’ | 25 | 56 |
| UDP96-005 | 3’-GTAACGCTCGCTACCACAAA-5’ 3’-CCTGCATATCACCACCCAG-5’ | 24 | 56 |
| BPPCT014 | 3’-TTGTCTGCCTCTCATCTTAACC-5’ 3’-CATCGCAGAGAACTGAGAGC-5’ | 25 | 58 |
| BPPCT039 | 3’-ATTACGTACCCTAAAGCTTCTGC-5’ 3’-GATGTCATGAAGATTGGAGAGG-5’ | 25 | 58 |
| BPPCT040 | 3’-ATGAGGACGTGTCTGAATGG-5’ 3’-AGCCAAACCCCTCTTATACG-5’ | 25 | 58 |
| UDP98-407 | 3’-AGCGGCAGGCTAAATATCAA-5’ 3’-AATCGCCGATCAAAGCAAC-5’ | 24 | 58 |
| PacA33 | 3’-TCAGTCTCATCCTGCATACG-5’ 3’-CATGTGGCTCAAGGATCAAA-5’ | 26 | 58 |
| BPPCT007 | 3’-TCATTGCTCGTCATCAGC-5’ 3’-CAGATTTCTGAAGTTAGCGGTA-5’ | 25 | 60 |
Seven of the nine chosen SSR loci were developed from genomic DNA of peach (Prunus persica): BPPCT007, BPPCT014, BPPCT034, BPPCT039 and BPPCT040 (Dirlewanger et al., 2002), and UDP96-005 and UDP98-407 (Cipriani et al., 1999). One locus, PacA33, is an Expressed Sequence Tag-SSR (EST-SSR) from apricot (Prunus dulcis) (Decroocq, Favé, Hagen, Bordenave, & Decroocq, 2003), while CPSCT026 originates from genomic DNA of Japanese plum (Prunus salicina) (Mnejja, Garcia-Mas, Howad, Badenes, & Arus, 2004). In addition to studies based on eight or nine of these loci (Gaši et al., 2020; Sehic et al., 2015), five loci, BPPCT034, BPPCT039, BPCT040, PacA33 and UDP96-005, have also been used by 26, 12 for screening of plum accessions from Croatia and neighbouring countries.
Marker reliability is critical for producing cultivar profiles to be used in shared databases. Hexaploid plum accessions are considerably more difficult to genotype compared to diploid genotypes since each locus may have up to six alleles. Overlooking a true but faint band is entirely plausible, as well as is mistakenly scoring an artefactual band as an allele (Gaši et al., 2020). Although 15 loci remained as serious candidates among a wider set of SSR loci screened initially, six of these had to be discarded due to unreliable amplification (PacA18, PacA49, PacB22, PacB26, PacB35, PacC13) (Decroocq et al., 2003), thus leaving the nine chosen loci. Very high reliability was shown recently when pollinizer success could be determined using seven of the chosen SSR loci for analysis of plum embryos harvested after open pollination (Meland et al., 2020). The need for very accurate SSR allele scoring is objectively higher in trials that use the obtained DNA profile database for paternity analyses compared to standard diversity studies.
Detected polymorphisms were very high for the nine chosen SSR loci when a joint biostatistical analysis was performed for plum accessions previously genotyped in the above-mentioned studies (Gaši et al., 2020; Sehic et al., 2015). Although the study by 21 was based on only eight of the nine recommended SSRs, all plum accessions from that study had also been genotyped for the remaining microsatellite locus (BPPCT039). Number of alleles ranged from 18 to 48, and Nei’s gene diversity ranged from 0.88 to 0.93 (Table 2).
| Locus code | Size range (bp) | No. alleles | Gene diversity | Size range (bp) | No. alleles | Gene diversity |
|---|---|---|---|---|---|---|
| Plum accessions (n=175) | Reference cv. (n=7) | |||||
| UDP 98-407 | 156/231 | 29 | 0.8825 | 164/203 | 10 | 0.8995 |
| Pac A 33 | 169/254 | 37 | 0.9275 | 169/252 | 15 | 0.8907 |
| CPSCT 026 | 165/216 | 22 | 0.9118 | 165/208 | 13 | 0.8989 |
| BPPCT 040 | 113/154 | 18 | 0.8811 | 120/146 | 8 | 0.8640 |
| BPPCT 007 | 121/163 | 19 | 0.9121 | 123/147 | 10 | 0.8872 |
| BPPCT 014 | 186/294 | 48 | 0.9319 | 186/258 | 16 | 0.9298 |
| BPPCT 034 | 213/277 | 25 | 0.9117 | 215/259 | 12 | 0.9013 |
| UDP 96-005 | 92/169 | 34 | 0.9218 | 100/165 | 11 | 0.8462 |
| BPPCT039 | 113/187 | 33 | 0.9255 | 126/179 | 17 | 0.9339 |
| Mean | 29.4 | 0.9118 | 12.4 | 0.8946 | ||
Laboratory procedures
All amplifications were performed according toDirlewanger et al. (2002) with the minor changes of an increase to 1 U Taq polymerase (Thermo Fischer Scientific, Surrey, UK) and the introduction of four different annealing temperatures (Table 1). Diluted PCR products were mixed with Hi-Di formamide (Applied Biosystems, Beverly, MA, USA) and an in-house prepared size standard, after which the amplified fragments were separated on an ABI 3130xl Genetic Analyser (Applied Biosystems).
Since errors due to competitive amplification are more difficult to spot in samples of hexaploid organisms compared to diploid ones, we recommend that all amplifications are performed in simplex. Whether to pool the amplification products from two (or three) loci together before allele sizing in, e.g., an automated gene sequencer, is less critical and therefore a matter of what is regarded as most convenient in each laboratory.
Reference genotypes
A set of seven reference accessions has been appointed: the large-fruited Canadian eggplum ‘Valor’ (cross between ‘Imperial Epineuse and ‘Grand Duke’), the small-fruited German eggplums ‘Hanita’ (‘President’ x ‘Auerbacher’) and ‘Topfirst’ (‘Čačanska Najbolja’ x ‘Ruth Gerstetter’), the French greengage ‘Reine Claude Violette’ (offspring of ‘Reine Claude Verte’), the large-fruited American prune ‘Stanley’ (‘d’Ente Double’ x ‘Grand Duke’), the French mirabelle ‘Mirabelle de Nancy’, and the East European small-fruited prune ‘Bistrica’. Allele sizes of these references (Supplementary Table 1) can be used as a basis for determination of the size adjustment needed to render data from other laboratories comparable. Leaves of these genotypes can be obtained from the Institute of Pomology (Croatian Centre for Agriculture, Food, and Rural Affairs), located in Donja Zelina, Croatia. Alternatively, replicate samples could be used from trees already present in many plum collections following an initial DNA-based confirmation of their identity against the original reference genotypes.
Evaluation of band profiles
In previous ECPGR-recommended sets of SSR markers (Clarke et al., 2009; Evans et al., 2009), 16 loci were selected for both pear and sweet cherries, although only six loci were defined as first priority in cherries followed by three loci as 2nd priority, three loci as 3rd priority and four loci as 4th priority. In these diploid crops, the maximum number of alleles scored would thus reach 32 although the number is usually lower due to the presence of two copies of the same allele in several loci.
Since all European plums are hexaploid, up to six different alleles can be expected in each SSR locus, amounting to a maximum of 54 alleles for nine loci. However, the total number of alleles in a plum sample analysed with the proposed nine loci has only reached 35 on average (Sehic et al., 2015). The discrepancy here is also probably due, at least in part, to multiple copies of the same allele in some of the locus/genotype combinations.
In a study of 78 presumably hexaploid plum genotypes screened with all nine loci, 59 accessions revealed six alleles in one to three loci, while the remaining 19 accessions revealed a maximum of five different alleles in any locus (Sehic et al., 2015). In another study of 110 accessions analysed with 8 of the proposed SSR loci, 85 accessions revealed six alleles in at least one locus, while 23 accessions revealed five alleles and two accessions revealed a maximum of only four alleles (Gaši et al., 2020). Counting the total number of bands for each genotype is thus recommended, since an unusually low number of alleles can be an indicator of poor amplification.
Analyses of genetic diversity
Multilocus SSR profiles are generally scored as ‘allelic phenotypes’ based on the presence of alleles but not their frequencies. Since the likelihood of actually overlooking alleles is much higher in hexaploid samples compared to samples of lower ploidy, the threshold for determination of whether two (or more) samples are identical, has to be relatively low. In a study of European plums, all pairwise comparisons with the fraction of shared bands, Sxy [= 2nxy/(nx + ny)], reaching 0.88 or higher, were interpreted as resulting from the same recombination event and thus being genetically identical except for possible minor somatic mutations (Gaši et al., 2020).
Availability of biostatistical software which can be used on genotyping data of allopolyploid accessions, such as the hexaploid plum, is significantly restricted compared to software solutions for diploid accessions. However, some programs provide options to overcome the challenges of allele dosage ambiguity. Population genetics software SPAGeDI 1.3 (Hardy & Vekemans, 2002) and POLYSAT (Clark & Jasieniuk, 2011), an R package for polyploid microsatellite analysis, enable the replacement of “missing alleles” in loci where fewer than six different alleles (de facto maximum in hexaploid plum) are scored, with the average allele size. This enables the calculation of allele frequency, as well as gene diversity (Nei, 1978) and F statistics (Weir & Cockerham, 1984). Additionally, population structure can be investigated using the Bayesian model-based cluster procedure within Structure version 2.2.3 (Pritchard, Stephens, & Donnelly, 2000).
Genetic differentiation among groups of genotypes (based on various criteria such as geographical origin, morphological or taxonomic traits, breeding status, or obtained as reconstructed panmictic populations in Structure), can be examined using the GenoType/GenoDive package (Meirmans & Tienderen, 2004) which enables analyses of molecular variance (AMOVA) (Excoffier, Smouse, & Quattro, 1992) among polyploids, as well as among a mix of genotypes with varying levels of ploidy.
Although the visualization of relationships among polyploid genotypes is easily accomplished through hierarchical clustering, such as UPGMA dendrograms using a matrix with pairwise comparisons based on the Jaccard similarity coefficient, the use of factorial correspondence analysis (FCA) on SSR data of diploid crops has become increasingly common. This multivariate analysis can be conducted on a matrix of binary microsatellite allele presence/absence data using the “dudi.coa” routine in R 2.15.2 (R Core Team, 2012) as suggested by Muller and McCusker (2009). Construction of the mentioned matrix is quite simple and appropriate for polyploid genotypes. A graphical display of the FCA results can then be achieved with the rgl package version 0.93.945 (Adler & Murdoch, 2013) in the same statistical software.
Compiled dataset and genetic structure
A joint dataset covering 165 accessions (subsequent to removing the duplicates between studies) was compiled from the two datasets (Gaši et al., 2020; Sehic et al., 2015). The 8 loci from the original study by Gaši et al. (2020) were complemented by the genotyping of BPPCT039, resulting in 9 loci scored for all accessions. Most of these accessions had never been genotyped before and they were chosen so as to represent both the major coverage of cultivars in plum-growing countries in Europe as well as the whole range of material in germplasm collections, from local and landrace accessions to commercial cultivars produced in modern breeding programs. This dataset is available in Supplementary Table 1 and can be regarded as a starting point for a shared international dataset to be used by different research groups.
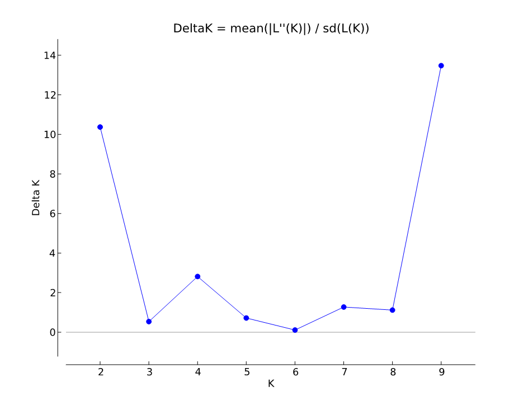
Genetic structure among accessions in this compiled dataset was investigated with a Bayesian model-based cluster procedure using Structure version 2.2.3 (Pritchard et al., 2000). For individuals with fewer than six allelic variants per locus, absent alleles were treated as missing data. K (unknown) reconstructed panmictic populations (RPPs ) were computed on individuals, testing K (log-likelihood) = 1–10 for all samples, assuming that the sampled accessions were from unknown origin. Ten independent runs were conducted for each K. A burn-in period of 200,000 and 500,000 iterations was applied. Structure Harvester version 0.6.1 (Earl & Holdt, 2011), which implements the Evanno method (Evanno, Regnaut, & Goudet, 2005), was used to estimate K values for the analysed data (Figure 1). K = 2, 4 and 9 were used to assign individuals to specific clusters. All input files were compiled using MADC version 1.2 (Grahić and Grahić, unpublished data).
Genetic structure analyses
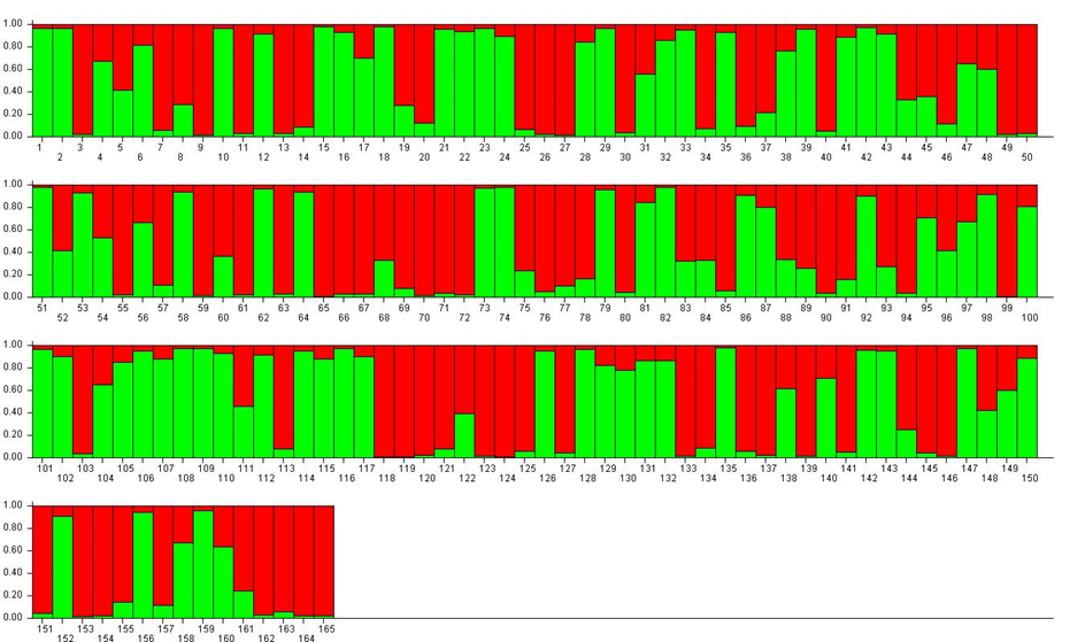
For K = 2, accessions were divided into two approximately equal RPPs (mostly red or mostly green) and a large number of admixed genotypes ($). Among the green-coloured samples (RPP2:1) were P. insititia cultivar no. 81 ‘Kozlienka’ from Slovakia, the feral P. insititia accession no. 82 ‘Krikon’ from Sweden, the Hungarian plums no. 106 ‘Potyó fehér’ and no. 107 ‘Potyó szilva’, and the Central–Eastern European prunes also known as zwetschen (e.g., no. 108 ‘Požegača’). Red-coloured samples (RPP2:2) instead included the French prunes of ‘d’Agen’ type (no. 36 and 37), most of the greengages (no. 118–121, 123 and 124) and large-fruited cultivars grown across Europe as dessert plums (e.g. no. 153 ‘Victoria’).
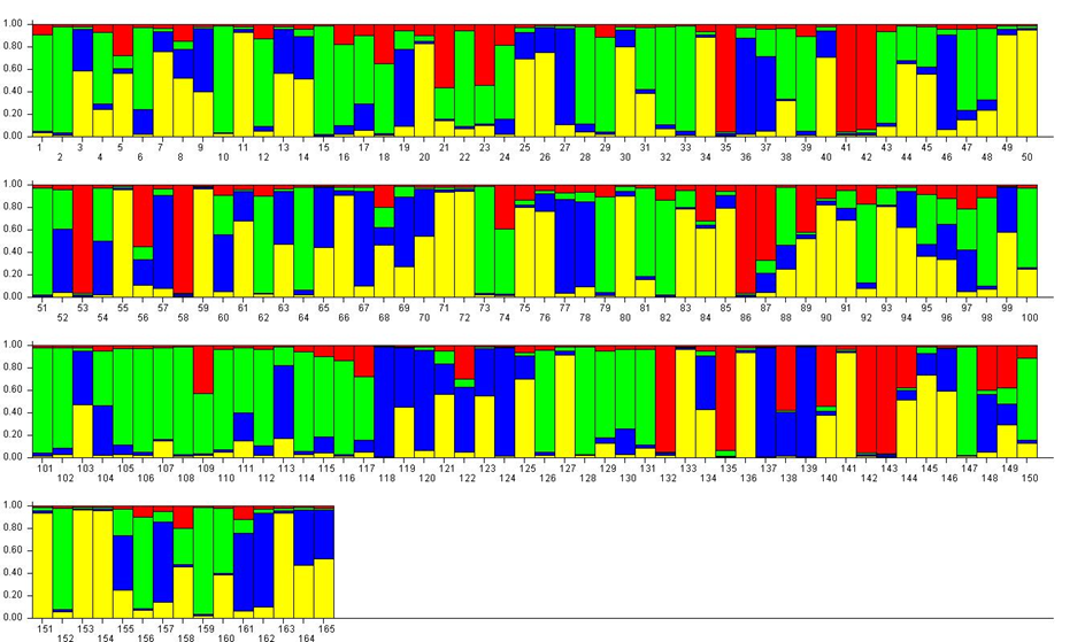
For K = 4, the previous RPP2:1 (≈ P. insititia) was split into one large (green, RPP4:1) and one smaller (red, RPP4:2) RPP (Figure 3). RPP4:1 contained the above-mentioned ‘Kozlienka’, ‘Krikon’, ‘Potyó fehér’, ‘Potyó szilva’ and ‘Požegača’, as well as small-fruited plums of the damson or bullace type like the Italian ‘Ramassin’ (no. 115–117). RPP4:2 instead comprised several Norwegian landrace plums but also e.g. ‘Spilling’ (no. 135) collected in Denmark but most likely of German origin. The previous RPP2:2 (P. domestica s.s.) was split into one larger RPP (yellow, RPP4:3) with ‘Victoria’ and many other large-fruited dessert plums, and one smaller (blue RPP4:4) with greengages like ‘Reine Claude Bålnäs’ (no. 118) and ‘Reine Claude grande verte’ (no. 124) as well as the French prunes.
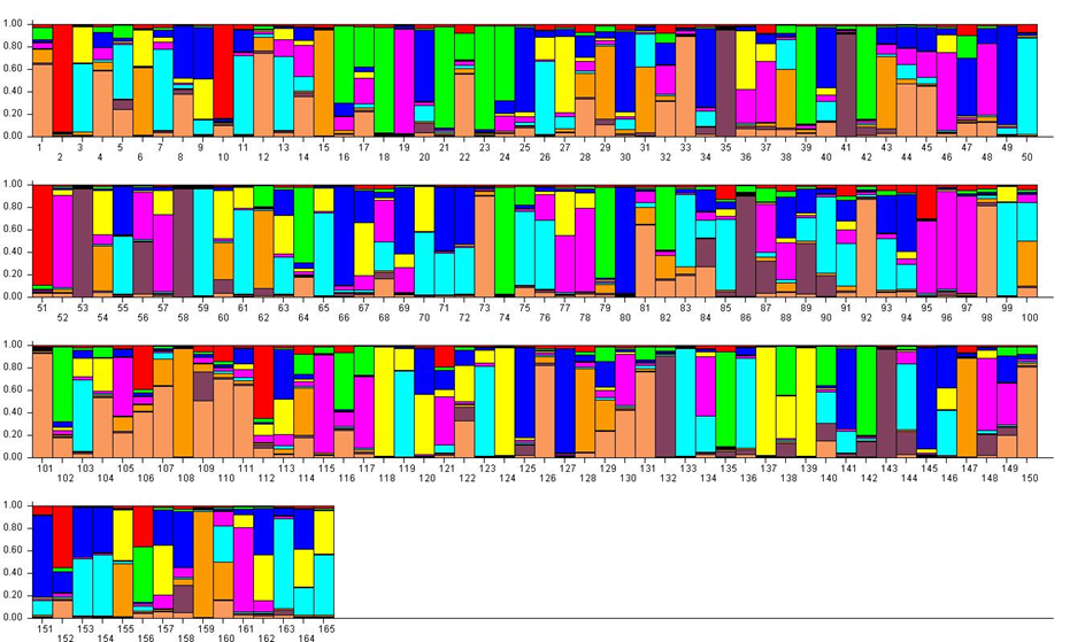
For K = 9, most samples showed an admixed genotype (Figure 4). The previous RPP4:1 was divided into three RPPs with the largest (dusty pink, RPP9:1) containing small-fruited accessions like ‘Cariadoggia’ (no. 33) and ‘Muninca’ (no. 101) from Italy, 'Karsavas' (no. 73) from Latvia and ‘Moravka’ (no. 98) from Serbia. The zwetschen (e.g. ‘Požegača’) were found in the second (orange, RPP9:2), while two putatively diploid samples (no. 2 and no. 51) and the Greek ‘Asvestochoriou’ (no. 10) made up the third (red, RPP9:3). The previous RPP4:2 was split into two RPPs containing mainly Norwegian landraces (green, RPP9:4, and brown, RPP9:5, respectively). The previous RPP4:3 was divided mainly into two RPPs with the German ‘Gräfin Cosel’ (no. 49) and ‘Ruth Gerstetter’ (no. 127) in RPP9:6 (dark blue) and some other large-fruited cultivars in RPP9:7 (pale blue). Several well-known cultivars like ‘Victoria’ were denoted as an admixture of these two RPPs. The previous RPP4:4 corresponded relatively closely to RPP9:8 (yellow) and contained mainly greengages. The mirabelles (no. 95–97, 161 and possibly also no. 52) formed a RPP of their own (purple, RPP9:9) in spite of having admixed genotypes at lower K-values.
Conclusions
In this contribution we present, for the first time, a set of nine SSR loci recommended by the ECPGR Prunus working group for use in genotyping of European plums, and for analyses of genetic variation and structure. A set of seven reference cultivars is proposed. A compiled dataset with allelic information for 165 accessions is presented as a resource to allow comparison of further datasets. Genotyping of these 165 accessions showed that all loci produce highly polymorphic genetic profiles, while analysis of genetic structure revealed a major dichotomy between P. insititia-related accessions and cultivars belonging to P. domestica sensu stricto, as well as differentiation among minor subgroups defined by pomological traits and geographical origin. By adding genetic profiles for new samples into this dataset, researchers can easily check whether they are synonymous with any of the present 165 accessions and also check for parent-offspring relations. In addition, performance of genetic structure analyses with all available samples is likely to provide valuable information about pomological grouping of the new samples in genetic collections as well as in plant breeding programs.
Author contributions
HN managed projects where the proposed set of SSR loci were used, wrote a major part of the manuscript. DG is the chair of ECPGR Prunus Working Group, assisted in organizing projects where the markers were used, assisted with writing the manuscript. MO is the coordinator of the ’Prunus alignment’ project where the SSR loci were used, assisted with writing the manuscript. SHH is the coordinator of the ’PRUNDOC’ project where the SSR loci were used, assisted with writing the manuscript. JG performed statistical evaluations. FG supervised evaluation of amplification products, performed some statistical evaluations, assisted with writing the manuscript.
Conflict of interest statement
The authors declare that no conflict of interest exists.
Supplemental data
Supplementary Table 1. SSR profiles for 165 European plum accessions. Sample numbers are the same as used in the Bayesian genetic structure analyses (Figure 2, Figure 3 and Figure 4), while Study = 1 refers to accessions analysed in21 and Study = 2 refers to accessions analysed in Sehic et al. (2015). Reference accessions (Ref) are given at the end of the table. Profiles for each SSR are indicated as allele sizes in base pairs.