Expanding the genetic diversity of chickpeas from the Ukrainian genebank to new agricultural systems
Nadiia Vusa,b,*, Olha Bezuhlab, Serhii Sylenkoc, Antonina Vasylenkob, Viacheslav Sichkard, Mykola Kondratenkoe, Margarita Barylkof
a Agroécologie, INRAE, Institut Agro, Univ. Bourgogne, Univ. Bourgogne Franche-Comté, F-21000 Dijon, France
b Yuriev Plant Production Institute of NAAS, Kharkiv, Ukraine
c Ustymivka Experimental Plant Growing Station of Yuriev Plant Production Institute of NAAS, Ustymivka, Hlobynskyi District, Poltava Region, Ukraine
d Plant Breeding and Genetics Institute – National Center of Seed and Cultivar Investigation, Odesa, Ukraine
e Institute of Feed Research and Agriculture of Podillya NAAS, Vinnytsia, Ukraine
f Poltava State Agricultural Research Station named after M.I. Vavilov, Institute of Pig Breeding and Agro-Industrial Production of NAAS of Ukraine, Poltava, Ukraine
* Corresponding authors: Nadiia Vus (vus.nadezhda@gmail.com)
Abstract: Enhancing crop resilience to abiotic factors in an increasingly unstable climate is a critical challenge, one that can be met by actively using the existing gene pool of the crops. A total of 26 new chickpea lines with diverse ancestry were selected from the Ukrainian genebank with the objective of widening the genetic base and creating varieties that are more adaptable to the prevailing climatic conditions in Ukraine. The research was conducted between 2019 and 2021 at four distinct locations: dry forest-steppe, Kharkiv region (Elitne); wet forest-steppe, Poltava region (Ustymivka) and hyper-humid Polissya, Vinnytsia region (Bokhonyky); and the extremely arid conditions of the Odesa region (Khlibodarske, 2020). A GGE-biplot analysis was utilized to assess the adaptability of the chickpea lines to diverse environmental conditions. New breeding lines with an elevated degree of adaptability to the Ukrainian forest-steppe zone were identified. Furthermore, three new sources with potential resistance to hyper-humidity were identified (genotypes 2072, 2067 and 2065). Genotypes 2068 and 2088 have been registered in the NCPGRU as sources of complex valuable traits, and genotype 2087 has been registered as a source of high adaptability. New and existing chickpea accessions from the genebank of Ukraine can serve as the basis for the development of new breeding materials, thus helping solve modern challenges facing breeders.
Keywords: Cicer arietinum, adaptation, genotype–environment interaction, resistance, abiotic stress.
Introduction
Climate change is a key factor driving the emergence of biotic and abiotic stresses that adversely affect agricultural development. Mitigating the consequences of this impact is important for the further development of agricultural production (Raza et al, 2019; Pixley et al, 2023). These measures include the introduction of new crop varieties resilient to changing climatic conditions, adjustments to the geographical distribution of crop cultivation, improvements to crop rotation schemes, and the development of diversification strategies (Hristov, 2020). Although the relocation of agricultural production to areas with more favourable climatic conditions is considered a potential adaptation strategy (Sloat et al, 2020), its successful implementation requires the availability of well-adapted crop varieties. Therefore, the exploration and utilization of genetic resources represent a critical component of climate-resilient agriculture, with crop adaptability and diversification identified as major priorities (Mohammadi et al, 2023). The inclusion of legumes in crop rotations reduces dependence on mineral nitrogen fertilizers due to their symbiotic relationship with nitrogen-fixing bacteria, which can increase the productivity of subsequent crops (Lampkin et al, 2015). European agriculture allocates only 1.5% of arable land to legume cultivation, compared with the global average of 14.5%. At the same time, the European livestock feed market exhibits a high demand for protein-rich ingredients, most of which are supplied by imports of soybeans and soybean meal, accounting for 87% of total supply (Watson et al, 2017). This situation underscores the urgent need to explore alternative legume grains – both domestically produced and imported – to reduce dependence on soybean-based feed. To achieve this, an important strategy is to diversify legume crops beyond those currently widely cultivated and to explore species that are still considered niche crops (Watson et al, 2017; Khan et al, 2024).
Chickpea (Cicer arietinum L.) represents such a crop for Europe. It is a valuable source of protein-rich plant products and is characterized by strong drought tolerance and high seed quality (Berrada et al, 2007). Therefore, it has potential to be incorporated into more diverse legume-based crop rotation systems. Chickpea is one of the world’s most important legumes, ranking third in production area after beans and cowpeas, with 14.8 million ha (17.2%) (FAOSTAT, 2023).
The main world chickpea breeding goals include increasing yield potential, as well as expanding adaptation to various environmental conditions and increasing resistance to biotic and abiotic stresses (Gaur et al, 2007). Genotype-by-environment (G × E) interaction poses a major challenge: varieties bred for high yield in their region of origin often perform poorly elsewhere. This limits their expansion into new regions and undermines stability as local climates shift. This problem is also present in Ukraine. Here, the main chickpea breeding centre, the Plant Breeding and Genetics Institute (PBGI) in Odesa, a region characterized by drought and heat, has developed more than 15 chickpea varieties (The Plant Breeding and Genetics Institute, 2024). Developing new lines from adapted germplasm and evaluating them across novel geographic regions is a key strategy for advancing crop diversification (von Wettberg et al, 2018; Varshney et al, 2021). The assessment of G × E interactions and the evaluation of the adaptability of source material constitute key stages in the breeding process. The region where the genebank is located (Elitne, Kharkiv region) represents a high-risk area for chickpea cultivation. However, long-term research has shown that certain genetic resource accessions are sufficiently adapted to local conditions. In contrast, the Ustymivka location is atypical for chickpea cultivation, while the Bokhonyky location is excessively waterlogged and therefore potentially unsuitable for this crop.
Newly developed chickpea accessions, selected from those that survived in extreme environmental conditions in previous years, drawn from both existing accessions and hybrid combinations, were evaluated under non-standard conditions. The objective of this study was to evaluate newly developed chickpea accessions under contrasting and atypical environmental conditions in order to identify genotypes suitable for the development of new varieties and for expanding chickpea cultivation into non-traditional growing regions (Rebollo et al, 2023; Fritsche-Neto et al, 2025).
This study evaluates the adaptive potential of chickpea genetic resources developed in the Ukrainian genebank under contrasting environmental conditions and provides reference data to support future germplasm research and utilization.
Materials and methods
Plant material
The study examined 26 chickpea (Cicer arietinum L.) breeding lines developed at the Yuriev Plant Production Institute of the National Academy of Agrarian Sciences of Ukraine (Kharkiv, Ukraine; YPPI NAAS) within two research programmes: resistance to Ascochyta rabiei and high-yield selection. The breeding material originated from two sources: (1) elite lines selected over multiple years from the base chickpea collection of the National Center for Plant Genetic Resources of Ukraine (NCPGRU) that survived under Ascochyta epiphytotic pressure; (2) lines derived from targeted hybridization; a third group consists of standard accessions that are well adapted to the local environmental conditions.
All genotypes underwent a multi-stage selection process aimed at identifying lines with resistance to Ascochyta under field conditions. Parental combinations were chosen based on preliminary evaluations of chickpea adaptability to the environmental conditions of the Eastern Forest-Steppe zone of Ukraine (Table 1). Detailed passport data for all genotypes are available via their catalogue numbers at NCPGRU or through the international plant genetic resources for food and agriculture (PGRFA) information platform, Genesys-PGR (Genesys-PGR, 2025).
Table 1. Chickpea genotypes included in the study and their origin. NCPGRU, National Center for Plant Genetic Resources of Ukraine. *, Accession that does not have a catalogue number but only a collection working number.
|
Catalogue number of NCPGRU |
Genotype name |
Pedigree |
|
1) Individual selection |
||
|
UD0502239 |
2065 |
UD0500093 – Local variety, India |
|
UD0502240 |
2066 |
UD0500134 – Local variety, Spain |
|
UD0502241 |
2067 |
UD0500733 – LR 17 1, Syria |
|
UD0502245 |
2068 |
|
|
UD0502246 |
2069 |
UD0502065 – LUH 106-07, Ukraine |
|
UD0502247 |
2070 |
UD0502093 – Local variety, Ukraine |
|
UD0502248 |
2071 |
UD0500196 – Local variety, Azerbaijan |
|
UD0502249 |
2072 |
UD0500240 – ILC 3279, Syria |
|
UD0502242 |
2073 |
UD0500444 – Dniprovskyi vysokoroslyi, Ukraine |
|
UD0502250 |
2074 |
UD0502112 – Local variety, Ukraine |
|
UD0502251 |
2075 |
UD0502111 – Local variety, Russia |
|
UD0502252 |
2076 |
UD0501504 – Local variety, Ukraine |
|
UD0502253 |
2077 |
UD0500671 – K 4-select, India |
|
2) Breeding lines |
||
|
UD0502254 |
2078 |
Rozanna (UD0500424) X Krasnokutskyi 123 (UD0500101) |
|
UD0502255 |
2079 |
Rozanna (UD0500424) X Krasnokutskyi 123 (UD0500101) |
|
UD0502256 |
2080 |
Antei (UD0500735) X Krasnokutskyi 123 (UD0500101) |
|
UD0502257 |
2081 |
Antei(UD0500735) X Krasnokutskyi 123 (UD0500101) |
|
UKR001:02082* |
2082 |
Krasnokutskyi 123(UD0500101) X Antei (UD0500735) |
|
UD0502258 |
2083 |
Krasnokutskyi 123(UD0500101) X Antei (UD0500735) |
|
UD0502259 |
2084 |
Krasnokutskyi 123(UD0500101) X Antei (UD0500735) |
|
UD0502260 |
2085 |
Krasnokutskyi 123(UD0500101) X Antei (UD0500735) |
|
UD0502243 |
2086 |
Luhanets (UD0500102) X Antei (UD0500735) |
|
UD0502261 |
2087 |
Luhanets (UD0500102) X Antei (UD0500735) |
|
UD0502262 |
2088 |
Luhanets (UD0500102) X Antei (UD0500735) |
|
UD0502263 |
2089 |
Luhanets (UD0500102) X Antei (UD0500735) |
|
UD0502264 |
2090 |
Luhanets (UD0500102) X Antei (UD0500735) |
|
3) Standard accessions (adapted to local conditions) |
||
|
UD0500424 |
Rozanna |
For Elitne and Bokhonyky |
|
UD0500101 |
Krasnokutskyi 123 |
For Elitne and Bokhonyky |
|
UD0502025 |
Odisei |
For Ustymivka |
|
UD0500736 |
Pamiat |
For Khlibodarske |
Field trials
The field experiments were carried out at four locations in Ukraine. Three-year trials (2019–2021) were conducted at Elitne, Ustymivka, and Bokhonyky. An additional site, Khlibodarske, was included in 2020 to evaluate genotype performance under extremely arid climatic conditions (Figure 1).
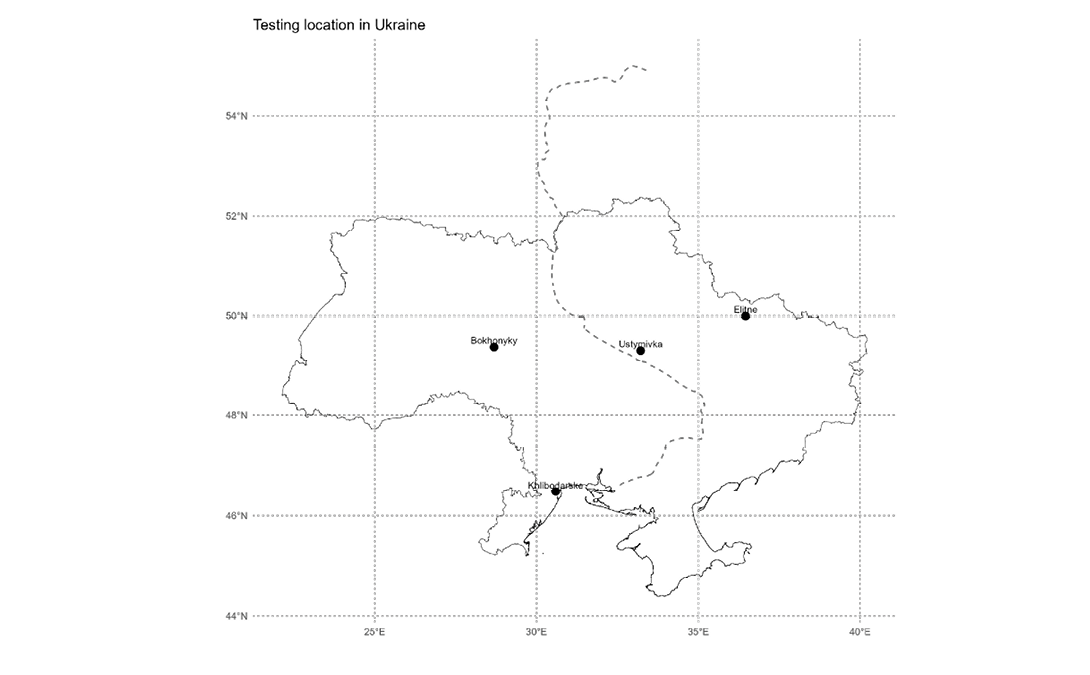
A summary of the climatic and weather characteristics of each location is presented in Supplemental Table 1.
A 4-year crop rotation was applied, with winter wheat systematically used as the preceding crop for chickpea. The experiments were conducted in accordance with the Methodical Recommendations for Studying the Genetic Resources of Grain Legumes (Kobyzeva et al, 2016). Each experimental plot covered an area of 1m², and the sowing scheme was 30cm × 10cm, comprising three rows of 10 plants (30 plants per plot). Seeds were sown manually. Phenological observations, analysis of the crop structure of accessions were carried out according to methodological recommendations for the study of genetic resources of leguminous crops (Kobyzeva et al, 2016) and taking into account the chickpea traits ontology (Rani Das et al, 2024).
Following the methodology for genetic resource evaluation, and considering the absence of replications, one plot of the specific reference accession selected for the respective location was included every 20 plots to ensure accurate field assessment of all tested entries with normalization of the yield of all tested accessions relative to the average for the block of standard-accessions. To correct for field inhomogeneity, a standard shift correction was used, using a correction through the average of the standard block (Rozanna and Krasnokutskyy 123). Hand harvesting was performed. Before threshing, plant height (M1) and the height of the lowest pod attachment (M2) were measured using a ruler under laboratory conditions. Plants were then threshed individually using a laboratory thresher. Plot yield (P3) was calculated based on the seed weight recorded immediately after threshing. Seed yield per plant (P1) was calculated by dividing the yield (P3) by the number of plants harvested. The weight of 100 seeds (P2) was determined by manual counting and weighing in laboratories in five replicates.
Meteorological conditions were recorded directly at the experimental stations during the study period. The duration of phenological phases is noted for each accession: F2, days from germination to 50% flowering (vegetative period); F8, days from 50% flowering to full maturity (generative period); F5, days from germination to full maturity (complete vegetation period). For these periods meteorological variables were assessed for each genotype. The assessment included the cumulative effective temperatures more than 10°C (TF5) and total precipitation (PF5) for the entire growing period (from germination to full maturity). These parameters were also calculated separately for the vegetative phase (from germination to 50% flowering) and the generative phase (from 50% flowering to full maturity) for each accession (TF2 – PF2 and TF8 – PF8, respectively).
Statistical analysis and data visualization
All statistical analyses and data visualization were performed using R software version 4.2.2 (R Core Team, 2023). Data preprocessing and basic statistical calculations were conducted using the ‘openxlsx’ (Schauberger & Walker, 2022), ‘tidyverse’, and ‘rlang’ packages (Henry & Wickham, 2023). Graphical visualization was carried out using ‘ggplot2’ (Wickham, 2016), with figure composition supported by ‘patchwork’ (Pedersen, 2024) and label optimization by ‘ggrepel’ (Slowikowski, 2024). Spatial visualization and mapping of experimental sites were performed using the ‘terra’ package (Hijmans, 2025).
Multiple factor analysis (MFA) was applied to explore relationships among groups of quantitative and qualitative variables using the ‘FactoMineR’ package (version 2.7) implemented through the ‘Factoshiny’ graphical interface (Vaissie et al, 2023). A multivariate analysis was performed to provide a comprehensive assessment of the accessions and environmental conditions. All quantitative traits were grouped into four categories:
- Yield traits: P1, seed yield per plant; P2, 100-seed weight; P3, seed yield per area
- Morphological traits: M1, plant height; M2, height of the lowest pod
- Phenological traits: F2, days from germination to 50% flowering; F5, days from germination to full maturity; F8, days from 50% flowering to full maturity
- Meteorological variables: TF2, sum of temperatures >10°C during the vegetative period; PF2, sum of precipitation during the vegetative period; TF8, sum of temperatures >10°C during the generative period; PF8, sum of precipitation during the generative period; TF5, sum of temperatures >10°C from germination to full maturity; PF5, sum of precipitation from germination to full maturity.
Three qualitative variables were included as supplementary: genotype, year, and location (place).
Quantitative variable groups were standardized (mean = 0, standard deviation = 1), and the analysis was based on the correlation matrix. Qualitative variables were included as supplementary variables and projected onto the factor space to facilitate the interpretation of relationships among genotypes, years and environments.
Ecological evaluation of genotypes was performed using the ‘metan’ package (Olivoto & Lúcio, 2020). Replicated trials could not be conducted due to the limited amount of seeds. However, the package allows the analysis of multi-environment trials even when replications are not available. Genotype adaptability and stability across environments were assessed using GGE biplot analysis with the following settings: Scaling = 0 (no scaling of eigenvalues) and Centering = 2 (environment-centred). Singular value partitioning (SVP) was set to 1 for genotype performance and stability assessment based on environmental variation, and SVP = 3 was applied for the ‘which-won-where’ pattern analysis (Olivoto, 2023). Genotype ranking was conducted using the GGE biplot ranking view (type 8), where genotypes were compared with a virtual ‘ideal genotype’ defined by maximum mean performance and absolute stability. Ranking was based on Euclidean distance to this reference point (Yan et al, 2007).
Additionally, regression coefficients (bi) and residual standard deviations were estimated using the Finlay–Wilkinson regression model (Finlay & Wilkinson, 1963). Linear models were fitted using the lm() function from the stats package implemented in the R environment.
Results
Meteorological conditions during the study period showed considerable variability, allowing for a comprehensive evaluation of the chickpea lines (Figure 2).
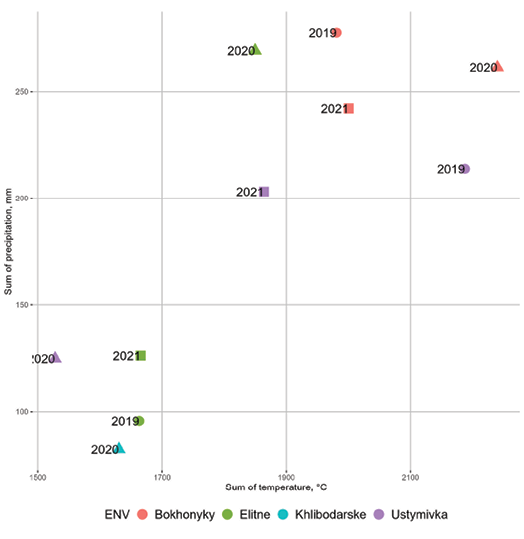
Bokhonyky, representing an extra-wet environment, exhibited high precipitation (≥ 240mm) and low temperatures at the beginning of the growing season in all three study years. Khlibodarske, identified as an extra-dry location in 2020, experienced extreme drought throughout the growing season, although temperatures were not excessively high. In Elitne and Ustymivka, environmental conditions varied widely: from extremely dry (Elitne in 2019 and 2021; Ustymivka in 2020) to overly wet, approaching those of Bokhonyky (Elitne in 2020; Ustymivka in 2019).
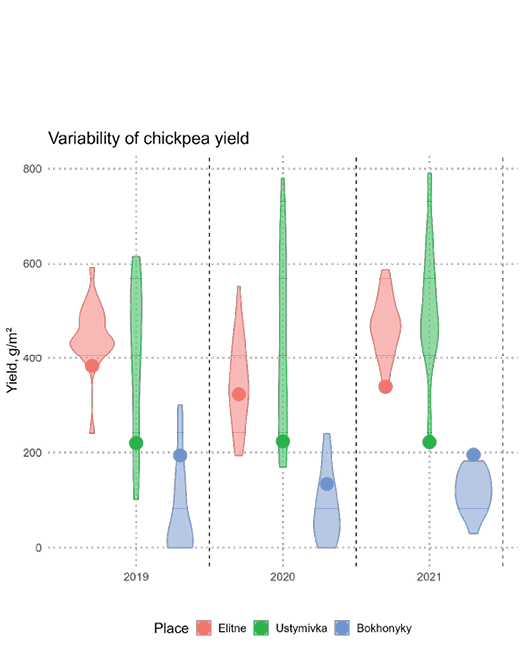
To compare the response of chickpea yield to annual variation, the yield of standard accessions was evaluated at each observation point. In Elitne and Bokhonyky, the standards were Rozanna and Krasnokutskyi 123; in Ustymivka, the standard was Odisei; and in Khlibodarske it was Pamiat, all selected for optimal adaptation to local conditions. The mean yield of standard-accessions in Elitne indicated that all study years were favourable for chickpea, with high productivity (395g/m² in 2019; 295.8g/m² in 2020; 367.9g/m² in 2021). In contrast, weather conditions in Ustymivka were atypical, resulting in consistently lower yields for the standard Odisei (220.1g/m² in 2019; 223.8g/m² in 2020; 222.2g/m² in 2021). Lower yields were also recorded in Bokhonyky (194.1g/m² in 2019; 134g/m² in 2020; 195.5g/m² in 2021). In Khlibodarske, the standard Pamiat produced only 71.3g/m², highlighting the severity of environmental stress for chickpea. Across the three primary test sites, under waterlogged conditions in Bokhonyky, the mean yield of chickpea accessions was significantly lower than in Ustymivka and Elitne (Figure 3).
Analysis of variance (ANOVA) confirmed significant differences for all observed traits between the three main test sites and across study years. Detailed agronomic and phenological data are presented in Table 2.
Table 2. Analysis of variance for 26 chickpea accessions in ecological testing (2019–2021) at three locations: Elitne (Kharkiv region), Ustymivka (Poltava region) and Bokhonyky (Vinnytsia region).
1, data demonstrated in the format mean (min-max). Statistically significant: *** at P < 0.001; ** at P < 0.01; * at P < 0.05
|
Location |
Elitne |
Ustymivka |
Bokhonyky |
Source of variation |
|||||||
|
Year |
2019 |
2020 |
2021 |
2019 |
2020 |
2021 |
2019 |
2020 |
2021 |
Location |
Year |
|
Seed yield per plant (P1), g |
13.12 (7.60–21.20)1 |
10.90 (7.61–16.68) |
17.96 (13.80–25.51) |
21.88 (8.6–33.5) |
8.66 (1.6–28.8) |
13.25 (3–23.5) |
3.82 (0–14.08) |
9.80 (0–30.32) |
6.96 (2–12.25) |
66.86*** |
11.04*** |
|
Weight of 100 seeds (P2), g |
31.69 (23.69–41.82) |
31.0 (23.0–42.4) |
31.43 (22.19–41.58) |
29.59 (22.0–47.11) |
28.89 (21.0–39.0) |
33.58 (26.0–49.0) |
18.99 (0–5.12) |
25.49 (0–37.9) |
26.09 (20.7–31.0) |
29.925*** |
4.568* |
|
Seed yield per area (P3), g/m2 |
447.92 (240.8–591.6) |
343.96 (194.07–551.6) |
461.80 (331.23–586.95) |
390.92 (102–615) |
412.12 (170–780) |
501.76 (220–790) |
80.47 (0–300.04) |
91.44 (0–239.89) |
119.94 (18.92–196.37) |
204.99*** |
9.596*** |
|
Plant height (M1), cm |
40.35 (27.2–54) |
41.35 (26–56.8) |
57.42 (40.8–73.8) |
48.58 (40–65) |
55.81 (49.4–65) |
50.70 (36–65) |
41.45 (0–80) |
72.38 (0–105) |
61.25 (45–85) |
7.957*** |
19.88*** |
|
Height of the lowest pod (M2), cm |
24.3 (12.4–36.4) |
20.01 (11.4–28.8) |
35.96 (24.2–46.6) |
24.49 (17.8–40) |
28.39 (22.6–35) |
26.22 (16.5–37.5) |
25.31 (0–49) |
37.86 (0–55) |
32.50 (20–45) |
5.938** |
12.24*** |
|
Days from germination to 50% flowering (F2) |
34.42 (26–43) |
39.69 (36–42) |
40.12 (36–46) |
38.67 (32–46) |
34.25 (32–35) |
38 (38–38) |
46.2 (43–49) |
48.81 (46–51) |
50.15 (43–56) |
384.73*** |
25.58*** |
|
Days from germination to full maturity (F5) |
77.42 (67–86) |
91.68 (82–105) |
76.5 (72–80) |
92.63 (92–99) |
72 (72–72) |
85.46 (84–89) |
106.27 (103–109) |
126.95 (124–128) |
107.4 (103–113) |
1678.90*** |
67.31*** |
|
Days from 50% flowering to full maturity (F8) |
43 (31–47) |
51.99 (44–65) |
36.38 (32–40) |
53.96 (46–60) |
37.75 (37–40) |
47.46 (46–51) |
60.07 (56–63) |
78.14 (74–81) |
57.25 (52–66) |
781.7*** |
108.6*** |
|
Sum of temp. >10°C, during the vegetative period, °C (TF2) |
659.65 (548.1–833.1) |
635.69 (541.7–689.9) |
756.02 (655.5–913.5) |
923.88 (763.7–1108.5) |
613.95 (554.4–633.8) |
665.60 (665.6–665.6) |
785.37 (733.5–840.4) |
625.67 (569.6–673.9) |
752.61 (585.5–885.4) |
15.91*** |
131.3*** |
|
Sum of prec. during the vegetative period, mm (PF2) |
62.74 (34.3–76.8) |
137.9 (137.9–137.9) |
112.05 (111.7–118.8) |
172.87 (133.3–194.9) |
83.53 (83.3–83.6) |
135.1 (135.1–135.1) |
192.61 (182.1–200.5) |
163.77 (133.6–166.8) |
147.08 (133–154.1) |
974.68*** |
40.49*** |
|
Sum of temp. >10°C, during the period from germination to full maturity, °C (TF5) |
1662.62 (1443.8–1829.9) |
1837.8 (1615.8–2133.4) |
1664.74 (1537.1–1777.5) |
2187.58 (2175.3–2311.7) |
1527.9 (1527.9–1527.9) |
1864.07 (1824.2–1960.9) |
1980.97 (1929–2023.3) |
2239.82 (2190.5–2258.6) |
2000.49 (1908.4–2105.8) |
316.7*** |
22.5*** |
|
Sum of prec. during the period from germination to full maturity, mm (PF5) |
96.27 (75.4–105.2) |
269 (269–269) |
126.4 (126.4–126.4) |
213.8 (208.1–254.9) |
125 (125–125) |
203.18 (200.9–208.7) |
277.32 (268.7–280) |
261.22 (230–263.2) |
241.78 (234.5–246.5) |
4242.7*** |
419.1*** |
|
Sum of temp. >10°C during the generative period, °C (TF8) |
1027.35 (861.6–1115.7) |
1226.9 (1040.1–1514.5) |
934.05 (812.2–1052.6) |
1288.48 (1093.9–1438.1) |
939.13 (918.5–1001) |
1220.07 (1180.2–1316.9) |
1195.6 (1099.8–1256.2) |
1614.15 (1530.9–1671.6) |
1247.88 (1127.3–1438.6) |
219.71*** |
44.11*** |
|
Sum of prec. during the generative period, mm (PF8) |
34.02 (17.4–41.1) |
131.1 (131.1–131.1) |
14.63 (12.8–14.7) |
40.93 (13.2–74.8) |
41.7 (41.7–41.7) |
68.08 (65.8–73.6) |
84.71 (79.4–86.7) |
97.45 (96.4–109.6) |
94.7 (86.6–110.4) |
473.8*** |
474.3*** |
|
Temperature range |
21 (5,9–30,1) |
20 (8,9–29,5) |
21,5 (9,8–36) |
21,4 (9,2–28,4) |
20,9 (10,2–33) |
20,5 (10,1–30,1) |
18,7 (6,3–25,3) |
18,2 (6,4–27,6) |
18,8 (8,6–26,8) |
- |
- |
Multiple factor analysis (MFA) explained 67.71% of the total variation by the first two dimensions (44.51% and 23.2%, respectively) (Figure 4).
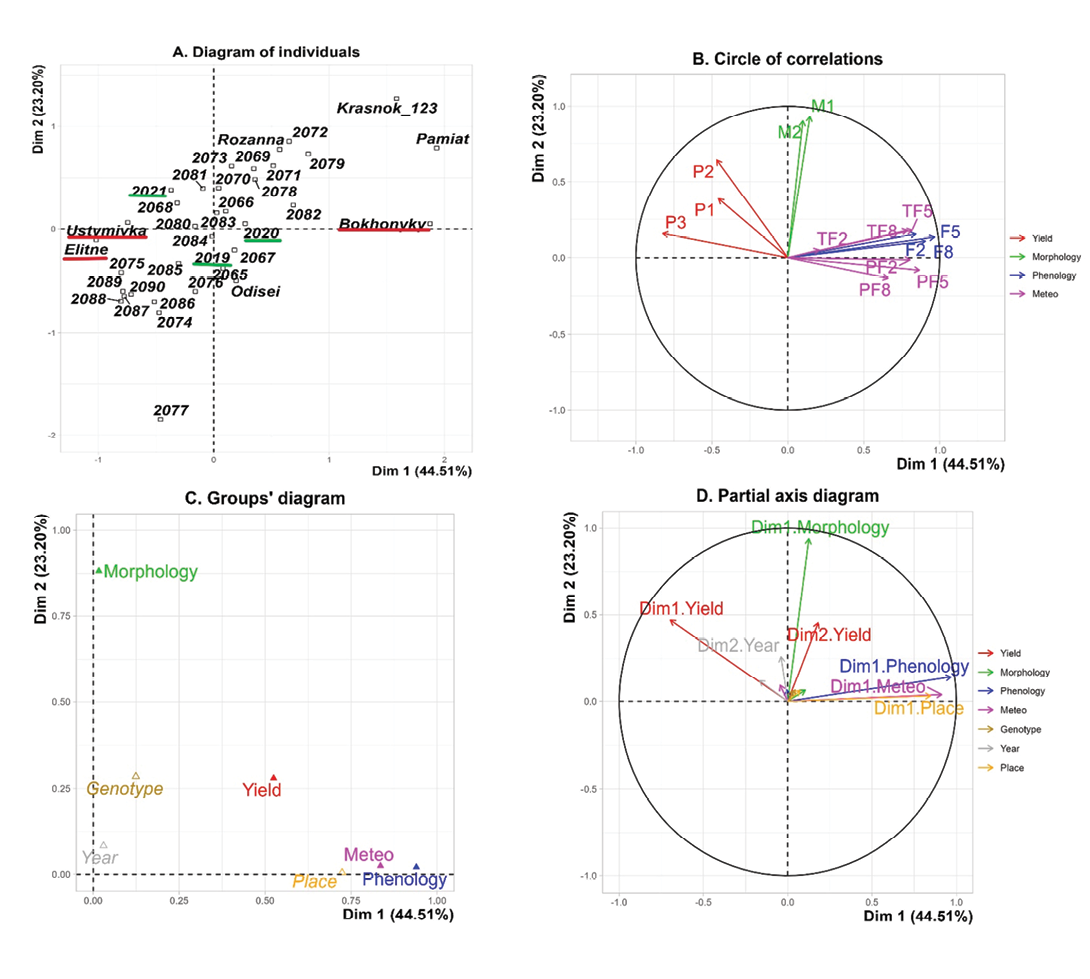
Figure 4. Multiple factor analysis (MFA). In the individual factor map (A. Diagram of individuals), red labels indicate test locations, green labels indicate years, and unlabelled numbers represent genotypes. Colours in other diagrams correspond to trait groups. P1, seed yield per plant; P2, 100-seed weight; P3, seed yield per area, M1, plant height; M2, height of the lowest pod; F2, days from germination to 50% flowering; F5, days from germination to full maturity; F8, days from 50% flowering to full maturity, TF2, sum of temperatures > 10°C during the vegetative period; PF2, sum of precipitation during the vegetative period; TF8, sum of temperatures > 10°C during the generative period; PF8, sum of precipitation during the generative period; TF5, sum of temperatures > 10°C from germination to full maturity; PF5, sum of precipitation from germination to full maturity.
The individuals’ plot (Figure 4A) was constructed by projecting individuals onto the first two factorial axes of the MFA, where the coordinates of each individual are defined as a weighted linear combination of the normalized values of the variables on the corresponding axes. The closer the genotypes are, the more similar they are across all groups of variables. The position of an individual relative to the axes reflects its profile on the variables that are most correlated with the corresponding factors. Additional categorical variables, location and year, are also superimposed on the individual plot (for illustrative purposes). Thus, the accessions in the left part of the graph have higher than average yield and its components, which better realized their potential in the conditions of Ustymivka and Elitne. The samples in Bokhonyky are characterized by an extension of the growing season due to waterlogging, but low yield. The MFA revealed a marked distinction between Bokhonyky and the other two sites (Figure ٤A). The first axis was driven primarily by weather variables and associated phenophases durations, which differed strongly across locations. The second axis reflected variability in morphological traits. Yield traits showed strong negative correlations with phenophases duration and meteorological conditions (Table 3).
Table 3. Correlation coefficients for quantitative variables.
GGE-biplot analysis
Yield remained the most informative trait reflecting genotype adaptability. Given the importance of yield as the primary economic trait, this variable was selected for genotype evaluation using the GGE-biplot method. The method followed the framework of Rakshit et al (2012), comparing genotypes relative to the ‘ideal genotype’, defined as maximum yield across environments. Multi-location data were analyzed without scaling (‘Scaling = 0’), centred by environment (‘Centering = 2’), and square-root transformed before analysis. Genotype evaluation employed genotype-centred singular value partitioning (SVP = 1) in the ‘Mean vs. Stability’ view.
According to the GGE-biplot framework, G × E interaction was represented by the first two principal components (PC1 and PC2). PC1 reflected the average yield of a genotype across all environments, whereas PC2 described its stability (variability across environments). In the present study, PC1 and PC2 together explained from 82.73% (PC1, 58.2%; PC2, 24.5%, Elitne) to 94% (PC1, 84.3%; PC2, 9.7%, Bokhonyky) of the total variation, validating the effectiveness of the model for genotype comparison (Figure 5).
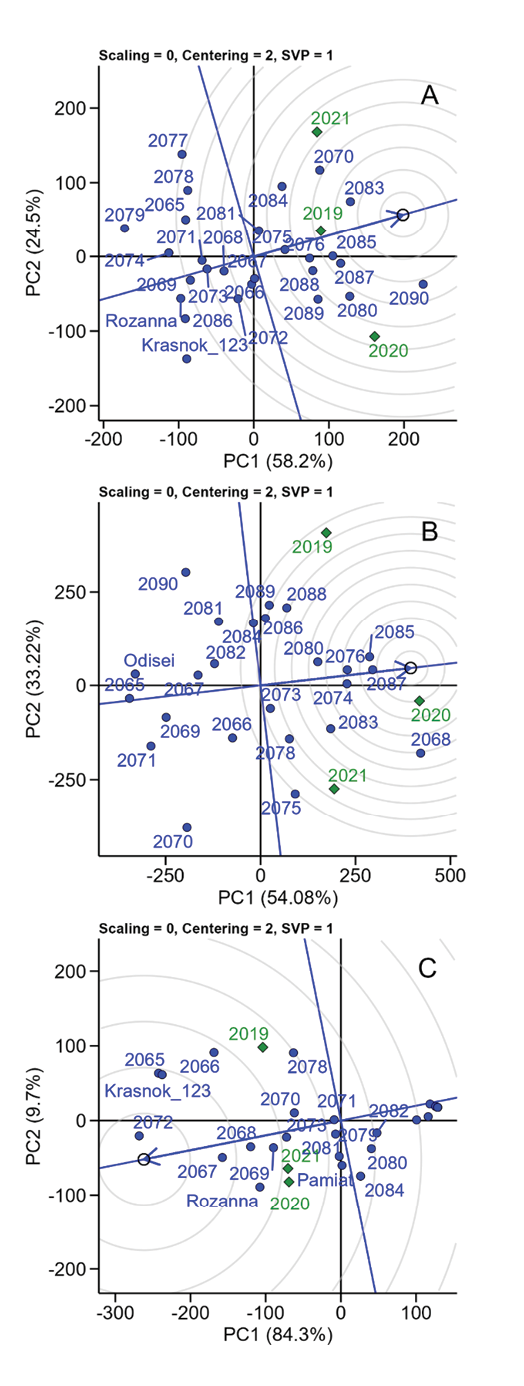
In Elitne, the genotypes closest to the ideal genotype were 2083, 2085, 2087, and 2090. The standard-accessions Krasnokutskyi 123 and Rozanna were positioned at the periphery. Among the years, 2019 was closest to optimal conditions, whereas 2020 and 2021 deviated substantially. In Ustymivka, the most favourable year was 2020, while 2019 was the least favourable. The best-performing genotypes were 2085, 2087, 2076, and 2074. The standard Odisei showed low productivity across all years. Environmental conditions in Bokhonyky were unfavourable in all years, as indicated by the consistently negative PC1 direction. Years 2020 and 2021 were similar, whereas 2019 differed but remained suboptimal. The best genotypes were 2072, 2067, 2068, 2069, and 2065. Standards Rozanna and Krasnokutskyi 123 also performed well; Pamiat showed average performance.
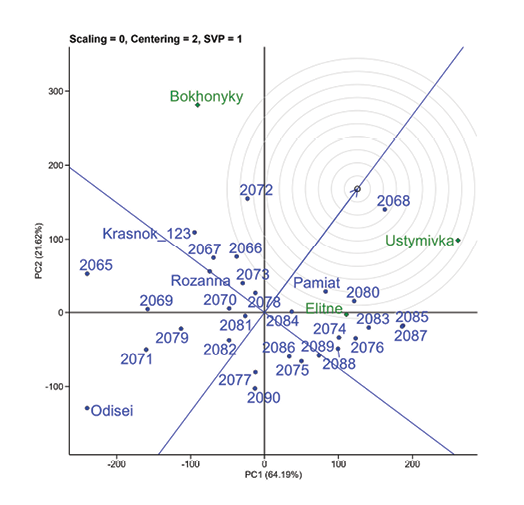
The overall graph for three locations over three years (Figure 6) illustrates how large the difference between test points is and how difficult it is to find a universal ideal genotype: the vast majority of genotypes are located outside the circles. The genotype 2068 is highlighted as the closest to the ideal.
Adding the fourth extremely arid location Khlibodarske to the calculations slightly changed the overall axis loading indicators (PC1, 63.02%; PC2, 20.53%) (Figure 7). The Khlibodarske point, due to its low average yield and variability, has a low impact on the overall assessment and is located almost at the centre of the coordinates, but complements the overall assessment.
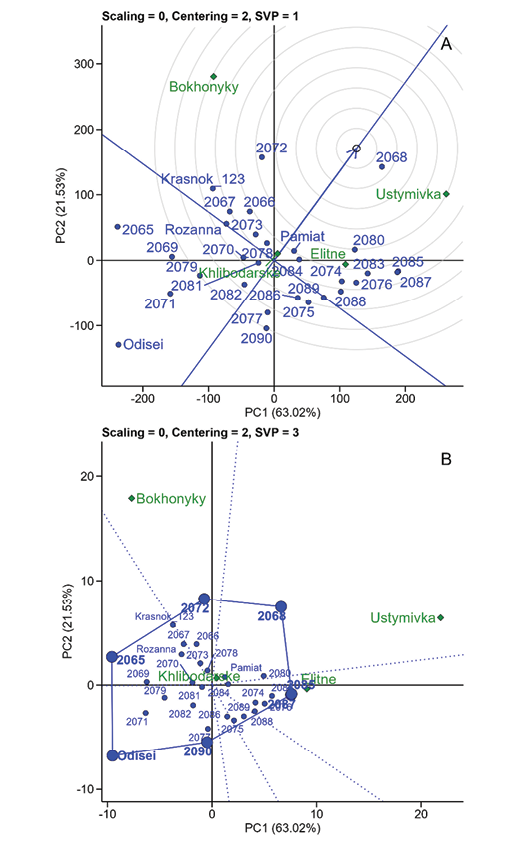
Figure 7. Ranking of genotypes (blue points) for chickpea yield in four locations (green diamonds), total for three years (2019–2021). A, relative to the ideal genotype (small circle at the average environment coordinate, AEC), B, ‘which-won-where’, i.e. the best adaptive genotypes for each location.
The SVP = 3 estimation method (singular value is symmetrically partitioned into the genotype and the environment eigenvectors) was applied to the same conditions, which allows us to assess ‘which-won-where’ (Figure 7B). The genotypes are located at the vertices of the polygon depending on their sensitivity to the environment. Thus, genotype 2068 reacts positively to the environment, and Odisei negatively. Genotype 2078 – closest to the centre of coordinates – is the most stable in all locations. This method also allows us to visualize accessions adapted to each location. For example, 2072 for Bokhonyky, 2085 and 2087 for Ustymivka and Elitne. As confirmed by the results of the analysis of each location separately (Figure 5). Genotype 2090 and Odisei have high yield potential, but are sensitive to growing conditions (Yan et al, 2007; Olivoto, 2023).
Due to the significant variability of weather conditions within each location, it was decided to analyze each location in each year as a single test site (Figure 8).
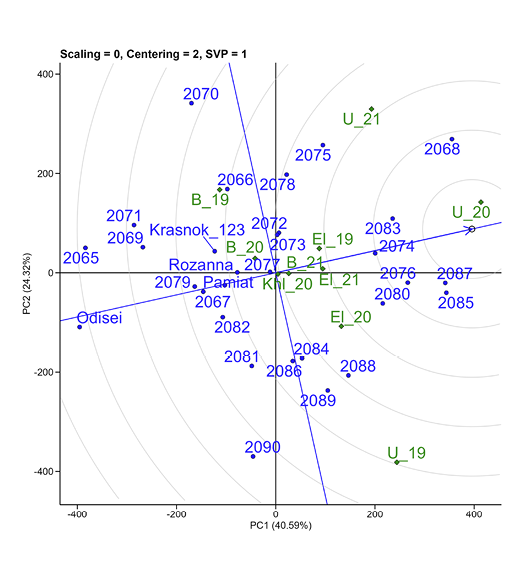
Figure 8. Ranking of genotypes (blue points) relative to an ideal genotype (the small circle on average environment coordinate for chickpea yield at each location by one year as an individual environment. Green diamonds indicate location × year combinations: El_19, El_20, El_21, Elitne; U_19, U_20, U_21, Ustymivka; B_19, B_20, B_21, Bokhonyky in 2019, 2020, 2021, respectively; Khl_20, Khlibodarske in 2020.
The conditions in Ustymivka in 2020 were optimal for the studied chickpea accessions. Genotypes 2068, 2083, 2087, and 2085 showed wide adaptability.
For additional validation of the stability of chickpea accessions, a Finley-Wilkinson regression analysis was performed (Figure 9).
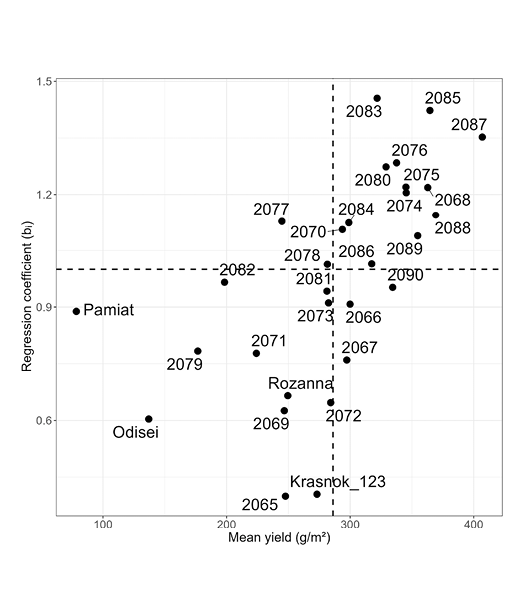
Figure 9. Finlay-Wilkinson (1963) regression plot: mean yield and environmental responsiveness (bi) of genotypes across all environments. Dashed lines, average stability (bi = 1) and mean yield of all accessions in this study (286.2g/m2)
Genotypes above the dashed line are sensitive to environmental conditions and have high yield potential, which is realized under favourable conditions. All standard-accessions are stable and are located below the dashed line. Broadly adapted genotypes were defined as those showing regression coefficients close to unity (bi ≈ 1) combined with low deviations from regression (SD residuals), indicating average environmental responsiveness and high yield stability. Environments were defined as year × location combinations. Finlay-Wilkinson regression was performed using environmental indices calculated as the mean yield of all genotypes within each environment. Regression coefficients were used to estimate environmental responsiveness, while the standard deviation of residuals represented yield stability across environments.
For each of the analysis options, the genotypes were ranked: for GGE-biplot, Euclidean distance from this ideal genotype (Yan et al, 2007), for Finlay-Wilkinson (1963), accessions with a regression coefficient close to unity, low deviation from regression and high average yield (more than mean yield of all accessions on this research, 286.2g/m2). The final ranking of genotypes was carried out according to the average rank of all options and allowed a better characterization of the studied genotypes according to their response to environmental conditions.
A detailed characterization of the most promising genotypes – adapted regionally or broadly – is presented in Table 4.
Table 4. Characteristics of the most perspective genotypes of chickpea.
|
Genotype |
Traits |
Yield, g/m2 |
Yield (Mean) |
Plasticity (Regression coefficient) |
Stability (SD residuals) |
|||
|
Optimal |
Extremum |
|||||||
|
Elitne |
Ustymivka |
Bokhonyky (humidity) |
Khlibodarske (drought) |
|||||
|
2068 |
Adaptability, drought resistance |
387.7 |
650.0 |
32.6 |
73.8 |
362.8 |
1.22 |
132.15 |
|
2080 |
Adaptability, drought resistance |
477.8 |
533.3 |
56.3 |
87.8 |
329.0 |
1.27 |
48.25 |
|
2085 |
Adaptability, drought resistance |
476.9 |
590.0 |
2.8 |
77.5 |
364.6 |
1.42 |
75.84 |
|
2072 |
Hyper-humidity, stability |
401.9 |
- |
228.9 |
97.5 |
284.3 |
0.65 |
7.63 |
|
2087 |
Adaptability, drought resistance |
472.4 |
590.0 |
0.0 |
68.3 |
406.9 |
1.35 |
86.60 |
|
2088 |
Adaptability, drought resistance |
455.7 |
498.3 |
0.0 |
92.1 |
369.3 |
1.14 |
87.50 |
|
2076 |
Adaptability, plasticity |
457.1 |
526.7 |
5.1 |
76.9 |
337.6 |
1.28 |
92.57 |
|
2083 |
Adaptability, drought resistance |
494.7 |
535.3 |
17.8 |
74.7 |
321.8 |
1.46 |
52.31 |
|
2084 |
Stress tolerance, plasticity |
447.9 |
454.0 |
68.6 |
77.6 |
298.9 |
1.12 |
73.17 |
|
2078 |
Adaptability, hyper-humidity |
382.8 |
436.7 |
100.7 |
54.9 |
281.6 |
1.01 |
93.27 |
|
2067 |
Hyper-humidity |
406.9 |
385.7 |
169.4 |
86.7 |
297.3 |
0.76 |
84.42 |
|
2065 |
Hyper-humidity |
375.5 |
216.7 |
205.1 |
84.8 |
247.7 |
0.40 |
98.48 |
|
2069 |
Drought resistance |
364.4 |
288.3 |
129.3 |
121.0 |
246.7 |
0.63 |
60.80 |
|
2075 |
High yield |
440.7 |
448.3 |
0.0 |
93.7 |
345.1 |
1.22 |
117.51 |
Discussion
The cultivation of chickpea in Ukraine is traditionally concentrated in the southern steppe regions and remains limited in the central and northern parts of the country. Introducing chickpea into crop rotations in non-traditional areas, such as the Western Forest-Steppe, represents a promising strategy for mitigating the impacts of climate change (Chernik & Tryhuba, 2023). The primary breeding centre for chickpea in Ukraine, PBGI in Odesa, has developed several drought-tolerant varieties, though these remain susceptible to diseases uncommon in their region of origin (Bushulian et al, 2018). The Forest-Steppe – a promising expansion zone for chickpea production – experiences both drought episodes and periods of excessive rainfall, combined with wide temperature fluctuations. These factors promote the development of fungal diseases, particularly Ascochyta blight, resulting in considerable yield losses. Therefore, new chickpea varieties must combine resistance to complex stress: drought, hyper-humidity and disease. Initial trials in the Right-Bank Forest-Steppe demonstrated that chickpea cultivation can be successful in favourable years, with yields comparable to those in the traditional southern cultivation zone (Bushulian et al, 2018; Makarchuk, 2021).
A 3-year programme of ecological testing across contrasting climatic zones enabled a comprehensive assessment of yield adaptability in selected chickpea breeding lines. Despite being located along similar latitudes, the three main testing sites – Elitne, Ustymivka and Bokhonyky – differed sharply in weather patterns. Waterlogging emerged as a critical stress factor, capable of inducing disease and prolonging the growing season through repeated vegetative growth. Because chickpea is an indeterminate species, excessive moisture may cause the abortion of pods and seeds, leading to partial or complete crop failure (Worku, 2016). According to Worku (2016), Kabuli-type chickpeas – represented among the genotypes in our study – are particularly sensitive to waterlogging.
Given the substantial yield losses associated with waterlogging, Dron et al (2022) emphasize developing new adapted varieties as the most effective mitigation strategy. Our multivariate analysis confirmed a consistent, negative response to adverse weather conditions across all yield-related traits. Since seed yield per unit area is of primary importance in production, this parameter was used to select the most adapted genotypes through GGE-biplot analysis.
The results showed that although the mean yield parameters in Elitne and Ustymivka were similar, yield variability in Ustymivka was considerably greater. This suggests a uniform yield response in the region of origin, but distinct mechanisms of environmental adaptation.
Across the different designs of assessing the adaptability of chickpea genotypes, GGE-biplot analysis showed that the first two principal components explained 64.92%–94% of the total variation, with PC1, which reflected the average yield of the genotype in all environments, accounting for 40.59%–84.3% and PC2, which described its variability in these environments, accounting for 9.7%–33.22%. These results align with previous findings (Farshadfar et al, 2013). This makes it possible to deeply and comprehensively characterize the studied genetic material on the adaptability of chickpea accessions to different growing conditions. Although chickpea is recognized as a drought-tolerant crop, terminal drought remins a major abiotic factor reducing yield. Climate change has shifted periods of extreme heat and drought beyond the southern regions into the Forest-Steppe (Elitne and Ustymivka). To broaden the assessment of adaptability, an extremely arid site – Khlibodarske (2020) – was added. A combined model using ten environments (three years across three sites, plus the ultra-arid site) highlighted the importance of both PC1 (40,59%) and PC2 (24,32%), supporting the use of such models for pattern extraction and noise reduction (Farshadfar et al, 2013).
To differentiate genotypes based on adaptability, we employed an ideal genotype comparison model like other authors (Yan & Rajcan, 2002; Yan & Tinker, 2006; Segherloo et al, 2010). The ideal genotype is conceptualized as having both high mean yield and high stability. Although no real genotype fully meets this criterion, it serves as a reference point. Each variant of the analysis provided information on the adaptability of the genotypes to environmental conditions, and the average rank allowed the characterization of the accessions according to the range of adaptability and stability. The first ten genotypes were characterized as highly adaptive (Table 4). Also, accessions with specific characteristics were distinguished, such as resistance to waterlogging (2065) or drought (2069). Analysis using the regression coefficient according to Finley-Wilkinson (1963) demonstrated the ability of the genotypes to respond to environmental challenges and added information on stability and plasticity. Three-year testing across three locations revealed notable shifts in weather conditions and demonstrated the urgent need for new chickpea varieties. This was evident from the poor performance of established standard accessions, which were located far from the ideal genotype in Elitne and Ustymivka. However, under waterlogged conditions in Bokhonyky, both standards (Rozanna and Krasnokutskyi 123) performed near the ideal genotype.
Genotypes 2080 and 2085, among the five top-performing genotypes, have Krasnokutskyi 123 in their crossing combination, a variety that shows stable but moderate yields in the south; however, in the Forest-Steppe it performs with both higher stability and productivity (Bushulian et al, 2018). Genotypes 2087 and 2090, which were evaluated as highly adaptive to Ustymivka and Elitne conditions, originate from the hybrid combination Luhanets/Antey; both parents are productive but unstable and susceptible to Ascochyta. Antey is known for low yield stability and susceptibility to stress in its region of origin, Odesa (Bushulian et al, 2018).
Studies conducted by local scientists have emphasized the need to develop new, adapted varieties, which prompted the choice of this region for ecological testing of our chickpea lines (Gan et al, 2009; Zaparniuk & Sherepitko, 2011; Zaparniuk & Sherepitko, 2012). Genotypes selected as adaptive for Bokhonyky are really important for the region and represent potential sources of waterlogging tolerance. Accessions 2085, 2083, and 2087 were developed using donor material previously recommended for combining valuable traits (Vus et al, 2020).
Genotype 2068, which had the highest average adaptability rank, was registered with catalogue number UD0502245 at NCPGRU as a source of complex valuable traits under Certificates No. 2519 issued on 28 March 2024 (Sylenko et al, 2024a). Genotype 2087 was officially registered at NCPGRU as an adaptability source (Certificate N2612, accession name CIR 289-18, UD0502261; Vus, 2024). Genotypes 2075 (UD0502251) and 2088 (UD0502262) were registered at NCPGRU as sources of complex valuable traits under Certificates No. 2520 and 2521, issued on 28 March 2024 (Sylenko et al, 2024b and 2024c).
Conclusions
The present study provides an ecological evaluation of chickpea genetic resources under novel and contrasting environmental conditions relevant to ongoing climate change. Adaptability and stability of accessions were assessed in the Ukrainian Forest-Steppe, as well as under extreme moisture regimes, including extra-arid and hyper-humid environments. The evaluation revealed substantial variation in adaptive responses among genotypes and enabled the identification of accessions with stable performance across environments, including newly determined genetic resources with potential tolerance to waterlogging.
Overall, the results expand the characterization of chickpea germplasm by documenting adaptive traits expressed under non-standard and climatically challenging conditions. The generated data contribute to a better understanding of the adaptive capacity of chickpea genetic resources and provide a valuable reference for their informed use in future research and breeding activities aimed at developing climate-resilient cropping systems.
Supplemental Table 1. Climatic and weather characteristics of the study locations
Author contributions
Nadiia Vus: conceptualization, data curation, formal analysis, investigation, methodology, resources, software, supervision, validation, writing – original draft, writing – review & editing. Olha Bezuhla: Conceptualization, data curation, formal analysis, funding acquisition, investigation, methodology, resources, supervision, validation, writing – original draft, writing – review & editing. Serhii Sylenko: data curation, investigation, methodology, project administration, resources, software, validation, writing – original draft, Writing – review & editing. Antonina Vasylenko: conceptualization, formal analysis, investigation, methodology, validation, writing – original draft, writing – review & editing. Viacheslav Sichkar: data curation. writing – original draft, writing – review & editing. Mykola Kondratenko: data curation, formal analysis, investigation, methodology, resources, validation, writing – original draft, writing – review & editing. Margarita Barylko: data curation. writing – original draft, writing – review & editing
Conflict of interest statement
The authors have declared that no competing interests exist.
References
Berrada, A.F., Shivakumar, B.G., Yaduraju, N.T. (2007). Chickpea in cropping systems. In: Yadav S.S., Redden R.J., Chen W. & Sharma B., eds. Chickpea Breeding and Management. Pondicherry, India: CAB. International, 193-212.
Bushulian, O.V., Stelmach, A.F., Lamari, N.P., Fait, V.I. (2018). Genotype reaction and stability of crop production of chickpea (Cicer arietinum L.) in years of testing. Factors of Experimental Evolution of Organisms, 23, 35-39. (In Ukrainian).
Chernik, I. V., Tryhuba, O. V. (2023). Common chickpea (Cicer arietinum L.) – a prospective legume culture of the Western Forest Steppe of Ukraine. Scient. not. Ternop. national. pedagogical. un. Ser. Biol (Nauk. Zap. Ternop. nat. ped. univ. Ser. Biol.), 83(3–4), 118-126. (In Ukrainian).
Dron, N., Simpfendorfer, S., Sutton, T., Pengilley, G., Hobson, K. (2022). Cause of Death: Phytophthora or Flood? Effects of Waterlogging on Phytophthora medicaginis and Resistance of Chickpea (Cicer arietinum). Agronomy, 12(1), 89. https://doi.org/10.3390/agronomy12010089
FAOSTAT (2023). https://www.fao.org/faostat/en/#data/QCL [Accessed 07 mai 2025].
Farshadfar, E., Rashidi, M., Jowkar, M., Zali, H. (2013). GGE Biplot analysis of genotype × environment interaction in chickpea genotypes. Europ. J.l of Exp. Biol., 3, 417–423.
Finlay, K.W., Wilkinson, G.N. (1963). The Analysis of Adaptation in a Plant-Breeding Programme. Australian Journal of Agricultural Research, 14 (6). CSIRO PUBLISHING: 742. https://doi.org/10.1071/AR9630742
Fritsche-Neto, R., Resende, R. T., Olivoto, T., Garcia-Abadillo, J., Nascimento, M., Bahia, M. A. M., Jarquin, D., & Vieira, R. A. (2025). Prediction-based breeding: Modern tools to optimize and reshape programs. Crop Science, 65, e70175. https://doi.org/10.1002/csc2.70175
Gan, Y., Zentner, R. P., McDonald, C. L., Warkentin, T., Vandenberg, A. (2009). Adaptability of chickpea in northern high latitude areas—Maturity responses. Agric. For. Meteor., 149, 711-720. https://doi.org/10.1016/j.agrformet.2008.10.026
Gaur, P.M., Gowda, C.L.L., Knights, E.J., Warkentin, T., Açikgoz, N., Yadav, S. S., Kumar, J. (2007). Breeding achievements. In: Yadav, S.S., Redden, R.J., Chen, W., Sharma, B., eds. Chickpea Breeding and Management. Pondicherry, India: CAB. International, 391-416.
Genesys-PGR. International Plant Genetic Resources for Food and Agriculture (PGRFA) information platform. https://www.genesys-pgr.org [Accessed 26.11.2025].
Henry, L., Wickham, H. (2023). rlang: Functions for Base Types and Core R and 'Tidyverse' Features. R package version 1.1.1. https://CRAN.R-project.org/package=rlang
Hijmans, R. (2025). terra: Spatial Data Analysis. R package version 1.8-60. https://CRAN.R-project.org/package=terra
Hristov, J., Toreti, A., Pérez Domínguez, I., Dentener, F., Fellmann, T., Elleby, C., Ceglar, A., Fumagalli, D., Niemeyer, S., Cerrani, I., Panarello, L., Bratu, M. (2020). Analysis of climate change impacts on EU agriculture by 2050: JRC PESETA IV project: Task 3. Publications Office https://publications.jrc.ec.europa.eu/repository/handle/JRC119632
Khan, M. N., Wahab, S., Wahid, N., Shah, S. N., Ullah, B., Kaplan, A., Razzaq, A., Bibi, M., Suleman, F., Ali, B. (2024). Chapter 4 - Impact of climate change on yield and quality of legumes. In: Fahad S., Adnan M., Munir I., Lal R., Nawaz T. & Shah S., eds. Challenges and Solutions of Climate Impact on Agriculture. Academic Press, 85-111. https://doi.org/10.1016/B978-0-443-23707-2.00004-0
Kobyzeva, L. N., Bezugla, O. M., Silenko, S. I., Kolotilov, V. V., Sokol, T. V., Dokukina, K. I., Vasylenko, A. O., Bezugliy, I. M., Vus, N. (2016). Methodical recommendations for the study of genetic resources of leguminous crops. Kharkiv: NAAS, Plant Production Institute V. Ya. Yuryev. (In Ukrainian).
Lampkin, N.H., Pearce, B.D., Leake, A.R., Creissen, H., Gerrard, C.L., Girling, R., Lloyd, S., Padel, S., Smith, J., Smith, L.G., Vieweger, A., Wolfe, M.S. (2015). The role of agroecology in sustainable intensification. Report for the Land Use Policy Group. Organic Research Centre, Elm Farm and Game & Wildlife Conservation Trust. 163 p
Makarchuk, M. A. (2021). The economically and valuable feature of selection number of chickpea (Cicer arietinum L.) in the condition of the Right-Bank Forest-Steppe. Journal of Uman NUH, 98(1), 210-219. https://doi.org/10.31395/2415-8240-2021-98-1-210-219
Mohammadi, S., Rydgren, K., Bakkestuen, V., Gellespie, M.A. (2023). Impacts of recent climate change on crop yield can depend on local conditions in climatically diverse regions of Norway. Scientific Reports, 13, 3633. https://doi.org/10.1038/s41598-023-30813-7
Olivoto, T. (2023). Analyzing multienvironment trials using GGE. https://tiagoolivoto.github.io/metan/articles/vignettes_gge.html
Olivoto, T., Lúcio, A. D. (2020). metan: an R package for multi-environment trial analysis. Meth. in Ecol. and Evol., 11, 783–789. https://doi.org/10.1111/2041-210X.13384
Pedersen, T. (2024). patchwork: The Composer of Plots. R package version 1.3.0. https://CRAN.R-project.org/package=patchwork
Pixley, K. V., Cairns, J. E., Lopez-Ridaura, S., Ojiewo, C. O., Dawud, M. A., Drabo, I., Mindaye, T., Nebie, B., Asea, G., Das, B., Daudi, H., Desmae, H., Batieno, B. J., Boukar, O., Mukankusi, C.T.M., Nkalubo, S.T., Hearne, S. J., Dhugga, K. S., Gandhi, H., Snapp, S., Zepeda-Villarreal, E. A. (2023). Redesigning crop varieties to win the race between climate change and food security. Molecular Plant, 16(10), 1590-1611. https://doi.org/10.1016/j.molp.2023.09.003.
Rakshit, S., Ganapathy, K.N., Gomashe, S.S., Rathore, A., Ghorade, R., Kumar, N., Ganesmurthy, K., Jain, Sk., Kamatar, M., Sachan, J., Ambekar, S., Ranwa, B., Kanawade, D., Balusamy, M., Kadam, D., Sarkar, A., Tonapi, V., Patil, J. (2012). GGE biplot analysis to evaluate genotype, environment and their interactions in sorghum multi-location data. Euphytica, 185, 465–479 https://doi.org/10.1007/s10681-012-0648-6
Rani Das, R., Laporte, M.-A., Valette, L., Hazekamp, T., Arnaud, E., Rathore, A. (2024). Planteome/CO_338-chickpea-traits: CO_338-chickpea-traits ontology (V1.0) [Data set]. Zenodo. https://doi.org/10.5281/zenodo.11471775 / https://cropontology.org/term/CO_338:ROOT.
Raza, A., Razzaq, A., Mehmood, S.S., Zou, X., Zhang, X., Lv, Y., Xu, J. (2019). Impact of climate change on crops adaptation and strategies to tackle its outcome: A Review. Plants (Basel), 8(2), 34. https://doi.org/10.3390/plants8020034
R Core Team (2023). R: A Language and Environment for Statistical Computing. R Foundation for Statistical Computing, Vienna, Austria. https://www.R-project.org/
Rebollo, I., Aguilar, I., Pérez de Vida, F., Molina, F., Gutiérrez, L., & Rosas, J. E. (2023). Genotype by environment interaction characterization and its modeling with random regression to climatic variables in two rice breeding populations. Crop Science, 63, 2220–2240. https://doi.org/10.1002/csc2.21029
Segherloo, A. E., Sabaghpour, S. H., Dehghani, H., Kamrani, M. (2010). Screening of superior chickpea genotypes for various environments of Iran using genotype plus genotype × environment (GGE) biplot analysis. J. of Plant Breed. and Crop Sci., 2(9), 286–292. https://doi.org/10.5897/JPBCS.9000115
Schauberger, P., Walker, A. (2022). openxlsx: Read, Write and Edit xlsx Files_. R package version 4.2.5.1. https://CRAN.R-project.org/package=openxlsx
Sloat, L.L., Davis, S.J., Gerber, J.S., Moore, F. C., Ray, D. K., West, P. C., Mueller, N. D. (2020). Climate adaptation by crop migration. Nature Communication, 11, 1243. https://doi.org/10.1038/s41467-020-15076-4
Slowikowski, K. (2024). ggrepel: Automatically Position Non-Overlapping Text Labels with 'ggplot2'. R package version 0.9.6. https://CRAN.R-project.org/package=ggrepel.
Sylenko, S., Vus, N., Andrushchenko, O., Bezugla, O., Kobyzeva, L. (2024a). Certificate No. 2519 of registration of accession of plant gene pool. Cicer arietinum. L 261-18, UD0502245. Chickpea. Application No. 0050096. 23.03.2023. Authors: Sylenko S., Vus N., Andrushchenko O., Bezugla O., Kobyzeva L. Kharkiv, Ukraine. National Center of Plant Genetic Resources of Ukraine (in Ukrainian).
Sylenko, S., Vus, N., Andrushchenko, O., Bezugla O., Kobyzeva L. (2024b). Certificate No. 2520 of registration of accession of plant gene pool. Cicer arietinum. L 272-18, UD0502251. Chickpea. Application No. 0050097. 23.03.2023. Authors: Sylenko S., Vus N., Andrushchenko O., Bezugla O., Kobyzeva L. 28.03.2024. Kharkiv, Ukraine. National Center of Plant Genetic Resources of Ukraine (in Ukrainian).
Sylenko, S., Vus, N., Andrushchenko, O., Bezugla, O., Kobyzeva, L. (2024c). Certificate No. 2521 of registration of accession of plant gene pool. Cicer arietinum. L 290-18, UD0502262. Chickpea. Application No. 0050098. 23.03.2023. Authors: Sylenko S., Vus N., Andrushchenko O., Bezugla O., Kobyzeva L. 28.03.2024. Kharkiv, Ukraine. National Center of Plant Genetic Resources of Ukraine (in Ukrainian).
The Plant Breeding and Genetics Institute – National Center of Seed and Cultivar Investigation, 2024. Official page. https://sgi.in.ua/ [Accessed 07 May 2025].
Vaissie, P., Monge, A., Husson, F. (2023). Factoshiny: Perform Factorial Analysis from 'FactoMineR' with a Shiny Application. R package version 2.5. https://CRAN.R-project.org/package=Factoshiny
Varshney, R. K., Roorkiwal, M., Sun, S., Bajaj, P., Chitikineni, A., Thudi, M., Singh, N. P., Du, X., Upadhyaya, H. D., Khan, A. W., Wang, Y., Garg, V., Fan, G., Cowling, W. A., Crossa, J., Gentzbittel, L., Voss-Fels, K. P., Valluri, V. K., Sinha, P., Singh, V. K., Liu, X. (2021). A chickpea genetic variation map based on the sequencing of 3,366 genomes. Nature, 599(7886), 622–627. https://doi.org/10.1038/s41586-021-04066-1
Vus, N., Kobyzeva, L. N., Bezuglaya, O. N. (2020). Determination of the breeding value of collection chickpea (Cicer arietinum L.) accessions by cluster analysis. Vavilov J. of Genetics and Breed., 24(3), 244–251. https://doi.org/10.18699/VJ20.617
Vus, N. (2024). Certificate No. 2612 of registration of accession of plant gene pool. Cicer arietinum L. CIR 289-18, UD0502261. Chickpea. Application No. 0053000. 29.10.2024. Author: Vus N. Collectors: Sylenko S., Sichkar V, Bezugla O. 25.11.2024. Kharkiv, Ukraine. National Center of Plant Genetic Resources of Ukraine.
Watson, C. A., Reckling, M., Preissel, S., Bachinger, J., Bergkvist, G., Kuhlman,T., Lindström, K., Nemecek, T., Topp, C. F.E., Vanhatalo, A., Zander, P., Murphy-Bokern, D., Stoddard, F. L. (2017). Chapter 4. - Grain Legume Production and Use in European Agricultural Systems. In: Sparks D. L., eds. Advances in Agronomy. Academic Press, 144, 235-303. https://doi.org/10.1016/bs.agron.2017.03.003
von Wettberg, E. J. B., Chang, P. L., Başdemir, F., Carrasquila-Garcia, N., Korbu, L. B., Moenga, S. M., Bedada, G., Greenlon, A., Moriuchi, K. S., Singh, V., Cordeiro, M. A., Noujdina, N. V., Dinegde, K. N., Shah Sani, S. G. A., Getahun, T., Vance, L., Bergmann, E., Lindsay, D., Mamo, B. E., Warschefsky, E. J., Dacosta-Calheiros, E., Marques, E., Yilmaz, M. A., Cakmak, A., Rose, J., Migneault, A., Krieg, C. P., Saylak, S., Temel, H., Friesen, M. L., Siler, E., Akhmetov, Z., Ozcelik, H., Kholova, J., Can, C., Gaur, P., Yildirim, M., Sharma, H., Vadez, V., Tesfaye, K., Woldemedhin, A.F., Tar'an, B., Aydogan, A., Bukun, B., Penmetsa, R. V., Berger, J., Kahraman, A., Nuzhdin, S. V., Cook, D. R. (2018). Ecology and genomics of an important crop wild relative as a prelude to agricultural innovation. Nat. communic., 9(1), 649. https://doi.org/10.1038/s41467-018-02867-z
Wickham, H. (2016). ggplot2: Elegant Graphics for Data Analysis. New York: Springer-Verlag.
Worku, W. (2016). Waterlogging effects on growth, nodulation and productivity of Desi and Kabuli chickpea (Cicer arietinum L.). Ethiopian Journal of Biological Sciences, 15(1), 55–77.
Yan, W., Kang, M. S., Ma, B., Woods, S., Cornelius, P. L. (2007). "GGE Biplot vs. AMMI Analysis of Genotype-by-Environment Data". Crop Science, 47 (2): 641–53. https://doi.org/10.2135/cropsci2006.06.0374
Yan, W., Tinker, N. A. (2006). Biplot analysis of multi-environment trial data: Principles and applications. Can. Journ. Plant Sci., 86(3), 623–645. https://doi.org/10.4141/P05-169
Yan, W., Rajcan, I. (2002). Biplot analysis of test sites and trait relations of soybean in Ontario. Crop Sci., 42(1), 11–20. https://doi.org/10.2135/cropsci2002.1100
Zaparniuk, O.F., Sherepitko, V.V. (2011). Genotypic differences in the manifestation of morphobiological signs of chickpea plants (Cicer arietinum. L.). Collection of scientific works of Vinnytsia National Agrarian University (Zbirnyk naukovykh prats’ Vinnyts’koho natsional’noho ahrarnoho universytetu), 7(47), 79-83. (In Ukrainian).
Zaparniuk, O.F., Sherepitko, V.V. (2012). Manifestation of economically valuable traits of chickpea plants (Cicer arietinum L.) under soil and climatic conditions of the Podolsk region. Collection of scientific papers of the Institute of Bioenergy Crops and Sugar Beet (Zbirnyk naukovykh prats’ Instytutu bioenerhetychnykh kul’tur i tsukrovykh buryakiv), 14, 430-434. (In Ukrainian).