Genomic selection accelerates sustainable long-term genetic gain in Eritrean indigenous Barentu chicken: A MoBPS simulation study
Hortuma Asefaw Habteslasiea,b,*, Kiplangat Ngenoc
a Agricultural Extension Department (AED), Ministry of Agriculture for the state of Eritrea, Asmara, Eritrea
b Department of Animal Science, Egerton University, PO BOX 536 Egerton, Kenya
c Department of Agriculture, Animal Science & Natural Resources, Moi university, PO BOX 3900 Eldoret, Kenya
* Corresponding author: Kiplangat Ngeno
(aarapngeno@gmail.com)
Abstract: Indigenous chickens dominate Eritrea’s flock but have low productivity, necessitating genetic improvement. This study evaluated the long-term potential of traditional and genomic selection for developing a specialized egg-laying Barentu indigenous chicken ecotype. A stochastic simulation was conducted using Modular Breeding Program Simulator over 20 generations of a closed nucleus breeding programme. Selection was based on a breeding objective combining age at first egg, egg number at 12 weeks and residual feed intake into a total merit index. Seven selection scenarios were evaluated according to the selection method and the proportion of female candidates genotyped. The scenarios were compared based on cumulative genetic gain, accuracy of estimated breeding values, rate of inbreeding and efficiency of genetic gain relative to inbreeding. Genomic selection consistently produced greater genetic improvement than traditional pedigree-based selection, with genetic gain increasing by 29% in males and 26% in females. The highest accuracy of estimated breeding values was achieved when all selection candidates were genotyped, while accuracy was lowest under traditional pedigree-based selection and when only 25% of females were genotyped. Traditional selection resulted in the lowest rate of inbreeding, whereas genotyping only 25% of females produced the highest inbreeding. Genomic selection achieved the greatest genetic gain relative to inbreeding, exceeding traditional selection by 19–23%. Single-step genomic selection achieved up to 90% of the genetic gain obtained through genomic selection. In conclusion, genomic selection, particularly single-step genomic selection, offers considerable potential to accelerate genetic improvement and support the conservation of genetic diversity.
Keywords: Indigenous chickens, Barentu egg-laying ecotype, Genomic selection, Pedigree-based BLUP, Single-step genomic BLUP
Introduction
In Eritrea, indigenous chickens (IC) constitute approximately 95% of the national poultry population and play a vital role in bolstering socio-economic resilience across both rural and urban backyard systems (Kozlov & Ghebrehiwot, 2020; FAOSTAT, 2023). Backyard poultry production, predominantly based on IC ecotypes, is especially prevalent among marginalized women in female-headed households, which represent 47% of all national households (Rena, 2008; Habteslasie & Araya, 2018; Naik et al, 2023). ICs provide a reliable income source because of their low input requirements, scavenging ability, self-propagation, and adaptation to tropical climates (Khaitsa et al, 2022; Birhanu et al, 2023).
East Africa, where Eritrea is located, has among the highest malnutrition rates (Akombi et al, 2017). Smallholder farms, which produce two-thirds of the country’s food, rely on IC that thrive on minimal inputs (Habteslasie & Araya, 2018; Elder et al, 2021; Pius et al, 2021). The demand for IC eggs is rising (Mujyambere et al, 2022); however, productivity is limited, highlighting the need for targeted genetic improvement (FAO, 2019). Early efforts to enhance IC productivity through crossbreeding with exotic breeds had several drawbacks: genotype–environment incompatibilities; potential erosion of indigenous genetic resources; and higher production costs for smallholder farmers (Miyumo et al, 2024). Moreover, global efforts to conserve indigenous genetic resources have increasingly constrained crossbreeding programmes (Barłowska et al, 2025).
Eritrea’s diverse IC genetic resources reflect its historical legacy and strategic location along Red Sea trade routes (Weldetsion, 2023). Over time, Eritrea’s varied agroclimatic zones fostered genetic differentiation among IC ecotypes, resulting in distinct morphological and production traits (Ghebrezgabher & Yang, 2018; Habteslasie, 2018; Adomako et al, 2024; Habteslasie et al, 2026). This extensive variability in morphological, production and genetic characteristics among IC (Pius et al, 2021; Kpomasse et al, 2023) signals substantial potential for improvement through selective breeding (Esatu et al, 2022). Empirical studies confirm that IC can be enhanced by selecting for market-driven traits (Ndung’u, 2021), with positive genetic and economic returns predicted for various IC production systems (Okeno et al, 2013). Accordingly, breeding programmes targeting IC populations have been launched in several developing countries, including Malawi (Gondwe, 2004), Ethiopia (Esatu et al, 2022), Bangladesh (Faruque et al, 2017) and Kenya (Miyumo et al, 2024).
Most IC producers favour a dual-purpose breed capable of both surviving and reproducing under low-input conditions, while delivering moderate meat and egg output (Biazen, 2021). Nonetheless, from the standpoint of commercial marketers, productivity levels in dual-purpose IC maintained under scavenging systems are often insufficient for achieving anticipated net profits (Miyumo et al, 2024). Moreover, surging consumer demand for IC eggs suggests that current dual-purpose IC productivity may fall short of future market requirements (Okeno et al, 2013). To address these challenges, alternative breeding goals targeting the development of layer strain within the IC population must be considered (Miyumo et al, 2024). In this context, the present study focuses on developing an egg-production line based on the Barentu IC ecotype (locally known as Derho Kunama or DK), which originates from Eritrea’s Gash-Barka region. Although comprehensive population studies are lacking, current analyses of the DK ecotype reveal notable morphological and genetic diversity (Habteslasie et al, 2026). Among 16 ecotypes evaluated, DK exhibited the highest annual egg production, averaging 53.07 eggs across 4.22 clutches, despite having the smallest mean egg weight (35.85g) (Habteslasie et al, 2026). On-farm assessments indicate mature DK cocks average 1.31kg, whereas hens average 0.88kg. Within the Gash-Barka region, DK is valued for disease resistance, minimal feed requirements for egg production, and adeptness at avoiding predators (Habteslasie, 2018; Habteslasie & Araya, 2018; Habteslasie et al, 2019; Habteslasie et al, 2026).
Selecting solely for production traits maximizes genetic gain, minimizes inbreeding, shortens time to improvement and lowers the cost (Miyumo et al, 2024). According to Miyumo et al (2023), lower mature body weight in layers reduces maintenance costs, allowing greater resource allocation to egg production. However, IC systems face high feed costs and seasonal feed variability (Okeno et al, 2021), making it crucial to align productivity with available resources. Selecting for residual feed intake (RFI), largely independent of production traits, outperforms average daily feed intake (ADFI) or feed conversion ratio (FCR) (Fathi et al, 2021; Miyumo et al, 2023). Lower RFI reduces feed costs, nitrogen waste and environmental impact (Fathi et al, 2021). Negative genetic trends in RFI indicate that choosing birds consuming at or below maintenance requirements (RFI ≤ 0) improves efficiency (Fathi et al, 2021; Miyumo et al, 2023).
The primary aim of this research was to utilize simulations to assess the long-term impacts of various selection strategies (conventional versus genomic) on genetic gain and inbreeding within the DK ecotype. The study hypothesized that IC performance can be enhanced through a within-breed selection strategy. To achieve this, breeding programmes were simulated using the Modular Breeding Program Simulator (MoBPS) web-interface (Pook et al, 2021). MoBPS is based on stochastic simulation and enables the modelling of complex breeding programmes, allowing comparison of alternative trait recording strategies and selection approaches (Simianer et al, 2021). This study simulated a traditional conventional pedigree-based selection approach and multiple genomic selection scenarios, each characterized by varying proportions of genotyped individuals. These comparative analyses of selection approaches offer essential insights for designing breeding programmes that effectively balance short-term productivity and long-term sustainability (Pocrnic et al, 2023).
Materials and methods
Eritrean poultry producers demonstrated a marked preference for cocks exhibiting red plumage and hens with superior egg-laying capacity, owing to their elevated market value and sale price (Habteslasie et al, 2026). In response, this study endeavours to establish a dedicated egg-laying founder line within the DK IC population, with a predominance of red or red-brown plumage, tailored for enhanced egg output and adaptability in rural environments. The design integrated empirical insights from different studies (Esatu et al, 2022; Pocrnic et al, 2023; Büttgen et al, 2025; Habteslasie et al, 2026).
Data sources
Real genotype data for the DK IC ecotype were generated using genotyping-by-sequencing (GBS) conducted by Diversity Arrays Technology Pty Ltd (DArT™). Key biological and reproductive parameters for the nucleus breeding population including the optimal number of males and females retained per generation, mating ratios, fertility, hatchability, and mortality rates, clutch size, and progeny sex ratio were parameterized using estimates from established IC breeding programmes. These included IC populations in Eritrea (Habteslasie, 2018; Habteslasie et al, 2026), the Tilili breeding programme in Ethiopia (Esatu et al, 2022), and the NRI–KALRO IC initiative in Kenya (Ilatsia et al, 2017; Miyumo et al, 2024).
Three key traits were evaluated in the breeding objective: age at first egg (AFE), egg number within 12 weeks of onset of lay (EN12), and residual feed intake (RFI) measured over the same production period. These traits were selected to simultaneously improve reproductive efficiency, early sexual maturity, and feed utilization efficiency characteristics that are particularly important in low-input, high-mortality production environments typical of IC systems (Pius et al, 2021). Such conditions have been documented in Eritrean village production systems, where early maturity and efficient feed utilization contribute substantially to flock survival and productivity (Habteslasie, 2018; Habteslasie et al, 2026). The inclusion of EN12 as an early indicator trait for laying performance enables shorter generation intervals and improved selection response, while RFI was incorporated to enhance feed efficiency independently of production level. Together, these traits support the development of a breeding objective that balances productivity gains with practical implementation under resource-constrained conditions. This approach is consistent with modern breeding programme design principles, emphasizing efficiency, robustness and sustainability in smallholder systems (Miyumo et al, 2024).
Genetic parameters, including trait means, heritabilities, and phenotypic and genetic correlations (Table 1), were obtained from studies conducted in IC populations reported by Miyumo et al (2023, 2024). These parameter estimates were selected because they reflect production environments comparable to those targeted in the present study, thereby improving the biological relevance and applicability of the simulation outcomes.
Table 1. Observed mean, phenotypic standard deviation, heritability (diagonal), phenotypic (upper diagonal) and genetic (lower diagonal) correlation for traits considered. AFE, age at first egg (days); EN12, cumulative egg number at week 12 from onset of lay; RFI12, residual feed intake (g/d) measured 12 weeks from onset of lay; SD, standard deviation.
|
Traits |
Mean |
SD |
AFE |
EN12 |
RFI12 |
|
AFE |
168 days |
2.88 |
0.31 |
-0.2 |
-0.06 |
|
EN12 |
52 eggs |
15.6 |
-0.54 |
0.23 |
-0.12 |
|
RFI12 |
0.37g/d |
13.79 |
0.35 |
-0.44 |
0.36 |
Selection scenarios and simulation design
Seven alternative selection strategies, comprising conventional and genomic breeding approaches, were evaluated using stochastic simulation (Table 2). Simulations were implemented in MoBPS via its graphical user interface MoBPSweb (MoBPS; https://mobps.de), which interfaces directly with the R package described by Pook et al (2021). This framework enables flexible modelling of complex breeding schemes, including genomic selection strategies, population structure and operational constraints.
Conventional selection was modelled using pedigree-based estimated breeding values derived from the Best Linear Unbiased Prediction (BLUP) framework following Henderson (1975). Genomic selection strategies were implemented using both genomic BLUP (GB) and single-step genomic BLUP (SSGBLUP) approaches, which integrate pedigree, phenotypic and genomic information to improve accuracy of estimated breeding values.
The pedigree-based scenario (PED) served as the baseline control, in which no individuals were genotyped, and selection decisions were based solely on pedigree BLUP. This scenario reflects breeding strategies commonly implemented in IC improvement programmes in developing countries, where genotyping resources remain limited (Ndung’u, 2021; Esatu et al, 2022).
Six genomic selection scenarios were subsequently evaluated to assess the impact of varying genotyping intensities across sexes (Table 2). In scenarios SS25, SS50, and SS100, only females were genotyped at increasing proportions of 25%, 50%, and 100%, respectively. These scenarios were designed to explore cost-effective genomic implementation strategies, given the larger number of females typically available in poultry breeding populations. Two additional scenarios incorporated genotyping of males alongside fully genotyped females: SS100.25, in which 100% of females and the top 25% of males were genotyped, and SS100.50, in which 100% of females and the top 50% of males were genotyped. Finally, the fully genomic scenario (GB) assumed complete genotyping of both males and females, representing the upper benchmark for genomic selection accuracy. These scenarios enabled comparison of conventional and genomic selection strategies across a gradient of genotyping intensities, allowing evaluation of trade-offs between genetic gain, selection accuracy and operational feasibility under resource-constrained indigenous chicken breeding systems.
Table 2. Simulated breeding scenarios showing selection methods and proportion of genotyped males and females per generation. PED, pedigree-based BLUP; SS25, SSGBLUP with only the top 25% of females genotyped; SS50, SSGBLUP with only the top 50% of females genotyped; SS100, SSGBLUP with only 100% of females genotyped; SS100.25, SSGBLUP with 100% of females and the top 25% of males genotyped; SS100.50, SSGBLUP with 100% of females and the top 50% of males genotyped; GB, 100% genotyping of both males and females.
|
Scenario |
Selection method |
Genotyped individuals per generation |
|||
|
Male |
Female |
Male |
Female |
||
|
1 |
PED |
Pedigree |
Pedigree |
0 |
0 |
|
2 |
SS25 |
Pedigree |
SSGBLUP |
0 |
Top25% |
|
3 |
SS50 |
Pedigree |
SSGBLUP |
0 |
Top50% |
|
4 |
SS100 |
Pedigree |
SSGBLUP |
0 |
100% |
|
5 |
SS100.25 |
SSGBLUP |
SSGBLUP |
Top25% |
100% |
|
6 |
SS100.50 |
SSGBLUP |
SSGBLUP |
Top50% |
100% |
|
7 |
GB |
GB |
GB |
100% |
100% |
Generation of the founder population and traits, and trait simulation
The core breeding scheme, including population structure, founder population, genomic architecture and trait modelling, followed the framework described by Büttgen et al (2025). To construct a representative founder population, genotype data from the DK population obtained using GBS were used. From this dataset, a base population of 1,200 birds was generated through random mating among founders. To establish realistic levels of genetic relatedness and pedigree structure prior to selection, five generations of random mating were simulated following the approach described by Martin et al (2023, 2024). This burn-in phase allowed the development of a structured pedigree and linkage disequilibrium patterns representative of practical breeding populations.
Traits were simulated assuming a polygenic architecture, consistent with the approach of Büttgen et al (2025). Specifically, each trait was controlled by 1,000 additive quantitative trait loci (QTLs), randomly sampled from the available SNP markers. These SNPs were subsequently included in genomic breeding value estimation for both genomic BLUP (GBLUP) and single-step genomic BLUP (SSGBLUP) scenarios. Genetic correlations among traits were generated by allowing QTLs to influence multiple traits, with correlated genetic effects derived using Cholesky decomposition of the target genetic correlation matrix, following Büttgen et al (2025).
Trait means and genetic parameters (Table 1) were applied to the base population. Phenotypes were generated only for females, reflecting practical constraints in poultry breeding where male performance traits are often unavailable. Consequently, selection of male candidates was based on estimated breeding values derived from female relatives, including ancestral and sib performance information. To control inbreeding, mating between full- and half-sibs was prohibited across all scenarios. All females were maintained until 40 weeks of age, from hatch to the end of the recording period, to enable complete phenotypic data collection regardless of their selection status. This assumption ensured consistent trait recording and reflects operational practices in structured breeding programmes.
Furthermore, in accordance with the study of Fathi et al (2021) and Zhao et al (2022), RFI was calculated by adjusting feed intake for body weight, weight gain, and egg mass production over a 4-week period, and RFI calculation followed Miyumo et al (2023, 2024), ensuring accurate feed intake prediction and aiding selection among birds with similar RFI values. For females, RFI was calculated as:
Where: RFIi is the estimated residual feed intake for the ith bird; Yi is the average daily feed intake record of the ith hen; b0 is the fixed intercept, representing the population-mean feed intake when all predictors are zero, for k = 1, 2, 3, X1i= EMi, X2i = ADGi and X3i=MBW, denote respectively observed average daily egg mass, average daily body-weight gain, and metabolic body weight of ith bird; bk are the fixed-effect regression coefficients (k = 0, 1, 2, 3) for each predictor Xki; αki is the random regression coefficient (k = 1, 2, 3) specific to ith bird for the observed traits and assumed to have αki ~ N (0, σ2α) distribution. Metabolic body weight will be calculated based on the average between initial and final body weights raised to the power of 0.75 (BW0.75).
Breeding schemes simulation
Given resource constraints, a single-tier closed nucleus breeding structure was considered, aligning with many IC breeding programmes in African countries (Ndung’u, 2021; Esatu et al, 2022). In total, seven different scenarios were simulated. An in-depth overview of selection methods and proportion of genotyping per generation for all scenarios are given in Table 2, while the schematic overview of the breeding programme along with cohort size is indicated in Figure 1. Following Martin et al (2024), all active breeding females from the Start-plus Female (S+F) cohort (group of individuals generated via the same breeding action) at the start point of each scenario in breeding cycle 0 were genotyped to create an initial reference population for SSGBLUP and GB selection.
In all the modelled breeding programmes, 80 males and 480 females were selected from 1,075 males and 1075 female selection candidates in all scenarios (Figure 1). Selection proportions corresponded to 7.4% and 44% for males and females, respectively, which resulted in selection intensities of 1.97 and 0.89 for males and females, respectively, with an average selection intensity of 1.43. According to Miyumo et al (2024), selection intensity of 1.43 falls within the range typically used in commercial chicken breeding programmes.
The founder generated from the actual genomic data of DK IC was unrelated, and the following cohort Start Males (startM) and Start Females (startF) were randomly mated for five generations to establish initial relatedness and pedigree structure to generate the Start-plus Male (s+M) and s+F as a starting breeding population for each scenario (Figure 1).
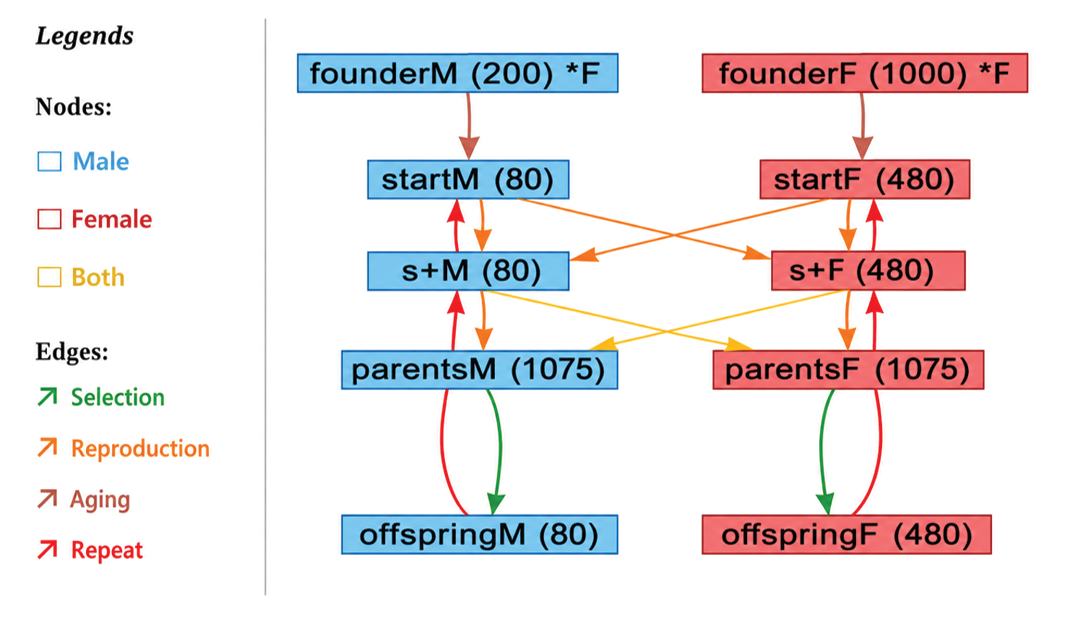
Figure 1. Schematic representation of the baseline DK IC breeding programme, generated and visualized using the MoBPSweb graphical interface (www.mobps.de; Pook et al, 2021). Numbers in parentheses denote cohort sizes. founderM, founder male; founderF, founder female; s+M, Start-plus Male (selected breeding males from founder population); s+F, Start-plus Female (selected breeding females from founder population); parentsM, male generation 0; parentsF, female generation 0; offspringM, male generation 1; offspringF= female generation 1. Blue nodes indicate male cohorts, while red nodes indicate female cohorts. Edges depict breeding actions, with edge colours corresponding to the type of action as detailed in the legend.
Statistical analysis
Ten independent replicates were conducted for each simulation scenario, with only breeding cycles 0 through 20 retained for evaluation. For each breeding cycle, individual IC candidates were ranked for selection based on a total-merit index (TMI). The weights applied to their EBVs were derived from economic values and inter-trait correlations as described by Büttgen et al (2025). The EBVs were not scaled by their reliabilities and were used directly as obtained from the respective evaluation models. Following Martin et al (2023), equal economic weights were assigned to the three focal traits, AFE, RFI12 and EN12, resulting in the following index model, adapted from Rutten et al (2002):
Where TMI is the total merit index, bAFE, bRFI12 and BEN12 are the economic weights assigned to AFE, RFI12 and EN12, respectively, and XAFE, XRFI12 and XEN12 and denote the corresponding vectors of EBVs estimated via pedigree-based and/or SNP-based methodologies.
Cumulative genetic gain (∆GG) in a cycle (c) was calculated as the proportional change in mean true breeding value (TBV) relative to cycle 0, in accordance with Müller et al (2017) and Büttgen et al (2025):
where ∆GG is the cumulative genetic gain, TBVc and TBV0 and denote the population-mean TBV in cycle c and cycle 0, respectively. A cycle (c) corresponded to one generation in the simulation, with cycle 0 defined as the founder population and subsequent cycles representing successive selection and reproduction events.
Breeding values were estimated using phenotypic and pedigree data from the two most recent generations (pedigree depth = 7), as described by Pook et al (2021) and Pook (2025). Across all scenarios, standard multivariate animal model was implemented in line with the study by Ouédraogo et al (2021), Habimana et al (2024) and Khan et al (2025), expressed as:
where: yi is vector of the trait records (AFE, RFI and EN21), Xi is incidence matrix relating fixed effects to observations, b is vector of fixed effects coefficients, Zi is incidence matrix relating random genetic effects (breeding values) to observations, a is vector of additive genetic effects (breeding values) to be estimated and ei is the vector of residuals.
Under the PED scenario, used as a baseline, the random effects were assumed to follow:
where MVN is the multivariate normal distribution, A is the additive genetic relationship matrix among individuals derived from pedigree (7-generation depth) and Ga is the additive genetic (co)variance matrix among the traits as 3 × 3 matrix while the e is vector of residual errors (random environmental effects and measurement errors) of the trait assumed
where I is identity matrix and R is residual (co)variance matrix among traits. Additive genetic (co)variance matric (Ga) was expressed as:
Residual (co)variance matrix (R)
In the GB scenario (scenario 7), all selection candidates were genotyped and realized relationship matrix G replace A, thus , and the genomic relationship matrix was computed as follows according to VanRaden (2008):
where: G is the genomic relationship matrix among individuals, M is a matrix of SNP genotypes coded as 0, 1, or 2 (0, 1 and 2 represents homozygous for the first allele, heterozygous and homozygous for the second allele respectively), m representing the number of copies of the second allele at each SNP while pi is the frequency of the second allele at marker i.
For scenario 2 to 6, in which only a subset of IC was genotyped, SSGBLUP was applied, integrating pedigree and genomic information in the combined relationship matrix:
H: ,
and its inverse is given by Yan et al (2018) as:
where: is the inverse pedigree relationship for the subset of genotyped animals, A-1 is the inverse pedigree relationship for all animals, G-1 is the inverse genomic relationship among genotyped animals.
All three evaluation strategies (PED, SSGBLUP and GB) were solved simultaneously using Henderson (1975) mixed model equations:
where: X, incidence matrix for fixed effects; (b̂), vector of estimated fixed effect coefficients; Z, links observations to random genetic effects (â); (â), vector of estimated random effects (breeding values); y, vector of all phenotypic observations; R, covariance matrix of residuals, inverse (co)variance matrix of additive genetic effects among the three traits, where M-1 is the inverse relationship matrix with A matrix for PED, G matrix for GB scenario and H (pedigree+ genomic) for SSGBLUP scenarios.
Accuracy of EBV was quantified as the Pearson correlation between TBVs and EBVs within each cycle analysed in MoBPS v1.06.62 web interface (Pook, 2025). The accuracy model applied in this study follows the approach proposed by Lee et al (2023):
where: TBV is the true breeding value, EBV is the estimated breeding value, i is individual IC in cycle c, TBVc and EBVc are the respective within-cycle mean and nc is the length of IC per cycle.
Genomic inbreeding coefficient in the MoBPS simulator was quantified according to the definition by Donnelly (1983), which describes inbreeding as the probability that the two alleles carried by an individual at an arbitrary locus are identical by descent (IBD). Cycle-specific inbreeding levels were averaged across the ten replicates per scenario following the model by Nishio et al (2023). Specifically, the inbreeding coefficient (Fi,c) of individual i in breeding cycle c was computed as:
where: Fic is the inbreeding coefficient of individual i in breeding cycle c, Ii,l is an indicator variable that takes the value 1 if the two alleles of individual i at locus l are identical by descent (IBD), and 0 otherwise and L is total number of biallelic loci.
Subsequently, the mean inbreeding coefficient for breeding cycle c (Fc) was obtained by averaging across all Nc individuals present in that cycle as follows:
where Fc is the mean inbreeding coefficient of all IC in cycle c, Nc is the number of IC in breeding cycle c.
For the purposes of direct comparison with pedigree-based or marker-based evaluation methods, the matrix-based estimate of the inbreeding coefficient () was additionally estimated from the diagonal elements of the respective relationship matrices:
Where Mii corresponds to the diagonal element for individual i from the pedigree (Aii), genomic (Gii) or single-step combined (Hii) relationship matrix, as applicable under the PED, GB and SSGBLUP scenarios, respectively.
Finally, a one-way fixed-effects ANOVA was applied to compare scenarios for cumulative genetic gain, accuracy, and the rate of inbreeding. All analyses were conducted in JMP Pro 17 (SAS Institute Inc., Cary, NC, USA). When the omnibus F test was significant at α = 0.05, post hoc pairwise differences among scenario means were assessed using Fisher’s least significant difference (LSD), implemented in JMP as Each Pair, Student’s t. The statistical model was:
where Yij represents the observed value for cumulative genetic gain, accuracy, or change in the rate of inbreeding in replicate j within scenario i; μ is the overall population mean; τi is the fixed effect of the ith scenario; and εij denotes the residual error term.
Results and discussion
Genetic gain
The genetic response across 20 generations observed in IC female and male cohorts are summarized in Figure 2, Figure 3 and Table 3, respectively. Across 20 simulated generations, genomic selection consistently outperformed conventional PED, and its advantage increased with the proportion of genotyped candidates included in SSGBLUP, corroborating the findings of Tu et al (2024) and Khan et al (2025).
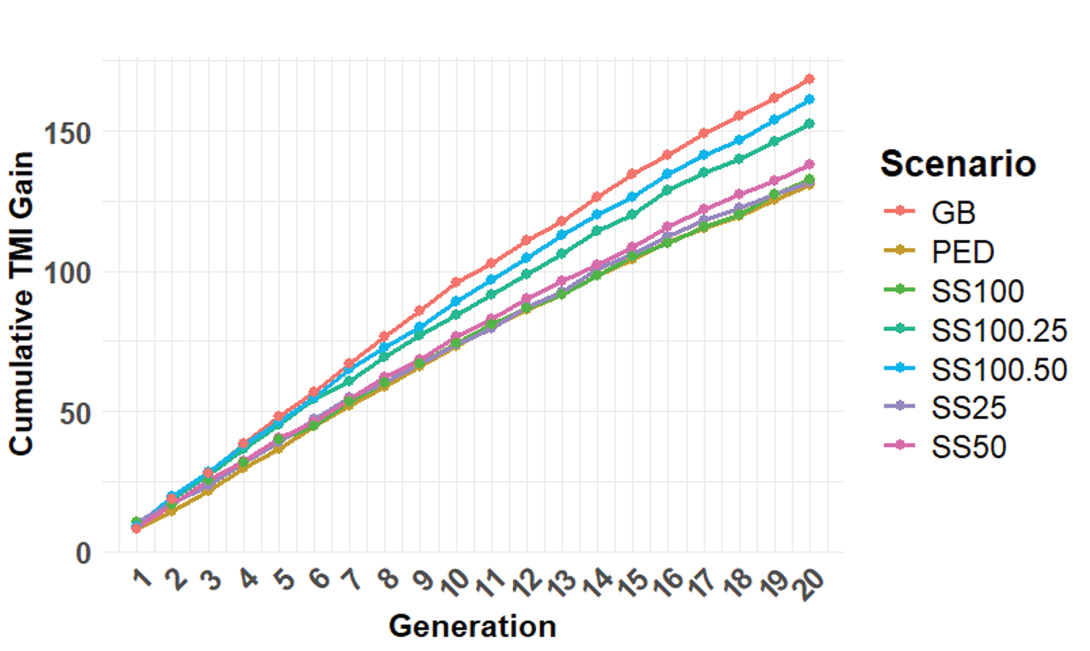
Figure 2. Accumulated genetic gain across 20 breeding cycle expressed as mean true breeding values of male cohort under multiple scenarios. TMI, total merit index; GB, genomic BLUP; PED, Pedigree BLUP; SS25, SSGBLUP 25% female only genotyped; SS50, SSGBLUP 50% female only genotyped; SS100, sSSGLUP 100% female genotyped; SS100.25, SSGBLUP 100% female and 25% male genotyped; SS100.50, SSGBLUP 100% female and 50% male genotyped.
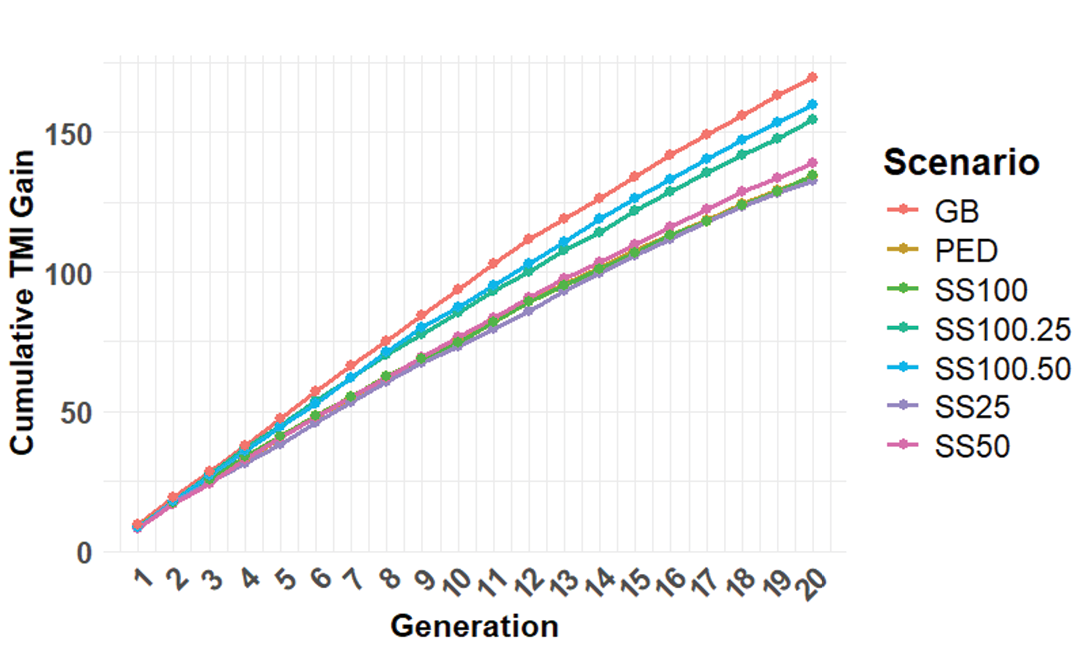
Figure 3. Accumulated genetic gain across 20 breeding cycle expressed as mean true breeding values of female cohort under multiple scenarios. Abbreviations as in Figure 2.
Table 3. Summary (mean ± SD) of index gain, accuracy, and inbreeding-level by scenario and sex across ten simulation replicates after 20 cycles. Different superscript letters within a column indicate significant differences (Fisher’s LSD, α = 0.05). Abbreviations as in Figure 2.
|
Scenario |
Index |
Accuracy |
Inbreeding |
|||
|
Female |
Male |
Female |
Male |
Female |
Male |
|
|
GB |
169.35±11.04a |
168.23±11.56a |
0.499± 0.03b |
0.287± 0.06b |
0.430± 0.03ab |
0.430± 0.02a |
|
PED |
134.05±10.38c |
130.7± 12.15c |
0.392 ± 0.05e |
0.158± 0.07c |
0.406± 0.01c |
0.409± 0.02bc |
|
SS25 |
132.74± 4.28c |
131.9± 5.68c |
0.415± 0.05d |
0.151± 0.07c |
0.44± 0.03a |
0.434± 0.02a |
|
SS50 |
138.67±11.33c |
137.95±13.02c |
0.449± 0.03c |
0.163± 0.04c |
0.412± 0.02 bc |
0.409± 0.02bc |
|
SS100 |
134.46±8.13c |
132.41±7.04c |
0.527±0.03a |
0.164±0.06c |
0.407±0.02 bc |
0.403±0.02c |
|
SS100.25 |
154.25±5.35b |
152.65±5.12b |
0.499±0.00b |
0.282±0.07b |
0.416±0.01 bc |
0.420±0.02abc |
|
SS100.50 |
159.57±11.81ab |
161.00±12.96ab |
0.506±0.03b |
0.332±0.05a |
0.419±0.02bc |
0.423±0.03 ab |
In males, the reference PED scenario (Figure 2) produced a cumulative total-merit index gain from 7.9 units in generation 1 (G1) (7.52%) to 130.7 units by G20 (124.42%), corresponding to a linear gain of 6.54 units per generation. Full genomic BLUP, in which 100% of males and females were genotyped (GB scenario), accelerated progress to 168.2 units (162.81%) by G20, an improvement of almost 29% over PED scenario and an average gain of 8.53 units per generation. Similar superiority of full-genomic scenarios has been documented by Büttgen et al (2025), Zhou et al (2025) and Ndung et al (2021). Sánchez-Mayor et al (2022) attributed this to increased reliability of genomic EBVs, a view further supported by Juiputta et al (2025), who noted that while GB excels at capturing polygenic variation, its assumption of equal SNP effects may limit accuracy for traits controlled by few major QTLs.
Partial-genotyping strategies under SSGBLUP revealed a clear gradient in response (Figure 2). Genotyping only the top 25% of females (SS25) yielded 131.9 units of cumulative gain at G20, barely 1% above PED. Doubling the proportion of genotyped females (SS50) raised terminal gain by 7.2 (+6%) units to 137.9 units, whereas full female-only genotyping (SS100) produced 132.4 units (+1%). When all females were genotyped, and the top 25% (SS100.25) or 50% (SS100.50) of males were added, cumulative gain increased to 152.6 and 161.0 units, representing 17% and 23% improvements over PED, respectively, and highlighting the value of broader genomic coverage. An analysis of variance (Table 3) confirmed a significant effect of selection strategy on the male index at generation 20 (F = 23.094, p < 0.0001). The GB scheme (168.23 ± 11.56) did not differ statistically from SS100.50 (161.0 ± 12.96) but exceeded all other SSGBLUP and PED scenarios; SS100.25 (152.65 ± 5.12) in turn surpassed SS50 (137.95 ± 13.02), SS100 (132.41 ± 7.04), SS25 (131.90 ± 5.68), and PED (130.70 ± 12.15), among which no differences were detected.
Female (Figure 3) exhibited a comparable cumulative total merit index gain pattern to males across the 20 generations. Under the PED scenario, the total-merit index rose from 9.2 units in G1 to 134.1 units in G20 (121.72% cumulative gain). GB scenario achieved 156.59% by G20, 26% higher than PED, equating to an average gain of 8.41 units per generation. ANOVA (Table 3) likewise revealed a significant effect of breeding scheme (F = 24.905, p < 0.0001). GB (169.35 ± 11.04) significantly outperformed all SSGBLUP and PED schemes except SS100.50 (159.57 ± 11.81), which did not differ statistically from GB yet exceeded SS100.25 (154.25 ± 5.35). Both intensive genomic schemes (SS100.25 and SS100.50) outperformed SS50 (138.67 ± 11.33), SS100 (134.46 ± 8.13), SS25 (132.74 ± 4.28), and PED (134.05 ± 10.38), among which differences were non-significant.
As depicted in Figure 3, only-female genotyping schemes (SS25, SS50 and SS100) paralleled the PED trajectory up to G10; thereafter, SS50 and SS100 diverged modestly, finishing approximately 6% points above PED, while SS25 remained within the conventional PED scenario. Across the 20 generations, PED cumulative gain rose steadily from 8.35% (G1) to 121.72% (G20), closely mirrored by SS25 (7.60% to 121.89%). SS50 and SS100 attained terminal gains of 127.76% and 125.73%, respectively; supplementing full female panels with 25% or 50% top-male genotypes further increased gains to 144.83% and 149.34% respectively. The GB scheme delivered the highest overall gain of 156.59%. These results align with Martin et al (2024), who reported a near-linear relationship between the proportion of genotyped candidates and realized gain. Sánchez-Mayor et al (2022) similarly observed that SSGBLUP efficacy improves with more extensive genotyping, albeit incrementally. Genomic selection thus represents a potent strategy for accelerating genetic progress, particularly for sex-limited, difficult-to-measure, or low-heritability traits (Khan et al, 2025), characteristics typifying the present investigation.
Accuracy of breeding value estimation
The mean accuracy of breeding value estimation per scenario after breeding cycle 20, averaged over ten simulated runs per cycle, is illustrated in Figure 4 for both male and female cohorts. After 20 rounds of selection, the prediction method exerted a pronounced effect on accuracy in each sex, as evidenced by highly significant one-way ANOVA (Table 3) results (females: F = 47.8, p < 0.0001; males: F = 36.3, p < 0.0001). In IC, EBV accuracy was therefore contingent on both the proportion of birds genotyped and the evaluation model applied (PED , SSGBLUP or GB) in line with previous studies (Lourenco et al, 2015; Yan et al, 2018; Gao et al, 2019; Zhang et al, 2020; Tu et al, 2024; Zhou et al, 2025).
For the females, the highest average accuracy was achieved when all females were genotyped (SS100 scenario: 0.527 ± 0.026). This was followed by the SS100.50 (0.506 ± 0.047), SS100.25 (0.500 ± 0.048), and GB (0.499 ± 0.027) scenarios, with no significant differences among these (Table 3). However, when the proportion of genotyped females was reduced to 50% (SS50 scenario), accuracy dropped significantly (Table 3) to about 0.45 ± 0.025. This level remained notably higher than in the SS25 scenario (0.41 ± 0.026), while the lowest accuracy was observed in the traditional pedigree-based PED scenario at 0.39 ± 0.028. Overall, the SSGBLUP method achieved the highest dam-side accuracy, outperforming the traditional PED by roughly 26%.
Figure 4 depicts the average accuracy of estimated breeding values across evaluated scenarios. For males, the accuracy attained its highest mean value (0.332 ± 0.046) in the SS100.50 scenario, significantly exceeding (Table 3) the accuracies observed in the GB scenario (0.287 ± 0.059) and the SS100.25 scenario (0.282 ± 0.071). The GB and SS100.25 scenarios comprised an intermediate cluster, with no statistically significant differences observed between them. Conversely, the SS100 scenario exhibited a relatively low accuracy (0.164 ± 0.055), grouping closely and without significant differences with the SS50 (0.163 ± 0.041), SS25 (0.151 ± 0.067), and PED (0.158 ± 0.065) scenarios (Table 3).
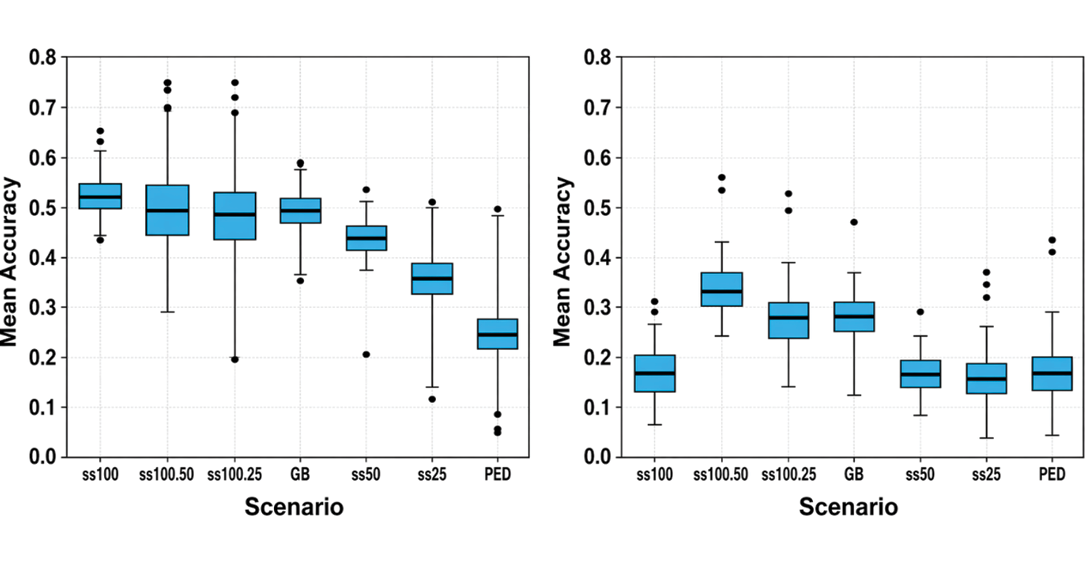
Figure 4. Mean prediction accuracy of estimated breeding values over 20 generations, shown for the female (left) and male (right) cohorts across the seven evaluated scenarios. Abbreviations as in Figure 2.
As with the female cohort, male EBV accuracy benefited from the inclusion of genomic information: under the SSGBLUP model, accuracy exceeded that of the PED model by approximately 52%. Comparing both cohorts, the accuracy in the female cohort under the SS100 scenario was notably higher (0.53) compared to the male cohort’s peak under SS100.50 (0.33), representing a deficit of about 37%. This difference is attributable to the design of the breeding scheme, which only includes phenotype measurements for the female cohort as well as the inclusion of only female cohort genotyping as reference. Lourenco et al (2015) further demonstrated that including training populations from one sex improves the genomic estimated breeding value (GEBV) accuracy for that sex in chickens, while incorporating genotypes from both sexes as training populations enhances overall accuracy. This supports the current study’s finding of higher accuracy in the female cohort.
According to Mancisidor et al (2021), genomic evaluation accuracy depends on factors such as linkage disequilibrium between markers and quantitative trait loci (QTL), effective population size, and the relationships between individuals in training and validation datasets. Additionally, reference population size, composition, training data size, and heritability are essential factors influencing accuracy (Takeda et al, 2021). The observation of increasing accuracies with an increasing proportion of genotyped individuals aligns with findings reported by Yan et al (2018), Mancisidor et al (2021), Pook et al (2021), Martin et al (2024), Büttgen et al (2025), Zhou et al (2025).
The superior accuracy achieved using SSGBLUP compared to standard GB and traditional PED methods is consistent with studies by Yan et al (2018) and Gao et al (2019). Specifically, in small populations, SSGBLUP predictions were enhanced by integrating genetic marker information alongside pedigree data, while the limitations of GB related primarily to small training set sizes (Yan et al, 2018). Tu et al (2024) reported that SSGBLUP achieved the highest prediction accuracy for egg-production traits, while GB accuracy fell below that of PED for total egg number, average laying rate, and clutch length, effects attributed to the number of genotyped animals and SNP-chip density. These authors recommend SSGBLUP as an effective tool for genomic prediction in local chicken populations when genotyping capacity is limited. However, Gao et al (2019) indicated that the predictive advantage of SSGBLUP over PED depends heavily on the number of genotyped individuals and the informativeness of genetic markers. Sánchez-Mayor et al (2022) caution that genotyping only 10% to 20% of families may lower prediction accuracy in SSGBLUP by leaving linkage unrepresented in the training set, and recommend expanding or stratifying sampling to capture broader genetic variation and improve predictions.
Inbreeding level
According to Büttgen et al (2025), evaluating breeding programme designs demands simultaneous consideration of genetic gain and the annual rate of inbreeding, in order to mitigate the risks of inbreeding depression and erosion of genetic diversity. In this study, the mean inbreeding level across 20 generations was calculated separately for male and female individual ICs under each scenario, based on ten simulation replicates per design, and the results are depicted in Figures 5 and 6.
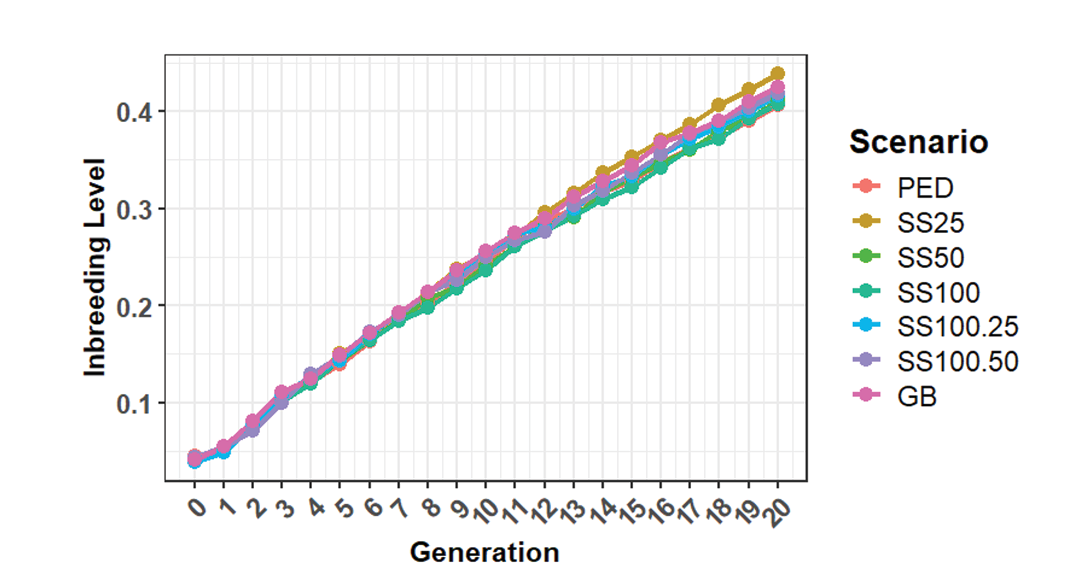
Figure 5. Inbreeding Level per generation in the female cohort across selection scenarios (PED, SS25, SS50, SS100, SS100.25, SS100.50, GB) and 20 generations (G1 to G20). Abbreviations as in Figure 2.
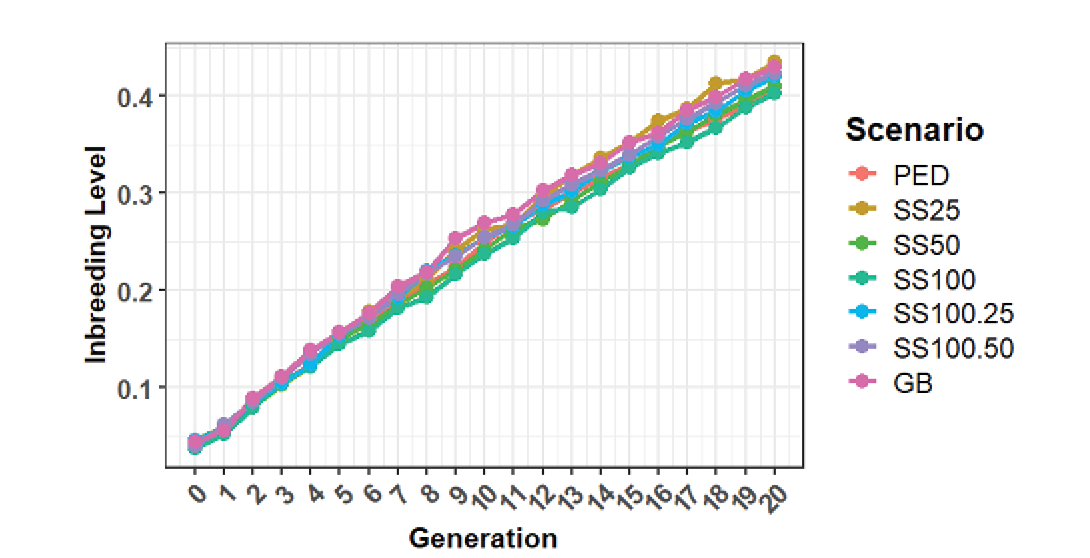
Figure 6. Inbreeding Level per generation in the male cohort across selection scenarios (PED, SS25, SS50, SS100, SS100.25, SS100.50, GB) across 20 generations (G1 to G 20). Abbreviations as in Figure 2.
In the female cohort (Figure 5), the inbreeding coefficient increased progressively across all selection scenarios through G20. Analysis of variance followed by Fisher’s least significant difference (LSD) test produced an F-ratio of 2.9094 (p = 0.0144), confirming significant differences among scenarios (Table 3). Under the pedigree-based (PED) scenario, inbreeding level rose from 4.5% at G0 to 40.5% at G20, an average per-generation gain of 1.9% and a cumulative rate increase of 37.7%. The single-step with 100% of only-females genotyped (SS100) scenario ranked second, reaching a 40.6% inbreeding level at generation 20 (38.1% cumulative rate). In contrast, the SS25 scenario exhibited the highest level, from 4.0% at G0 to 43.9% at G20, representing an 8.1% greater accumulation relative to PED and an average increment of approximately 2.0% per generation. The GB scenario followed, culminating in 42.5% inbreeding level at generation 20 (4.8% above PED). Intermediate genotyping scenarios, SS50, SS100.25 and SS100.50, attained inbreeding levels of 41.2%, 41.6%, and 41.9%, respectively, at G20; none differed significantly from the PED reference scenario (Table 3). A parallel upward trajectory was observed in the male cohort (Figure 6). Under the PED scenario, inbreeding level increased from 4.1% at G0 to 40.9% at G20, averaging a 1.9% rise per generation. The SS100 scenario recorded the lowest level at generation 20 (40.3%), followed by SS50 (40.9%). Specifically, the SS100 scenario resulted in a 1.5% lower inbreeding coefficient than PED at G20, with an average per-generation increment of 1.89% and a cumulative total rate of 37.9% over 20 generations. Conversely, both SS25 and GB scenarios exhibited the steepest increases, reaching 43.5% and 42.9% inbreeding levels at G20, respectively; the SS25 scheme showed a 6.2% elevation relative to PED, with a 2.0% average per-generation rise and a cumulative inbreeding gain of 40.9% across 20 generations. The GB, SS100.50 and SS100.25 scenarios followed, demonstrating inbreeding level increases at generation 20 of 4.8%, 3.4%, and 2.5% above PED, respectively. Statistical analysis confirmed significant differences among methods (F = 3.0534; p = 0.011).
The observed inbreeding rates in these breeding strategies substantially exceeded the recommended threshold of 0.1% per year for livestock, which is considered optimal for preserving evolutionary potential (Büttgen et al, 2025). Miyumo et al (2024) noted that incorporating feed-related traits, such as residual feed intake, alongside production traits elevates the inbreeding rate by approximately 0.04% to 0.26% compared to indices focused solely on production traits. In closed-nucleus breeding systems with low effective population sizes, as in the present study, inbreeding rates are influenced by the limited number of individuals contributing to genetic variation (Wang et al, 2016). Habimana et al (2024) demonstrated that increasing nucleus size in deterministic simulations enhances genetic gain while reducing inbreeding rates in both PED and GB methods by increasing the selection of unrelated parents and the size of the reference population. However, expanding flock size may increase the costs of nucleus programmes. Ouédraogo et al (2021) emphasized that sustainable nucleus programmes require robust infrastructure and technical inputs, with many such programmes in developing countries failing due to insufficient funding. The success of these programmes hinges on their simplicity and efficacy (Miyumo et al, 2024).
Additionally, Woolliams & Bijma (2000) found that selecting traits with low heritability in BLUP-based indices increases reliance on relatives' information, thus elevating relatedness and inbreeding rates. This finding aligns with the present study, where traits evaluated showed low to moderate heritability. The SS25 scenario consistently resulted in the highest inbreeding rates, with GB producing higher inbreeding compared to SSGBLUP and PED. According to Tu et al (2024), GB predictions for traits such as egg number and clutch length are not significantly superior due to small training populations. Yan et al (2018) also indicated that GB provided limited improvements over PED when only small populations of genotyped individuals are used. Song et al (2019) evaluated the efficiency of genomic prediction for seven body measurement traits in pigs and suggested that genomic selection based on small reference populations of 400 genotyped animals yields less genetic information than larger pedigree-based datasets of 5,000 individuals.
In genomic-selection programmes, candidates closely related to the training population receive inflated estimated breeding values, which intensifies co-selection of relatives and hastens homozygosity, especially under stringent truncation selection and low effective population size (Sørensen & Sørensen, 2010; Wolc et al, 2015). Additionally, partial implementation of genomic selection, as seen in scenarios like SS25 and SS50, results in elevated inbreeding rates due to imbalanced information, which inadvertently focuses selection on specific lines (Sørensen & Sørensen, 2010). Sørensen & Sørensen (2010) also note that unbalanced genotyping increases annual genetic gain by 2 to 4% but doubles inbreeding rates in the most extreme cases, with optimum contribution selection (OCS) outperforming truncation selection for balancing genetic gain and inbreeding. The distribution and number of genotyped males and females significantly influence genetic gain and inbreeding reduction (Sørensen & Sørensen, 2010). The results of this study are consistent with the findings reported by Büttgen et al (2025) that for all simulated generation intervals, genomic selection for females not only led to a greater increase in genetic gain, but also to higher inbreeding, compared to a scenario with the same design but selection based on pedigree BLUP EBVs.
Finally, Figure 7 presents the ratio of genetic gain to inbreeding (∆G/∆F) across seven breeding scenarios. According to Büttgen et al (2025), the breeding programme attaining the highest genetic progress per unit of inbreeding is considered the most sustainable. In line with this criterion, the GB scenario consistently exhibited the highest ∆G/∆F ratios, achieving values of 417.74 for males and 423.37 for females, thus demonstrating superior efficiency in maximizing genetic gain relative to inbreeding. When compared to the PED scenario, the GB scenario improved the ∆G/∆F ratio by approximately 19% for females and 23% for males (Figure 7).
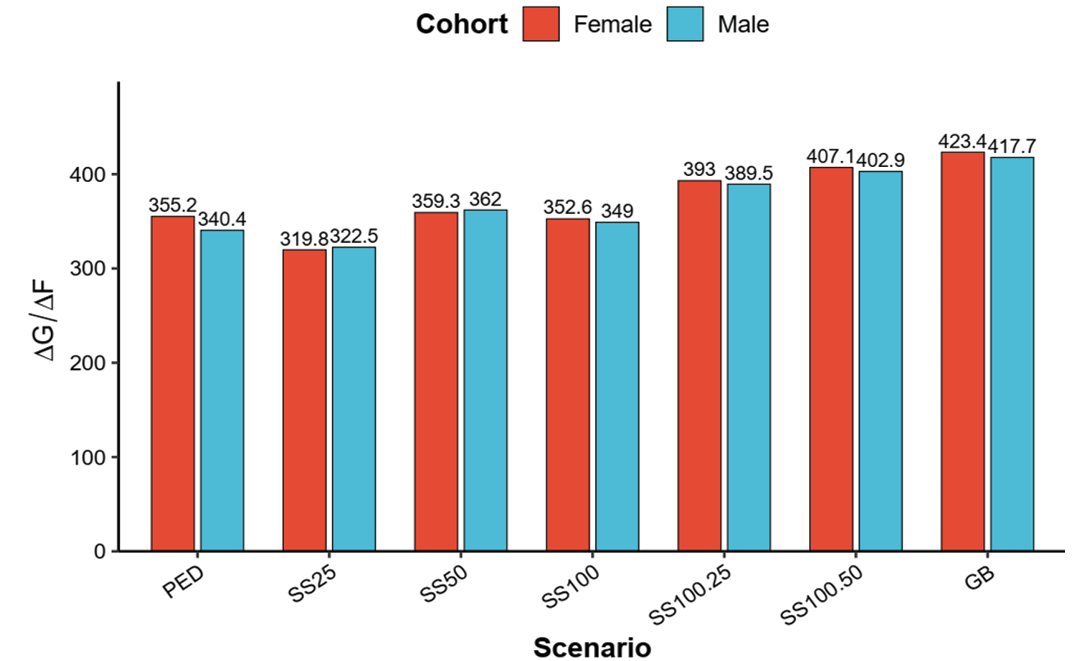
Figure 7. Genetic gain-to-inbreeding ratio (ΔG/ΔF) in male and female cohorts under seven evaluated scenarios (PED, SS25, SS50, SS100, SS100.25, SS100.50, GB) at generation 20. Abbreviations as in Figure 2.
The SS100.50 scenario followed closely, attaining ratios of 407.16 and 402.92 for females and males, respectively, representing gains of 14.5% and 18% relative to PED. Conversely, the SS25 and PED scenarios recorded lower ∆G/∆F values (319.89 and 355.51 for females; 322.46 and 340.43 for males), highlighting their lower efficiency in achieving a balanced trade-off between genetic gain and inbreeding. These findings align with previous studies (Raoul et al, 2017; Ndung’u, 2021; Thomasen et al, 2020; Martin et al, 2024), confirming that genomic selection methods, such as GB and SSGBLUP, consistently outperform traditional pedigree-based approaches in optimizing genetic improvement relative to inbreeding.
Practical implications
This study employed stochastic simulations using the MoBPS framework to evaluate the efficacy of PED, SSGBLUP, and GB across seven genotyping scenarios within a closed-nucleus breeding scheme for the DK IC in Eritrea. The simulation study presented herein was structured to reflect realistic breeding programme parameters, drawing upon empirical data from similar IC improvement initiatives in Kenya (Ilatsia et al, 2017; Miyumo et al, 2024) and Ethiopia (Esatu et al, 2022). Furthermore, to enhance authenticity, actual genotype and phenotype data from DK were integrated into the simulation. This study provides critical insights for developing effective breeding strategies aimed at increasing egg production within IC populations, particularly in resource-limited environments. In response to the escalating consumer demand for IC eggs and meat (Ilatsia et al, 2017), this simulation emphasized formulating alternative breeding objectives geared toward establishing specialized egg-laying strains capable of rapid genetic advancement and enhanced economic returns. This approach serves as a foundational step towards developing DK lines adapted to the feed-scarce and disease-prone conditions prevalent in Eritrea, aligning with recommendations by Okeno et al (2013).
The design of the IC improvement programme incorporated three critical traits and involved minimal genotyping, specifically targeting females within the reference population. This strategy facilitates the selection of early-maturing and feed-efficient birds well-suited to the harsh production environment realities encountered in Eritrea's scavenging poultry systems (Habteslasie, 2018; Habteslasie et al, 2026). The simplicity, practicality and affordability of the proposed programme are particularly relevant given the financial constraints commonly observed in similar breeding programmes within developing nations (Ouédraogo et al, 2021).
All seven breeding scenarios assessed in this study resulted in positive genetic gains, albeit with varying inbreeding. The outcomes clearly delineate pathways for designing sustainable breeding programmes focused on egg-laying productivity within smallholder, resource-constrained contexts. Specifically, genomic selection methods, including SSGBLUP and conventional genomic BLUP (GB scenario), substantially improved genetic progress in egg-laying traits of DK chickens compared to traditional pedigree-based approaches. Importantly, the partial genotyping strategies examined, such as SS100.25 and SS100.50, demonstrated significant genetic improvement (17% and 23%, respectively) without incurring the prohibitive costs associated with full population genotyping.
Despite these advantages, initial investment in genotyping infrastructure poses a substantial challenge, particularly given the limited application of genomic selection in poultry breeding within resource-poor regions (Habimana et al, 2024) like Eritrea. The prohibitive cost of genotyping relative to the value of individual selection candidates remains a critical barrier (Wolc et al, 2015). In contrast, this study revealed that targeted partial genotyping, notably of selected females, significantly mitigates these financial burdens while maintaining genetic gains, rendering GS more feasible for local breeding programmes. Moreover, the SSGBLUP framework in this study recaptured much of the advantage offered by comprehensive multi-step genomic selection strategies, presenting an attractive option for smallholder and resource-limited breeding schemes, particularly when extensive genotyping is impractical (Tu et al, 2024). Given the distinctive characteristics of the DK ecotype, including thermotolerance and disease resistance, maintaining genetic diversity and minimizing inbreeding are crucial for sustainable programme outcomes. Therefore, strategies such as optimal contribution selection (OCS), which improve the genetic gain-to-inbreeding rate ratio, are highly recommended due to their minimal associated costs (Büttgen et al, 2025).
Conclusion
This study provides a robust foundation for implementing genetic selection strategies in the DK IC breeding programme to achieve affordable, faster and sustainable genetic gains in resource-constrained environments. Full GB yielded the highest gain-to-inbreeding ratio, but SSGBLUP with targeted genotyping captured 90% of this benefit at a significantly lower cost of genotyping, making it a pragmatic choice for low-resource settings. Genetic gains increased with the number of genotyped individuals, while the accuracy of breeding value estimation was primarily influenced by the size and distribution of the genotyped reference population. Implementing this breeding framework could raise Eritrean egg yield by more than 8% per year while further field trials on optimized contribution-controlled mating and cost-effective reference-genotyping strategies, such as low-coverage sequencing to expand the reference panel, would refine the programme and help manage inbreeding effectively. Collectively, these insights provide a practical framework for improving low-input poultry systems, supporting smallholder farmers, and strengthening Eritrea’s socio-economic resilience through enhanced IC production.
Statement on the use of artificial intelligence
During the preparation of this manuscript, the authors used ChatGPT and DeepSeek for language editing, grammar correction, and improving clarity. The authors reviewed and edited all AI- assisted text and take full responsibility for the content of the manuscript.
Acknowledgements
Authors are grateful to Moi University and Egerton University, and Dr Torsten Pook from University of Göttingen.
Author contributions
Both authors were involved in study design, data collection and processing, data analysis and interpretation, literature review, manuscript writing, critical revision, submission, and resubmission.
Conflict of interest
The author declared that there is no conflict of interest.
References
Adomako, K., Sovi, S., Kyei, B., Hamidu, J. A., Olympio, O. S., & Aggrey, S. E. (2024). Phenotypic characterization and analysis of genetic diversity between commercial crossbred and indigenous chickens from three different agro-ecological zones using DArT-Seq technology. PLoS ONE, 19, 1–19. https://doi.org/10.1371/journal.pone.0297643
Akombi, B. J., Agho, K. E., Merom, D., Renzaho, A. M., & Hall, J. J. (2017). Child malnutrition in sub-Saharan Africa: A meta-analysis of demographic and health surveys (2006-2016). PLoS ONE, 12(5), 1–11. https://doi.org/10.1371/journal.pone.0177338
Barłowska, J., Sawicka-Zugaj, W., Janczarek, I., Kasprzak-Filipek, K., & Chabuz, W. (2025). Significance of local livestock genetic resources in the context of global food security. Annals of Animal Science, 1–37. https://doi.org/10.2478/aoas-2025-0029
Biazen, A. (2021). Comparative performance evaluation of local and tropical adapted exotic breeds of chickens in Ethiopia [Haramaya University]. https://doi.org/10.13140/RG.2.2.21730.61123
Birhanu, M. Y., C., T., Esatu, W., , Hoang, H., Theary, R., Cha, B., Phem, M., V., S., S., P., Tum, S., & Dessie, T. (2023). Characterizing smallholder poultry production in Cambodia: Evidence from a baseline survey (No. 119; ILRI Research Report). https://hdl.handle.net/10568/132261
Büttgen, L., Simianer, H., & Pook, T. (2025). Analysis of different genotyping and selection strategies in laying hen breeding programs. Genetics Selection Evolution, 57(1), 1–15. https://doi.org/10.1186/s12711-025-00948-4
Donnelly, K. P. (1983). The probability that related individuals share some section of genome identical by descent. Theoretical Population Biology, 23(1), 34–63. https://doi.org/10.1016/0040-5809(83)90004-7
Elder, S., Wilkings, A., Larrea, C., Elamin, N., & Fernandez de Cordoba, S. (2021). State of Sustainability Initiatives Review: Standards and Poverty Reduction. International Institute for Sustainable Development. https://www.iisd.org/system/files/2021-12/ssi-initiatives-review-standards-poverty-reduction.pdf
Esatu, W., Kassa, B., Lulie, B., Kebede, A., Genetu, G., Yismaw, K., Jember, Z., Yeheyis, L., Girma, M., & Dessie1, and T. (2022). A guide to setting up a selective indigenous chicken improvement program: The Tilili breed in Ethiopia (No. 57; ILRI Manual, Issue February). https://hdl.handle.net/10568/118159
FAO. (2019). The State of the World’s Biodiversity for Food and Agriculture. In J. Bélanger & D. Pilling (Eds.), FAO. https://www.fao.org/3/CA3129EN/CA3129EN.pdf
FAOSTAT. (2023). Global chicken population. Food and Agriculture Organization of the United Nation. https://www.fao.org/faostat/en/#data/QCL
Faruque, S., Bhuiyan, A., Ali, M. Y., Joy, Z., & Rashid, M. (2017). Conservation and improvement of native chicken: performance of fourth generation. Asian-Australasian Journal of Bioscience and Biotechnology, 2(1), 37–44. https://doi.org/10.3329/aajbb.v2i1.64044
Fathi, M. M., Galal, A., Al-Homidan, I., Abou-Emera, O. K., & Rayan, G. N. (2021). Residual feed intake: A limiting economic factor for selection in poultry breeding programs. Annals of Agricultural Sciences, 66(1), 53–57. https://doi.org/10.1016/j.aoas.2021.03.001
Gao, N., Teng, J., Pan, R., Li, X., Ye, S., Li, J., Zhang, H., Zhang, X., & Zhang, Z. (2019). Accuracy of whole genome prediction with single-step GBLUP in a Chinese yellow-feathered chicken population. Livestock Science, 1–6. https://doi.org/10.1016/j.livsci.2019.103817
Ghebrezgabher, M. G., & Yang, T. (2018). Eritrea : Geographical and Cultural Perspectives. https://www.researchgate.net/publication/325464557
Gondwe, T. (2004). Characterisation of local chicken in low input - low output production systems : Is there scope for appropriate production and breeding strategies in Malawi ? [Doctoral dissertation, Georg-August-Universität Göttingen]. https://cuvillier.de/get/ebook/2607/3865373542.pdf
Habimana, R., Ngeno, K., & Okeno, T. (2024). Response to Selection of Indigenous Chicken in Rwanda Using Within-Breed Selection Strategy. Animal and Veterinary Sciences, 12(3), 95–106. https://doi.org/10.11648/j.avs.20241203.13
Habteslasie, H. A. (2018). Phenotypic Charaterization Of Indigenous Chicken And Their Production System In Gash-Barka Region Of Eritrea. [Master's thesis, Hamelmalo agricultural college].
Habteslasie, H. A., & Araya, M. R. (2018). Assessing the Reproductive and Productive Performance of Indigenous Chickens in Gash-Barka region of Eritrea. Sudan Journal of Science and Technology, 19(2), 1–16.
Habteslasie, H. A., Araya, M. R., & Arik, K. D. A. (2019). Qualitative Morphometeric Characterization of Indigenous Chicken of Gash-Barka Region in Eritrea. SUST Journal of Agricultural and Veterinary Sciences (SJAVS), 02(1), 89–105. https://repository.sustech.edu/handle/123456789/23346
Habteslasie, H. A., Ngeno, K., Okeno, T. O., Dessie, T., & Kahi, A. (2026). Productive and Reproductive Performance Diversity of Indigenous Chicken in Eritrea. International Journal of Poultry Science, 25, 33–50. https://doi.org/10.3923/ijps.2026.33.50
Henderson, C. R. (1975). Best linear unbiased estimation and prediction under a selection model published by : international biometric society stable. Biometrics, 31(2), 423–447. https://www.jstor.org/stable/2529430
Ilatsia, E. D., Magothe, T. M., Okeno, T.O., Muasya, T. K., Ngeno, K., Miyumo, S., Alaru, P. A. O., & Muhuyi, W. B. (2017). A Breeding programme for improvement and conservation of indigenous chicken in Kenya. The ASAL-APRP End of Project Conference and Exhibition, 11. https://www.researchgate.net/publication/316644665_
Juiputta, J., Chankitisakul, V., & Boonkum, W. (2025). Genetic Strategies for Enhancing Rooster Fertility in Tropical and Humid Climates: Challenges and Opportunities. Animals, 15(8), 1–17. https://doi.org/10.3390/ani15081096
Khaitsa, M. L., Lumutenga, N. W., H, K. C. M., & Muwazi, R. (2022). Use of Poultry Production to Empower Small Holder Women Farmers in East Africa. Pathways to African Feminism and Development, 7(1), 182–206. https://uonjournals.uonbi.ac.ke/index.php/aws/article/view/1623/1384
Khan, K. D., Alex, R., Yadav, A., Sahana, V. N., Upadhyay, A., Mani, R. V., Kumar, T. S., Pillai, R. R., Vohra, V., & Gowane, G. R. (2025). Optimizing the Genomic Evaluation Model in Crossbred Cattle for Smallholder Production Systems in India. Agriculture, 15(9), 1–19. https://doi.org/10.3390/agriculture15090945
Kozlov, D., & Ghebrehiwot, A. (2020). Integrated design and construction approach to hydrotechnical structures in Eritrea. IOP Conference Series: Materials Science and Engineering, 869(7), 1–8. https://doi.org/10.1088/1757-899X/869/7/072012
Kpomasse, C. C., Kouame, Y. A. E., N’nanle, O., Houndonougbo, F. M., Tona, K., & Oke, O. E. (2023). The productivity and resilience of the indigenous chickens in the tropical environments: improvement and future perspectives. Journal of Applied Animal Research, 51(1), 456–469. https://doi.org/10.1080/09712119.2023.2228374
Lee, H. S., Kim, Y., Lee, D. H., Seo, D., Lee, D. J., Do, C. H., Dinh, P. T. N., Ekanayake, W., Lee, K. H., Yoon, D., Lee, S. H., & Koo, Y. M. (2023). Comparison of accuracy of breeding value for cow from three methods in Hanwoo (Korean cattle) population. Journal of Animal Science and Technology, 65(4), 720–734. https://doi.org/10.5187/JAST.2023.E5
Lourenco, D. A. L., Fragomeni, B. O., Tsuruta, S., Aguilar, I., Zumbach, B., Hawken, R. J., Legarra, A., & Misztal, I. (2015). Accuracy of estimated breeding values with genomic information on males, females, or both: An example on broiler chicken. Genetics Selection Evolution, 47(1), 1–9. https://doi.org/10.1186/s12711-015-0137-1
Mancisidor, B., Cruz, A., Gutiérrez, G., Burgos, A., Morón, J. A., Wurzinger, M., & Gutiérrez, J. P. (2021). ssGBLUP method improves the accuracy of breeding value prediction in huacaya alpaca. Animals, 11, 1–9. https://doi.org/10.3390/ani11113052
Martin, R., Pook, T., Bennewitz, J., & Schmid, M. (2023). Optimization Strategies to Adapt Sheep Breeding Programs to Pasture-Based Production Environments: A Simulation Study. Animals, 13(22), 1–14. https://doi.org/10.3390/ani13223476
Martin, R., Pook, T., Bennewitz, J., & Schmid, M. (2024). Genomic selection strategies for the German Merino sheep breeding programme – A simulation study. Journal of Animal Breeding and Genetics, 142(3), 1–12. https://doi.org/10.1111/jbg.12897
Miyumo, S. A., Wasike, C. B., Ilatsia, E. D., Bennewitz, J., & Chagunda, M. G. G. (2023). Genetic and phenotypic correlations among feed efficiency, immune and production traits in indigenous chicken of Kenya. Frontiers in Genetics, 1–13. https://doi.org/10.3389/fgene.2022.1070304
Miyumo, S., Wasike, C. B., Ilatsia, E. D., Bennewitz, J., & Chagunda, M. G. G. (2024). Evaluation of selection strategies in dual-purpose and specialized breeding of indigenous chicken. Poultry Science, 103(8), 1–17. https://doi.org/10.1016/j.psj.2024.103916
Mujyambere, V., Adomako, K., Olympio, S. O., Ntawubizi, M., Nyinawamwiza, L., Mahoro, J., & Conroy, A. (2022). Local chickens in East African region : their production and potential. Poultry Science, 101, 1–21. https://doi.org/10.1016/j.psj.2021.101547
Müller, D., Schopp, P., & Melchinger, A. E. (2017). Persistency of prediction accuracy and genetic gain in synthetic populations under recurrent genomic selection. G3: Genes, Genomes, Genetics, 7, 801–811. https://doi.org/10.1534/g3.116.036582
Naik, J. L., Reddy, K. S., & Surendra, M. (2023). An Informal Economy of Women in Asmara (Eritrea ): A Case Study. IAHRW International Journal of Social Sciences Review, 11(1), 117–128. Ndung’u, C. W. (2021). Rate of Genetic Gain For Alternative Indigenous chicken Breeding Programmes in the Tropics. https://library.afribary.com/works/rates-of-genetic-gain-for-alternative-indigenous-chicken
Ndung, C. W., Muasya, T. K., & Okeno, T. O. (2021). Optimization of response to selection using genomic selection in indigenous chicken breeding programmes. South African Journal of Animal Science, 51(6), 723–734. https://doi.org/http://dx.doi.org/10.4314/sajas.v51i6.5
Nishio, M., Inoue, K., Ogawa, S., Ichinoseki, K., Arakawa, A., Fukuzawa, Y., Okamura, T., Kobayashi, E., Taniguchi, M., Oe, M., & Ishii, K. (2023). Comparing pedigree and genomic inbreeding coefficients, and inbreeding depression of reproductive traits in Japanese Black cattle. BMC Genomics, 24(1), 1–15. https://doi.org/10.1186/s12864-023-09480-5
Okeno, T. O., Kahi, A. K., & Peters, K. J. (2013). Evaluation of breeding objectives for purebred and crossbred selection schemes for adoption in indigenous chicken breeding programmes. British Poultry Science, 54(1), 62–75. https://doi.org/10.1080/00071668.2013.764492
Okeno, T. O., Magothe, T. M., Kahi, A. K., & Peters, K. J. (2021). Breeding objectives for indigenous chicken: Model development and application to different production systems. Tropical Animal Health and Production, 45(1), 193–203. https://doi.org/10.1007/s11250-012-0191-4
Ouédraogo, D., Soudré, A., Yougbaré, B., Ouédraogo-Koné, S., Zoma-Traoré, B., Khayatzadeh, N., Traoré, A., Sanou, M., Mészáros, G., Burger, P. A., Mwai, O. A., Wurzinger, M., & Sölkner, J. (2021). Genetic improvement of local cattle breeds in West Africa: A review of breeding programs. Sustainability, 13(4), 1–16. https://doi.org/10.3390/su13042125
Pius, L. O., Strausz, P., & Kusza, S. (2021). Overview of poultry management as a key factor for solving food and nutritional security with a special focus on chicken breeding in east african countries. Biology, 10, 1–20. https://doi.org/10.3390/biology10080810
Pocrnic, I., Obšteter, J., Gaynor, R. C., Wolc, A., & Gorjanc, G. (2023). Assessment of long-term trends in genetic mean and variance after the introduction of genomic selection in layers: a simulation study. Frontiers in Genetics, 14(May), 1–14. https://doi.org/10.3389/fgene.2023.1168212
Pook, T. (2025). Modular Breeding Program Simulator (1.6.64; pp. 1–121)[R package]. http://www.mobps.de
Pook, T., Büttgen, L., Ganesan, A., Ha, N. T., & Simianer, H. (2021). MoBPSweb: A web-based framework to simulate and compare breeding programs. G3: Genes, Genomes, Genetics, 11(2), 1–8. https://doi.org/10.1093/g3journal/jkab023
Raoul, J., Swan, A. A., & Elsen, J. M. (2017). Using a very low-density SNP panel for genomic selection in a breeding program for sheep. Genetics, Selection, Evolution : GSE, 49(1), 1–12. https://doi.org/10.1186/s12711-017-0351-0
Rena, R. (2008). Women’s Enterprise development In Eritrea Through Microfinance. The ICFAI University Journal of Entrepreneurship and Development, 5(3), 41–58.
Rutten, M. J. M., Bijma, P., Woolliams, J. A., & Van Arendonk, J. A. M. (2002). SelAction: Software to predict selection response and rate of inbreeding in livestock breeding programs. J.Hered, 93, 456–458. https://doi.org/10.1093/jhered/93.6.456
Sánchez-Mayor, M., Riggio, V., Navarro, P., Gutiérrez-Gil, B., Haley, C. S., De la Fuente, L. F., Arranz, J. J., & Pong-Wong, R. (2022). Effect of genotyping strategies on the sustained benefit of single-step genomic BLUP over multiple generations. Genetics Selection Evolution, 54(1), 1–14. https://doi.org/10.1186/s12711-022-00712-y
Simianer, H., Büttgen, L., Ganesan, A., Ha, N. T., & Pook, T. (2021). A unifying concept of animal breeding programmes. Journal of Animal Breeding and Genetics, 138(2), 137–150. https://doi.org/10.1111/jbg.12534
Song, H., Zhang, J., Zhang, Q., & Ding, X. (2019). Using different single-step strategies to improve the efficiency of genomic prediction on body measurement traits in pig. Frontiers in Genetics, 9, 1–10. https://doi.org/10.3389/fgene.2018.00730
Sørensen, A. C., & Sørensen, M. K. (2010). Inbreeding rates in breeding programs with different strategies for using genomic selection. Proceedings of the 2009 Interbull Meeting, 40, 94–97. https://journal.interbull.org/index.php/ib/article/download/1466/1466
Takeda, M., Inoue, K., Oyama, H., Uchiyama, K., Yoshinari, K., Sasago, N., Kojima, T., Kashima, M., Suzuki, H., Kamata, T., Kumagai, M., Takasugi, W., Aonuma, T., Soma, Y., Konno, S., Saito, T., Ishida, M., Muraki, E., Inoue, Y., … Uemoto, Y. (2021). Exploring the size of reference population for expected accuracy of genomic prediction using simulated and real data in Japanese Black cattle. BMC Genomics, 22(1), 1–11. https://doi.org/10.1186/s12864-021-08121-z
Thomasen, J. R., Liu, H., & Sørensen, A. C. (2020). Genotyping more cows increases genetic gain and reduces rate of true inbreeding in a dairy cattle breeding scheme using female reproductive technologies. Journal of Dairy Science, 103(1), 597–606. https://doi.org/10.3168/jds.2019-16974
Tu, T. C., Lin, C. J., Liu, M. C., Hsu, Z. T., & Chen, C. F. (2024). Comparison of genomic prediction accuracy using different models for egg production traits in Taiwan country chicken. Poultry Science, 103(10), 1–19. https://doi.org/10.1016/j.psj.2024.104063
VanRaden, P. M. (2008). Efficient methods to compute genomic predictions. Journal of Dairy Science, 91(11), 4414–4423. https://doi.org/10.3168/jds.2007-0980
Wang, M. S., Zhang, R. W., Su, L. Y., Li, Y., Peng, M. S., Liu, H. Q., Zeng, L., Irwin, D. M., Du, J. L., Yao, Y. G., Wu, D. D., & Zhang, Y. P. (2016). Positive selection rather than relaxation of functional constraint drives the evolution of vision during chicken domestication. Cell Research, 26(5), 556–573. https://doi.org/10.1038/cr.2016.44
Weldetsion, G. G. (2023). Eritrea’s Self-reliance policy and the Road to Sustainable Food and Water Security [Department of Economics SOAS University of London]. https://doi.org/10.25501/SOAS.00040447
Wolc, A., Zhao, H. H., Arango, J., Settar, P., Fulton, J. E., O’Sullivan, N. P., Preisinger, R., Stricker, C., Habier, D., Fernando, R. L., Garrick, D. J., Lamont, S. J., & Dekkers, J. C. M. (2015). Response and inbreeding from a genomic selection experiment in layer chickens. Genetics Selection Evolution, 47(1), 1–12. https://doi.org/10.1186/s12711-015-0133-5
Woolliams, J. A., & Bijma, P. (2000). Predicting rates of inbreeding in populations undergoing selection. Genetics Society of America, 154(4), 1851–1864. https://doi.org/10.1093/genetics/154.4.1851
Yan, Y., Wu, G., Liu, A., Sun, C., Han, W., Li, G., & Yang, N. (2018). Genomic prediction in a nuclear population of layers using single-step models. Poultry Science, 97(2), 397–402. https://doi.org/10.3382/ps/pex320
Zhang, J., Wang, J., Li, Q., Wang, Q., Wen, J., & Zhao, G. (2020). Comparison of the efficiency of BLUP and GBLUP in genomic prediction of immune traits in chickens. Animals, 10(3), 1–9. https://doi.org/10.3390/ani10030419
Zhao, J., Yuan, J., Wang, Y., Ni, A., Sun, Y., Li, Y., Ma, H., Wang, P., Shi, L., Ge, P., Bian, S., Zong, Y., & Chen, J. (2022). Assessment of Feed Efficiency and Its Relationship with Egg Quality in Two Purebred Chicken Lines and Their Reciprocal Crosses. Agriculture, 12, 1–13. https://doi.org/10.3390/agriculture12122171
Zhou, J., Yu, J. Z., Zhu, M. Y., Yang, F. X., Hao, J. P., He, Y., Zhu, X. L., Hou, Z. C., & Zhu, F. (2025). Optimizing Breeding Strategies for Pekin Ducks Using Genomic Selection: Genetic Parameter Evaluation and Selection Progress Analysis in Reproductive Traits. Applied Sciences, 15(1), 1–14. https://doi.org/10.3390/app15010194