Robust microsatellite markers for hybrid analysis between domesticated pigs and wild boar
Abstract
Hybridization between wild boar (Sus scrofa) and their domestic relative, pigs, is a global issue and gene flow between these populations has been known to negatively impact biodiversity with increased aggression, litter sizes, and growth. However, establishing a cost-effective analysis for long-term monitoring of possible gene flow of wild pigs into wild boar populations is challenging due to common alleles at multiple loci and often it is difficult to distinguish boar specific lineages. Therefore, there is a need to select loci with lineage specific alleles for hybrid detection. To determine these loci, we calculated allele frequencies and polymorphism measurements from successfully amplified microsatellite loci with DNA extracted from domestic pigs and wild boar populations from the period prior to, and after, the evacuations and disasters in Fukushima, Japan, in 2011, which resulted in an uncontrolled release of domestic pigs. Thirty-two microsatellite loci showed pig putative alleles suggesting these selected loci can be useful genetic markers. Seventeen loci successfully distinguished pig and wild boar hybridization in Fukushima populations. Identified loci from this study provide a cost-efficient tool for genetic analysis and will provide a wealth of information on how an uncontrolled release of domestic livestock from natural or anthropogenic disasters may impact their wild relatives.
Keywords
microsatellite, hybridization, alleles, pigs, polymorphism
Introduction
Hybridization between wild species and their domesticated relatives has been detected in multiple environments across the globe (Godinho et al., 2011; Goedbloed et al., 2013; Pierpaoli et al., 2003). Invasive species and hybridized individuals compete with native populations, and cause negative impacts to biodiversity (Harrison & Larson, 2014; Randi, 2008; Rhymer & Simberloff, 1996). Invasive pigs are known to successfully disperse in wild environments and cause considerable impact on the gene pool of native wild boar populations (Goedbloed et al., 2013; Koutsogiannouli, Moutou, Sarafidou, Stamatis, & Mamuris, 2010; Vernesi et al., 2003). Multiple countries have implemented management programs to reduce wild boar population expansion (Saito, Momose, & Mihira, 2011; Scandura et al., 2008; Waithman et al., 1999), but hybrid individuals may have increased litter sizes, aggression, and growth rates (Dzialuk, Zastempowska, Skórzewski, Twarużek, & Grajewski, 2018; Goedbloed et al., 2013). Areas of suspected hybridization between invasive pigs and wild boar populations should be continuously monitored to understand the extent of introgression of pig genes in the wild boar gene pool.
Microsatellite marker analysis is a well-established monitoring tool to evaluate possible introgression of invasive species and hybridization detection (Nijman et al., 2003; Randi, 2008; Uemura, Yoshimi, & Hata, 2018). The selection of reliable microsatellite markers by optimizing amplification protocols prior to monitoring a target population is of great importance because it has consequences for subsequent genotyping (Hoffman & Amos, 2005; Kolodziej, Theissinger, Brün, Schulz, & Schulz, 2012). However, genotyping hybrid individuals (e.g. crossed pig and boar) can be challenging due to common or shared alleles at multiple loci (Choi et al., 2014; Grossi, Lui, Garcia, & Meirelles, 2006; Larson et al., 2005) and it is necessary to select suitable loci with lineage specific alleles for hybridization detection. Validating appropriate microsatellite markers with possible hybridized wild boar and the pigs involved in the hybridization will provide the necessary genetic composition data to develop a cost-efficient monitoring tool to evaluate the introgression of pig genes to the wild boar gene pool. Such cost-efficient analyses have provided monitoring opportunities to estimate abundancy of hybrids (Matsumoto et al., 2019; Qi, Jianlin, Wang, Rege, & Hanotte, 2010), population characteristics (Goedbloed et al., 2013; Sharma et al., 2013) and local genetic structures (Tadano, Nagai, & Moribe, 2016; Touma, Arakawa, & Oikawa, 2020) in animals.
Genetic diversity and ancestry of wild boar have been well studied, including areas of South East Asia, and information from hybridization occurrences with domestic pigs is of increasing interest due to possible genetic alterations (Choi et al., 2014; Todesco et al., 2016). Wild boar populations inhabiting Fukushima prefecture, in Japan, are suggested to be threatened by hybridization following the uncontrolled release of domesticated pigs after mandated evacuations due to the Fukushima nuclear disasters in 2011 (Anderson et al., 2019; Okuda et al., 2018). Additionally, hybridization in this area has not altered the morphological characteristics of wild boar (Anderson et al., 2019) and possible hybrids can only be detected using DNA. Thus, estimating appropriate genotypes of wild boar from the period prior to 2011, after 2011, and from domestic pigs in this area, with microsatellite markers will provide an important source of information for better understanding hybridization effects with native species following such events. Adequate selection of microsatellite markers from this area will establish a cost-efficient tool to easily distinguish if a wild boar population has been impacted by hybridization.
In this study, we selected robust microsatellite markers used in European and Asian pig studies (FAO, 2011; Karlskov-Mortensen, Hu, Gorodkin, Reecy, & Fredholm, 2007; Krause, Morrison, Reed, & Alexander, 2002; Rohrer, Alexander, Keele, Smith, & Beattie, 1994) that could differentiate wild boar or pig alleles. Our goal for this study was two-fold: First, we aimed to select useful microsatellite markers for hybrid analysis between domesticated pig and wild boar populations; and second, to use these loci to perform a preliminary check of the introgression of pig alleles into wild boar populations in Fukushima prefecture following the disasters in 2011.
Materials and Methods
Analysed samples and DNA extraction
Thirty-one muscle tissue samples were collected from three populations (hereafter referred to as Pop1, Pop2 and Pop3) and were selected based on mitochondrial DNA (mtDNA) haplotype and year sampled. Sample haplotype and date were prioritized for optimal determination of reliable microsatellite screening of hybridization between wild boar and domesticated pigs after the Fukushima disasters in 2011. Pop1 samples were from 10 unrelated domestic pigs (Sus scrofa domesticus) that were collected from a local pig slaughterhouse or local markets within Fukushima prefecture in 2016-2017. Pop2 samples were from 13 wild boar (Sus scrofa) muscle samples that were collected in 2003-2004, prior to the evacuations and Fukushima disasters, from a wild boar population in northern Ibaraki prefecture, south of Fukushima prefecture. The mtDNA analysis has shown that this population is the same haplotype (D42172) and has extremely high genetic similarity to the wild boar population in eastern Fukushima prefecture (Nagata et al., 2006). Pop3 samples were collected in 2015-2016, after the Fukushima disasters, from eight suggested hybridized wild boar that had a typical mtDNA haplotype of pig (suggested pig ancestor in maternal lineage; MK801664, see Anderson et al. (2019)). All animals were legally culled by licensed hunters, and this entire study was approved by Fukushima University’s Institutional Animal Care and Use Committee. All experiments were performed in accordance with relevant guidelines and regulations. All samples were stored individually at −20 °C in 99.5% ethanol until extraction. Total genomic DNA was extracted from muscle tissue using the Gentra Puregene Tissue Kit (QIAGEN), according to manufacturer’s instructions.
Microsatellite loci genotyping
A total of 52 unlinked microsatellite loci were selected from previously developed phage libraries (Karlskov-Mortensen et al., 2007; Krause et al., 2002; Rohrer et al., 1994) and recommended microsatellite markers from the Food and Agriculture Organisation of the United Nations database (FAO, 2011) and screened for amplification success on all 31 samples.
PCR amplification was performed in 5 μL reactions using the QIAGEN Multiplex PCR Kit (QIAGEN) and a protocol for fluorescent dye-label (Blacket, Robin, Good, Lee, & Miller, 2012). Each sample reaction contained 10 to 20 ng of genomic template DNA, 2.5 μL of Multiplex PCR Master Mix, 0.1 μM of forward primer, 0.2 μM of reverse primer, and 0.1 μM of fluorescently labeled primer. Amplification conditions consisted of 95 °C for 15 minutes followed by 33 cycles of denaturation at 94 °C for 30 seconds, annealing at 57 °C for 1.5 minutes, and extension at 72 °C for 1 minute and an extension at 60 °C for 30 minutes. All thermal cycling conditions used in T100 thermal cycler (Bio-Rad Laboratories, Inc., Hercules, CA, USA). Product sizes were determined using an ABI PRISM 3130 Genetic Analyzer and GeneMapper software (Applied Biosystems, Foster City, CA, USA).
Characterization of microsatellite markers
Successful markers were identified after our initial screening by clear peak patterns following amplifications. Number of alleles (NA), observed heterozygosity (HO), and expected heterozygosity (HE) were calculated using GenAIEX version 6.5 (Peakall & Smouse, 2012) for successfully amplified loci. Calculation of inbreeding coefficients (FIS) and test of deviation from Hardy–Weinberg equilibrium (HWE) for polymorphic loci were tested using FSTAT version 2.9.3 (Goudet, 1995). Allele frequency in each locus for Pop1, Pop2, and Pop3 was calculated using GenAlEx version 6.41 (Peakall & Smouse, 2006). Genetic differentiation among Pop1, Pop2, and Pop3 (i.e. differentiation among pig, wild boar, and hybrids) was evaluated using AMOVA, calculating pairwise codominant genotypic distances (Smouse & Peakall, 1999), and performing principal coordinates analysis (PCoA) using GenAlEx version 6.41 (Peakall et al., 2006).
Results
Of the initial 52 microsatellite loci selected, 32 loci were successfully amplified with all wild boar and pig samples. Marker information is provided in Table 1. Twenty loci were eliminated based on low amplification success or unclear peak patterns in wild boar DNA samples collected from Pop2 and Pop3. Polymorphism measurements for the 32 amplified microsatellite loci in Pop1, Pop2, and Pop3 are summarized in Table 2. For Pop1, HO and HE per locus ranged from 0.10 to 1.00 (mean, 0.64) and from 0.10 to 0.82 (mean, 0.65), respectively. The range of FIS was -0.46 to 0.47 (mean, 0). For Pop2, HO and HE per locus ranged from 0.00 to 0.77 (mean, 0.36) and from 0.00 to 0.73 (mean, 0.39), respectively. The range of FIS was -0.28 to 0.85 (mean, 0.07). For Pop3, the HO and HE per locus ranged from 0.00 to 0.88 (mean, 0.45) and from 0.00 to 0.76 (mean, 0.44), respectively. The range of FIS was -0.62 to 1.00 (mean, -0.01). All 32 loci showed no evidence of significant deviation from HWE (P > 0.05).
In total, 231 putative alleles were identified that ranged from 1 to 8 per locus (mean, 4), as outlined in Table 2 (No. alleles). The mean number of alleles was 5.1, 3.2, and 3.3 for Pop1, Pop2, and Pop3, respectively. Of the 231 alleles, 52 (23%) were putative to the wild boar populations and 95 (41%) were putative to domestic pigs (Table 3). Additionally, 68 (30%) alleles were shared by pigs and one of the wild boar populations or by all three populations. Among the 68 shared alleles, 21 were shared by pigs and the wild boar population from the period after the Fukushima disasters in 2011 (bolded alleles in Table 4), indicating introgression of pig genes into the wild boar gene pool. The allele frequencies of amplified microsatellite markers, including those that distinguished these shared alleles between Pop1 and Pop3, are provided in Table 4.
|
Locus |
Primer sequence (5' → 3') Forward/Reverse |
Repeat motif |
Range of alleles (bp) |
Ta (℃) |
Fluorescent label |
Genebank accession No. |
|---|---|---|---|---|---|---|
|
Sw632 |
TGGGTTGAAAGATTTCCCAA |
(AC)21 |
115-138 |
55 |
FAM |
AF225099 |
|
|
GGAGTCAGTACTTTGGCTTGA |
|||||
|
S0090 |
CCAAGACTGCCTTGTAGGTGAATA |
(AC)24 |
227-253 |
55 |
FAM |
M95002 |
|
|
GCTATCAAGTATTGTACCATTAGG |
|||||
|
Sw24 |
CTTTGGGTGGAGTGTGTGC |
(GT)13 |
99-135 |
55 |
VIC |
AF235245 |
|
|
ATCCAAATGCTGCAAGCG |
|||||
|
Swr1941 |
AGAAAGCAATTTGATTTGCATAATC |
(TG)20 |
215-255 |
55 |
VIC |
AF253904 |
|
|
ACAAGGACCTACTGTATAGCACAGG |
|||||
|
Sw857 |
TGAGAGGTCAGTTACAGAAGACC |
(CA)22 |
165-187 |
55 |
NED |
AF225105 |
|
|
GATCCTCCTCCAAATCCCAT |
|||||
|
S0228 |
GGCATAGGCTGGCAGCAACA |
(AC)17 |
93-112 |
55 |
PET |
L29195 |
|
|
AGCCCACCTCATCTTATCTACACT |
|||||
|
Sw2008 |
CAGGCCAGAGTAGCGTGC |
(GT)25 |
148-170 |
55 |
FAM |
AF253773 |
|
|
CAGTCCTCCCAAAAATAACATG |
|||||
|
Sw240 |
AGAAATTAGTGCCTCAAATTGG |
(TG)17 |
164-186 |
55 |
VIC |
AF235246 |
|
|
AAACCATTAAGTCCCTAGCAAA |
|||||
|
S0097 |
GACCTATCTAATGTCATTATAGT |
(AC)28 |
135-155 |
55 |
NED |
M95020 |
|
|
TTCCTCCTAGAGTTGACAAACTT |
|||||
|
UMNp147 |
GCCTTCGTTACATGGCATTC |
(GT)23 |
151-167 |
58 |
PET |
AF511119 |
|
|
TCTCTGTGAGGTCATGGTGG |
|||||
|
UMNp239 |
CTTACAAAACCACCACCATCG |
(AC)18 |
96-112 |
60 |
FAM |
AF511146 |
|
|
TCAATATCAACATTGCGTGTTG |
|||||
|
UMNp296 |
CAGGGAACTCTCTTCAATATCC |
(TG)13 |
151-181 |
58 |
NED |
AF511184 |
|
|
ACATTTGATTTCCAAAGTTGTG |
|||||
|
UMNp298 |
GCTATAAGAACCGCCTCATTG |
(GT)22 |
157-169 |
58 |
NED |
AF511185 |
|
|
TGTGTGCTGCTGAAGCATG |
|||||
|
UMNp351 |
TCAGTGTCACCCCTCATCAC |
(AC)15 |
143-169 |
58 |
FAM |
AF511222 |
|
|
TCTCCTTGACCTTCTAAGCACC |
|||||
|
UMNp358 |
AAGTCATTTCACACCTCTGTGC |
(CA)22 |
160-176 |
58 |
VIC |
AF511230 |
|
|
CGTTGCAGTTACTATTCCAAGC |
|||||
|
UMNp362 |
GATGTGTAGCTGATTTGCAATG |
(AC)21 |
125-135 |
60 |
PET |
AF511231 |
|
|
GACAAGAATCTGAAAAGGAGCG |
|||||
|
UMNp381 |
CCGATTAGACCCCTAGTCTGG |
(AC)22 |
169-185 |
60 |
NED |
AF511244 |
|
|
CAGATTAGCGTTCCCTGTTTG |
|||||
|
UMNp405 |
CAGAGTTCACCTCTCCCTTTAC |
(AC)21 |
148-162 |
62 |
VIC |
AF511255 |
|
|
TCCTTGCTGAGTCCCAGG |
|||||
|
UMNp442 |
ATCCAAGCTGCTGAAGTTGG |
(TG)12 |
122-124 |
60 |
NED |
AF511283 |
|
|
AAACATTTCCACAAGAAAATGG |
|||||
|
UMNp453 |
TCATTCTCTATCTCAAGATGCATG |
(AC)17 |
122-140 |
58 |
PET |
AF511291 |
|
|
CTGAGGTACCTTTGCCTAGAGG |
|||||
|
UMNp480 |
AGTGATTTCTGCCCAGGATG |
(TG)21 |
143-155 |
58 |
VIC |
AF511308 |
|
|
CCTAGGAATTTCCCTCTGCC |
|||||
|
UMNp485 |
CCTCAGGCTCAGCTCTGC |
(TG)17 |
187-213 |
57 |
PET |
AF511313 |
|
|
GTTGTCCGTGAGTCCCTAGC |
|||||
|
UMNp489 |
AAGCACCATAGGAGAAGACTGG |
(AC)12 |
115-141 |
60 |
PET |
AF511317 |
|
|
CTCGGAAGCAAGTAAGTGGG |
|||||
|
UMNp494 |
CTGCCTGATTGGCACATTAG |
(AC)23 |
114-142 |
60 |
FAM |
AF511320 |
|
|
GGTAATGGGAAAGCCTAGCC |
|||||
|
UMNp500 |
TGAGGCTATCACCTGCAGTG |
(AG)24 |
229-251 |
60 |
FAM |
AF511324 |
|
|
GACTGAACCCTTAACAGATGGG |
|||||
|
UMNp502 |
TGGCAAACGTTGCTTTAGG |
(GT)22 |
164-172 |
60 |
VIC |
AF511325 |
|
|
TAGGGAAATATCTGAAATCTAAAATG |
|||||
|
UMNp509 |
AAACTACATCCATTCTCTTGGG |
(GT)21 |
138-164 |
60 |
FAM |
AF511328 |
|
|
GTTGTGCCAGTTACACTTCTGC |
|||||
|
UMNp511 |
GATCACTGTGTGAGTGCATGC |
(GT)14 |
107-117 |
60 |
VIC |
AF511329 |
|
|
AACAGAGTTCCATTTTGCGG |
|||||
|
UMNp539 |
CAACGTTGCTGTGGCTGTAG |
(CA)32 |
171-181 |
60 |
NED |
AF511346 |
|
|
TTCTGGTTTATGGTTCCCATG |
|||||
|
UMNp548 |
TCCAAGTTAGACTGCCTGCC |
(CA)14 |
172-180 |
60 |
NED |
AF511353 |
|
|
ACTGCTGCTTATTTCTCAAGGG |
|||||
|
UMNp610 |
CTTTGGCTCAATCTCATTCATG |
(AC)33 |
168-178 |
60 |
VIC |
AF511389 |
|
|
TGGGCTTTTGAAAATTTAAATG |
|||||
|
UMNp640 |
TATGCCATGTGCGTGGTC |
(AC)13 |
123-145 |
60 |
FAM |
AF511399 |
|
|
ACAAACTGCACCACAGAATAGC |
|||||
|
Locus |
Pop1 (n = 10) |
|
Pop2 (n = 13) |
|
Pop3 (n = 8) |
|
|||||||||
|
NA |
HO |
HE |
FIS |
|
NA |
HO |
HE |
FIS |
|
NA |
HO |
HE |
FIS |
|
|
|
Sw632 |
5 |
0.80 |
0.79 |
-0.01 |
2 |
0.38 |
0.50 |
0.23 |
3 |
0.50 |
0.40 |
-0.25 |
|||
|
S0090 |
6 |
0.90 |
0.77 |
-0.17 |
2 |
0.08 |
0.07 |
-0.04 |
3 |
0.43 |
0.36 |
-0.20 |
|||
|
Sw24 |
6 |
0.56 |
0.77 |
0.27 |
4 |
0.31 |
0.39 |
0.21 |
6 |
0.88 |
0.76 |
-0.15 |
|||
|
Swr1941 |
5 |
0.60 |
0.72 |
0.16 |
2 |
0.15 |
0.26 |
0.41 |
2 |
0.14 |
0.13 |
-0.08 |
|||
|
Sw857 |
6 |
1.00 |
0.75 |
-0.33 |
3 |
0.31 |
0.27 |
-0.14 |
3 |
0.38 |
0.32 |
-0.17 |
|||
|
S0228 |
5 |
0.40 |
0.59 |
0.32 |
5 |
0.77 |
0.69 |
-0.11 |
4 |
0.38 |
0.66 |
0.44 |
|||
|
Sw2008 |
5 |
0.90 |
0.70 |
-0.29 |
4 |
0.31 |
0.38 |
0.19 |
3 |
0.63 |
0.48 |
-0.31 |
|||
|
Sw240 |
6 |
0.70 |
0.77 |
0.08 |
2 |
0.31 |
0.43 |
0.28 |
3 |
0.50 |
0.55 |
0.10 |
|||
|
S0097 |
6 |
0.60 |
0.79 |
0.24 |
4 |
0.38 |
0.48 |
0.19 |
4 |
0.63 |
0.63 |
0.01 |
|||
|
UMNp147 |
7 |
0.80 |
0.81 |
0.01 |
4 |
0.08 |
0.51 |
0.85 |
3 |
0.13 |
0.23 |
0.45 |
|||
|
UMNp239 |
4 |
0.50 |
0.62 |
0.19 |
4 |
0.62 |
0.56 |
-0.10 |
4 |
0.75 |
0.68 |
-0.10 |
|||
|
UMNp296 |
7 |
0.80 |
0.81 |
0.01 |
3 |
0.69 |
0.61 |
-0.14 |
5 |
0.75 |
0.66 |
-0.14 |
|||
|
UMNp298 |
6 |
0.80 |
0.76 |
-0.05 |
3 |
0.23 |
0.21 |
-0.10 |
2 |
0.13 |
0.49 |
0.75 |
|||
|
UMNp351 |
5 |
0.40 |
0.76 |
0.47 |
5 |
0.62 |
0.49 |
-0.26 |
3 |
0.50 |
0.57 |
0.12 |
|||
|
UMNp358 |
7 |
0.60 |
0.81 |
0.25 |
4 |
0.31 |
0.33 |
0.08 |
2 |
0.50 |
0.38 |
-0.33 |
|||
|
UMNp362 |
2 |
0.30 |
0.38 |
0.20 |
1 |
0.00 |
0.00 |
N/A |
1 |
0.00 |
0.00 |
N/A |
|||
|
UMNp381 |
2 |
0.10 |
0.10 |
-0.05 |
5 |
0.62 |
0.73 |
0.15 |
3 |
0.13 |
0.23 |
0.45 |
|||
|
UMNp405 |
3 |
0.40 |
0.34 |
-0.19 |
1 |
0.00 |
0.00 |
N/A |
2 |
0.13 |
0.12 |
-0.07 |
|||
|
UMNp442 |
3 |
0.30 |
0.27 |
-0.13 |
1 |
0.00 |
0.00 |
N/A |
2 |
0.00 |
0.22 |
1.00 |
|||
|
UMNp453 |
6 |
0.80 |
0.73 |
-0.10 |
2 |
0.08 |
0.07 |
-0.04 |
1 |
0.00 |
0.00 |
N/A |
|||
|
UMNp480 |
5 |
0.80 |
0.60 |
-0.34 |
2 |
0.31 |
0.36 |
0.13 |
2 |
0.38 |
0.30 |
-0.23 |
|||
|
UMNp485 |
6 |
0.80 |
0.61 |
-0.32 |
3 |
0.38 |
0.52 |
0.26 |
3 |
0.88 |
0.54 |
-0.62 |
|||
|
UMNp489 |
4 |
0.56 |
0.52 |
-0.07 |
3 |
0.54 |
0.48 |
-0.13 |
5 |
0.86 |
0.65 |
-0.31 |
|||
|
UMNp494 |
4 |
0.50 |
0.59 |
0.15 |
4 |
0.62 |
0.48 |
-0.28 |
4 |
0.75 |
0.67 |
-0.12 |
|||
|
UMNp500 |
5 |
0.70 |
0.76 |
0.07 |
4 |
0.46 |
0.63 |
0.27 |
6 |
0.88 |
0.64 |
-0.37 |
|||
|
UMNp502 |
4 |
0.80 |
0.67 |
-0.20 |
5 |
0.31 |
0.34 |
0.09 |
5 |
0.50 |
0.50 |
0.00 |
|||
|
UMNp509 |
5 |
0.70 |
0.67 |
-0.05 |
4 |
0.38 |
0.49 |
0.21 |
5 |
0.63 |
0.50 |
-0.25 |
|||
|
UMNp511 |
4 |
0.90 |
0.62 |
-0.46 |
4 |
0.77 |
0.67 |
-0.16 |
4 |
0.38 |
0.62 |
0.39 |
|||
|
UMNp539 |
8 |
0.70 |
0.82 |
0.14 |
3 |
0.46 |
0.41 |
-0.12 |
4 |
0.63 |
0.55 |
-0.13 |
|||
|
UMNp548 |
3 |
0.50 |
0.51 |
0.01 |
2 |
0.15 |
0.36 |
0.57 |
2 |
0.13 |
0.12 |
-0.07 |
|||
|
UMNp610 |
6 |
0.60 |
0.72 |
0.17 |
3 |
0.15 |
0.14 |
-0.06 |
4 |
0.38 |
0.41 |
0.09 |
|||
|
UMNp640 |
7 |
0.70 |
0.70 |
-0.01 |
3 |
0.69 |
0.54 |
-0.27 |
4 |
0.75 |
0.65 |
-0.16 |
|||
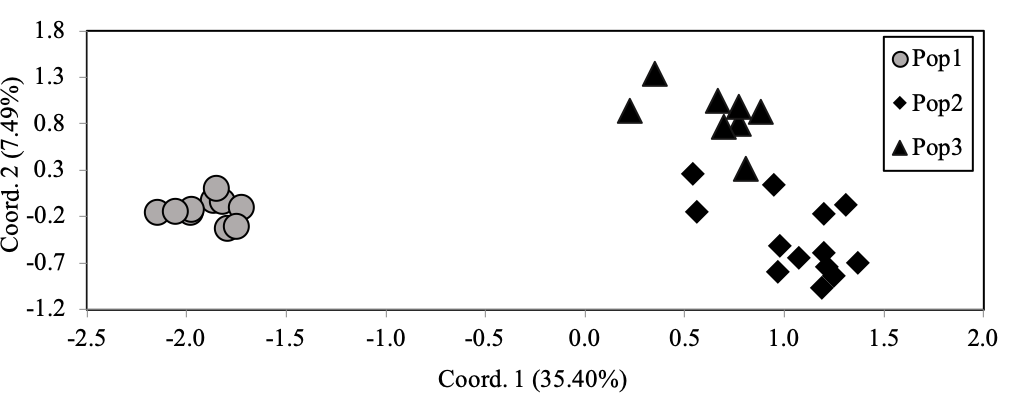
AMOVA suggested strong genetic differentiation between the three populations (FST = 0.318, p < 0.001). Genetic differentiation is also well-supported by clear divisions among the three populations with PCoA (Figure 1). Pop1 is uniquely distinguished along the first axis and Pop2/Pop3 are distinguished along the second axis. Furthermore, codominant genotypic distances describe 35.40% and 7.4% of the variation with the first and second axes, respectively. Taken together, our data strongly indicate genetic differentiation of pigs, wild boar from the the period prior to, and after, the disasters in Fukushima in 2011.
Discussion
All 32 loci selected from previous studies (FAO, 2011; Karlskov-Mortensen et al., 2007; Krause et al., 2002; Rohrer et al., 1994) showed pig putative alleles suggesting they can be useful for wild boar and pig hybrid analysis in Fukushima and elsewhere. The presence of pig-specific alleles at certain loci depends on the genetic composition of the target population and the pig population involved in the hybridization. In this study, pig samples were from slaughterhouses and farms nearby the evacuated area to improve the likelihood of detecting newly introgressive pig alleles in the hybridized wild boar. One of the pigs sampled had the mtDNA haplotype that was the same as hybrid wild boar in Fukushima (Anderson et al., 2019), and the sampled pig population in this study had high genetic variation (mean NA = 5.1). Therefore, we were confident in the representation of the pig genetic composition involved in the hybridization for this study and were able to distinguish an appropriate set of markers for hybrid analysis. Our selective use of markers with low frequencies of common alleles in source pig individuals and target wild boar populations is highly suggested for cost-effective analysis.
The highest number of alleles was observed in the pig population, which was expected because of human mediated translocations of domestic populations with high genetic diversity (Scandura et al., 2008; Yang et al., 2017). Additionally, if the 95 pig putative alleles were excluded, then 27% of the detected alleles were shared by all three populations in this study (Table 3). The high percentage of shared alleles between pig and wild boar verifies the challenge of identifying appropriate markers for hybridization analysis.
Seventeen of the 32 microsatellite loci distinguished hybridization between pigs and wild boar in this study and these can be used as robust markers, specifically for wild boar populations in Fukushima. These seventeen markers detected at least one of the 21 alleles that were only shared between Pop1 and Pop3 (bolded alleles in Table 4). Alleles only shared by Pop1 and Pop3, and not detected in Pop2, would suggest that the alleles were introgressive through mixing of pigs and wild boar during the period after the 2011 evacuations and Fukushima disasters. The higher percent of total shared alleles between Pop1 and Pop3 (9%), compared to Pop1 and Pop2 (4%), indicates that there is likely more genetic mixing between Pop1 and Pop3 (Table 3), which would also support the hypothesis of hybridization occurring after disasters in 2011.
|
Population(s) |
Putative allele origin |
Number of alleles (% of total alleles) |
|---|---|---|
|
Pop1 (pig) |
Pig |
95 (41%) |
|
Pop2 (wild boar) |
Wild boar |
18 (8%) |
|
Pop3 (hybrid boar) |
Pig and/or wild boar |
16 (7%) |
|
Shared Pop1 and Pop2 |
Pig and/or wild boar |
10 (4%) |
|
Shared Pop1 and Pop3 |
Pig |
21 (9%) |
|
Shared Pop2 and Pop3 |
Wild boar |
34 (15%) |
|
Shared Pop1, Pop2, and Pop3 |
Pig and/or wild boar |
37 (16%) |
|
Total alleles |
231 |
|
Locus |
Allele |
Frequency |
Locus |
Allele |
Frequency |
||||
|
Pop1 |
Pop2 |
Pop3 |
Pop1 |
Pop2 |
Pop3 |
||||
|
Sw2008 |
102B |
0 |
0.15 |
0.69 |
UMNp362 |
124P |
0.25 |
0 |
0 |
|
|
106B |
0 |
0.77 |
0.19 |
|
126P |
0.75 |
0 |
0 |
|
|
108 |
0.05 |
0.04 |
0 |
|
132B |
0 |
1 |
1 |
|
|
110P |
0.25 |
0 |
0 |
UMNp381 |
165P |
0.05 |
0 |
0.06 |
|
|
112 |
0.45 |
0.04 |
0 |
|
167B |
0 |
0.35 |
0 |
|
|
114P |
0.1 |
0 |
0.13 |
|
173 |
0.95 |
0.27 |
0.88 |
|
|
116P |
0.15 |
0 |
0 |
|
175B |
0 |
0.08 |
0.06 |
|
Sw24 |
121 |
0 |
0 |
0.06 |
|
179B |
0 |
0.27 |
0 |
|
|
123P |
0.28 |
0 |
0 |
|
181B |
0 |
0.04 |
0 |
|
|
125 |
0.06 |
0.77 |
0.13 |
UMNp405 |
140 |
0 |
0 |
0.06 |
|
|
127B |
0 |
0.08 |
0.06 |
|
144 |
0.15 |
1 |
0.94 |
|
|
129 |
0.33 |
0.08 |
0.38 |
|
148P |
0.05 |
0 |
0 |
|
|
131 |
0.17 |
0.08 |
0.25 |
|
156P |
0.8 |
0 |
0 |
|
|
133P |
0.11 |
0 |
0 |
UMNp442 |
118 |
0 |
0 |
0.13 |
|
|
135P |
0.06 |
0 |
0 |
|
120 |
0.1 |
1 |
0.88 |
|
|
139 |
0 |
0 |
0.13 |
|
122P |
0.85 |
0 |
0 |
|
Sw240 |
107P |
0.1 |
0 |
0 |
|
124P |
0.05 |
0 |
0 |
|
|
111P |
0.4 |
0 |
0 |
UMNp453 |
122 |
0.05 |
0.96 |
1 |
|
|
113P |
0.15 |
0 |
0 |
|
130P |
0.05 |
0 |
0 |
|
|
119B |
0 |
0.69 |
0.5 |
|
132P |
0.1 |
0 |
0 |
|
|
121P |
0.1 |
0 |
0 |
|
134P |
0.1 |
0 |
0 |
|
|
123P |
0.1 |
0 |
0 |
|
136 |
0.3 |
0.04 |
0 |
|
|
125 |
0.15 |
0.31 |
0.44 |
|
138P |
0.4 |
0 |
0 |
|
|
127 |
0 |
0 |
0.06 |
UMNp480 |
136P |
0.15 |
0 |
0 |
|
Sw632 |
160 |
0 |
0.5 |
0.75 |
|
138B |
0 |
0.77 |
0.81 |
|
|
172P |
0.25 |
0 |
0 |
|
144P |
0.6 |
0 |
0 |
|
|
174 |
0.2 |
0.5 |
0.19 |
|
146 |
0.1 |
0.23 |
0.19 |
|
|
180P |
0.25 |
0 |
0 |
|
148P |
0.1 |
0 |
0 |
|
|
182P |
0.15 |
0 |
0.06 |
|
152P |
0.05 |
0 |
0 |
|
|
184P |
0.15 |
0 |
0 |
UMNp485 |
185B |
0 |
0.58 |
0.38 |
|
Sw857 |
156P |
0.05 |
0 |
0 |
|
193B |
0 |
0.38 |
0.56 |
|
|
164P |
0.15 |
0 |
0 |
|
195B |
0 |
0.04 |
0 |
|
|
166P |
0.35 |
0 |
0 |
|
203P |
0.1 |
0 |
0 |
|
|
168 |
0.05 |
0.12 |
0.06 |
|
207P |
0.6 |
0 |
0 |
|
|
170 |
0.3 |
0.85 |
0.81 |
|
209P |
0.1 |
0 |
0 |
|
|
172 |
0.1 |
0.04 |
0.13 |
|
211P |
0.05 |
0 |
0.06 |
|
Swr1941 |
224B |
0 |
0.85 |
0.93 |
|
219P |
0.05 |
0 |
0 |
|
|
228 |
0.3 |
0.15 |
0.07 |
|
225P |
0.1 |
0 |
0 |
|
|
232P |
0.4 |
0 |
0 |
UMNp489 |
116P |
0.11 |
0 |
0.07 |
|
|
234P |
0.15 |
0 |
0 |
|
126P |
0.67 |
0 |
0.07 |
|
|
236P |
0.1 |
0 |
0 |
|
128 |
0.11 |
0.65 |
0.5 |
|
|
238P |
0.05 |
0 |
0 |
|
130 |
0.11 |
0.04 |
0 |
|
S0090 |
252P |
0.05 |
0 |
0 |
|
134 |
0 |
0 |
0.07 |
|
|
254 |
0.35 |
0.96 |
0.79 |
|
140B |
0 |
0.31 |
0.29 |
|
|
256 |
0.15 |
0.04 |
0.07 |
UMNp494 |
108P |
0.5 |
0 |
0 |
|
|
258P |
0.2 |
0 |
0.14 |
|
114 |
0 |
0 |
0.06 |
|
|
260P |
0.2 |
0 |
0 |
|
126B |
0 |
0.15 |
0.31 |
|
|
262P |
0.05 |
0 |
0 |
|
128B |
0 |
0.12 |
0.19 |
|
S0097 |
230P |
0.1 |
0 |
0 |
|
130 |
0.4 |
0.69 |
0.44 |
|
|
232P |
0.2 |
0 |
0 |
|
132P |
0.05 |
0 |
0 |
|
|
238 |
0 |
0 |
0.13 |
|
134P |
0.05 |
0 |
0 |
|
|
240B |
0 |
0.08 |
0 |
|
141B |
0 |
0.04 |
0 |
|
|
244B |
0 |
0.04 |
0 |
UMNp500 |
219P |
0.3 |
0 |
0 |
|
|
250P |
0.3 |
0 |
0 |
|
221P |
0.15 |
0 |
0 |
|
|
252B |
0 |
0.69 |
0.5 |
|
223 |
0.05 |
0.12 |
0.06 |
|
|
254P |
0.1 |
0 |
0 |
|
225P |
0.3 |
0 |
0.13 |
|
|
256P |
0.25 |
0 |
0.06 |
|
227B |
0 |
0.54 |
0.56 |
|
|
258P |
0.05 |
0 |
0 |
|
229 |
0 |
0 |
0.13 |
|
|
260B |
0 |
0.19 |
0.31 |
|
237B |
0 |
0.12 |
0.06 |
|
S0228 |
239P |
0.6 |
0 |
0 |
|
239B |
0 |
0.23 |
0.06 |
|
|
241P |
0.05 |
0 |
0 |
|
245P |
0.2 |
0 |
0 |
|
|
243B |
0 |
0.42 |
0 |
UMNp502 |
156 |
0.2 |
0.81 |
0.69 |
|
|
245 |
0.05 |
0.04 |
0 |
|
158 |
0.05 |
0.04 |
0.06 |
|
|
247B |
0 |
0.23 |
0.19 |
|
160 |
0.45 |
0.04 |
0.06 |
|
|
251 |
0 |
0 |
0.19 |
|
162P |
0.3 |
0 |
0 |
|
|
255B |
0 |
0.27 |
0.13 |
|
164 |
0 |
0 |
0.13 |
|
|
257 |
0.2 |
0.04 |
0.5 |
|
166B |
0 |
0.08 |
0.06 |
|
|
259P |
0.1 |
0 |
0 |
|
168B |
0 |
0.04 |
0 |
|
UMNp147 |
141P |
0.3 |
0 |
0 |
UMNp509 |
133 |
0 |
0 |
0.06 |
|
|
147P |
0.1 |
0 |
0 |
|
141B |
0 |
0.08 |
0.13 |
|
|
148P |
0.05 |
0 |
0 |
|
143B |
0 |
0.12 |
0.69 |
|
|
149P |
0.2 |
0 |
0 |
|
145B |
0 |
0.69 |
0.06 |
|
|
153B |
0 |
0.04 |
0.06 |
|
147P |
0.05 |
0 |
0 |
|
|
157P |
0.2 |
0 |
0 |
|
151 |
0.4 |
0.12 |
0 |
|
|
159 |
0.05 |
0.23 |
0.88 |
|
153P |
0.4 |
0 |
0.06 |
|
|
163 |
0 |
0 |
0.06 |
|
155P |
0.1 |
0 |
0 |
|
|
165B |
0 |
0.65 |
0 |
|
157P |
0.05 |
0 |
0 |
|
|
167 |
0.1 |
0.08 |
0 |
UMNp511 |
98 |
0 |
0 |
0.13 |
|
UMNp239 |
90B |
0 |
0.54 |
0.31 |
|
102B |
0 |
0.46 |
0.56 |
|
|
92P |
0.35 |
0 |
0 |
|
106P |
0.35 |
0 |
0.13 |
|
|
94P |
0.5 |
0 |
0.13 |
|
108 |
0.1 |
0.12 |
0.19 |
|
|
96P |
0.1 |
0 |
0 |
|
110 |
0.5 |
0.31 |
0 |
|
|
98P |
0.05 |
0 |
0.13 |
|
112 |
0.05 |
0.12 |
0 |
|
|
104B |
0 |
0.38 |
0.44 |
UMNp539 |
159P |
0.05 |
0 |
0 |
|
|
106B |
0 |
0.04 |
0 |
|
161P |
0.05 |
0 |
0 |
|
|
108B |
0 |
0.04 |
0 |
|
165P |
0.25 |
0 |
0 |
|
UMNp296 |
147B |
0 |
0.15 |
0.06 |
|
167 |
0.05 |
0.23 |
0.19 |
|
|
149P |
0.1 |
0 |
0.06 |
|
169P |
0.2 |
0 |
0 |
|
|
151P |
0.15 |
0 |
0 |
|
171 |
0.05 |
0.04 |
0 |
|
|
155P |
0.2 |
0 |
0.06 |
|
173 |
0.25 |
0.73 |
0.63 |
|
|
159P |
0.3 |
0 |
0 |
|
175 |
0 |
0 |
0.13 |
|
|
161P |
0.05 |
0 |
0 |
|
177P |
0.1 |
0 |
0.06 |
|
|
167P |
0.15 |
0 |
0 |
UMNp548 |
168P |
0.65 |
0 |
0.06 |
|
|
171 |
0.05 |
0.35 |
0.44 |
|
170 |
0.25 |
0.23 |
0 |
|
|
177B |
0 |
0.5 |
0.38 |
|
176B |
0 |
0.77 |
0.94 |
|
UMNp298 |
153 |
0.25 |
0.88 |
0.56 |
|
178P |
0.1 |
0 |
0 |
|
|
155 |
0.2 |
0.08 |
0.44 |
UMNp610 |
162P |
0.45 |
0 |
0.06 |
|
|
167 |
0.35 |
0.04 |
0 |
|
164 |
0.2 |
0.92 |
0.75 |
|
|
169P |
0.05 |
0 |
0 |
|
166B |
0 |
0.04 |
0 |
|
|
185P |
0.1 |
0 |
0 |
|
170B |
0 |
0.04 |
0.06 |
|
|
191P |
0.05 |
0 |
0 |
|
174P |
0.15 |
0 |
0.13 |
|
UMNp351 |
130P |
0.1 |
0 |
0 |
|
178P |
0.05 |
0 |
0 |
|
|
136P |
0.3 |
0 |
0 |
|
180P |
0.05 |
0 |
0 |
|
|
140 |
0.3 |
0.15 |
0.56 |
|
186P |
0.1 |
0 |
0 |
|
|
142 |
0.2 |
0.08 |
0 |
UMNp640 |
113P |
0.05 |
0 |
0 |
|
|
144P |
0.1 |
0 |
0.13 |
|
117 |
0.45 |
0.23 |
0.38 |
|
|
156B |
0 |
0.04 |
0 |
|
119 |
0 |
0 |
0.06 |
|
|
162B |
0 |
0.69 |
0.31 |
|
121P |
0.3 |
0 |
0 |
|
|
166B |
0 |
0.04 |
0 |
|
127 |
0.05 |
0.62 |
0.44 |
|
UMNp358 |
154 |
0.05 |
0.81 |
0.75 |
|
129P |
0.05 |
0 |
0.13 |
|
|
158 |
0.25 |
0.08 |
0.25 |
|
135P |
0.05 |
0 |
0 |
|
|
160P |
0.2 |
0 |
0 |
|
137P |
0.05 |
0 |
0 |
|
|
164P |
0.05 |
0 |
0 |
|
139B |
0 |
0.15 |
0 |
|
|
166B |
0 |
0.08 |
0 |
|
|
|
|
|
|
|
168B |
0 |
0.04 |
0 |
|
|
|
|
|
|
|
169P |
0.05 |
0 |
0 |
|
|
|
|
|
|
|
170P |
0.15 |
0 |
0 |
|
|
|
|
|
|
|
172P |
0.25 |
0 |
0 |
|
|
|
|
|
The loci identified in this study (Table 4) provide a unique tool to contribute to determining a timeline of hybridization for these populations. Similar frequencies of pig alleles in other wild boar populations may suggest early stages of hybridization, as our data indicates recent occurrence of hybridization in Fukushima prefecture, following the release of domestic pigs into the wild boar populations in 2011 (Okuda et al., 2018). Additionally, the identified loci can contribute to determining if the introgressive alleles are being retained or lost due to natural causes (e.g. backcross) in the hybridized wild boar population using introgressive allele frequencies over time.
Studies have been published to determine wild boar and pig hybridization hotspots, recent occurrences, and genetic impacts using variable genetic markers, such as mtDNA sequence (Ishiguro, Naya, Horiuchi, & Shinagawa, 2002; McCann et al., 2014), RAD-seq analysis (Goddard & Hayes, 2007; Iacolina et al., 2018) or microsatellite markers (Murakami et al., 2014). However, Next Generation Sequencing (NGS), such as RAD-seq, have disadvantages including that a large amount of high-quality DNA is required, and the amount of data to be analyzed becomes demanding. Therefore, general genetic markers, such as microsatellite markers, are still useful for analysis of degraded DNA extracted from feces in the field and old specimens of bones (Kierepka et al., 2016). Selected robust markers from our study will show their advantages in future hybrid analysis and are cost-effective for immediate or continuous monitoring for small sample sizes or DNA analysis of degraded samples. Also, comparing NGS and microsatellite marker data from a common population in future studies will not only give more in-depth information about that target population, but will more clearly show the advantages and disadvantages of each marker.
Conflict of interest statement
The authors declare no conflict of interest.
Author contributions
DA and SK contributed to the writing, drafting, and execution of the manuscript. DA, YN and SK, contributed to data analysis and interpertation. All authors contributed to study design, revision, and approval of the submitted manuscript. All authors declare that the submitted work is their own and that copyright has not been breached in seeking its publication. Additionally, the submitted work has not been previously published and is not being considered elsewhere.
Data Availability Statement
The data that support the findings of this study are available from the corresponding author upon reasonable request.