A comprehensive study on how inbreeding influences the growth and reproductive traits of six indigenous chicken breeds subjected to selection programmes
Saber Jelokhani-Niaraki and Sholeh Ghorbani*
Biotechnology Research Department, Animal Science Research Institute of Iran, Agricultural Research, Education and Extension Organization (AREEO), Karaj, Iran
*Corresponding author: Sholeh Ghorbani (sholehghorbani@gmail.com)
Abstract: Indigenous chickens are a significant element of the farming system in rural areas of Iran. This study presents a systematic analysis of how inbreeding affects the growth and reproductive traits across six indigenous chicken breeds that are under genetic selection programmes. Pedigree data of 404,597 chickens from six indigenous chicken breeding centres were collected and analyzed over 15 to 29 generations. The study included eight production and reproduction traits. The results showed that the average inbreeding coefficient in the studied populations varied between 2.2% to 6.3% in centres. The average inbreeding rate was estimated to be between 0.3% and 0.6%, which is within the acceptable range for breeding programmes. Regression analysis of studied traits on inbreeding percentage showed that increased inbreeding had a slight negative effect on some traits, such that every 1% increase in inbreeding resulted in a decrease of 1.53 to 3.51g in body weight at 12 weeks and an increase of 0.12 to 0.38 days in age at sexual maturity. However, the effect of inbreeding on egg traits was insignificant. In conclusion, despite the implementation of a closed breeding system and genetic selection in centres, inbreeding has increased slowly in the populations, and genetic diversity has been maintained at an adequate level due to the successful implementation of selection and mating programmes running in indigenous chicken breeding centres.
Keywords: Inbreeding, indigenous chickens, selection, genetic progress, Iran
Introduction
Indigenous chicken (IC) breeds significantly contribute to rural economies in many developing and underdeveloped countries. They are especially important for the rural poor and marginalized communities, providing supplementary income and nutritious chicken eggs and meat for their consumption (Padhi, 2016). ICs are characterized by their disease resistance, adaptability to various climates, high immune competence and desirable meat and carcass quality (Jaturasitha et al, 2008; Szalay et al, 2016; Radwan, 2020). The production system's adaptability to diverse agroecological conditions, coupled with IC’s minimal resource requirements, accounts for their widespread adoption across various regions (Milkias et al, 2019). The majority of local populations have evolved in response to a specific and often challenging environment (Tolone et al, 2023). The adaptability of ICs to different environmental conditions, along with their proven potential for breeding improvements, offers a valuable genetic resource for tackling the challenges of food security in a world affected by climate change and increasing human population (Lawal and Hanotte, 2021). Although these breeds possess significant characteristics, they are not commonly farmed for commercial use because their productivity is lower than that of commercial breeds (Buranawit et al, 2025). Nevertheless, there has been a growing consumer demand for natural and organic food products in recent years. This shift has impacted the poultry sector, resulting in a growing popularity of alternative rearing methods like organic, agroforestry, and free-range systems (Stefanetti et al, 2023). Nearly 90% of rural households traditionally raise a small flock of indigenous chickens in free-range, semi-scavenging systems (Padhi, 2016).
The productive performance of ICs can be enhanced through genetic improvement and optimized husbandry practices, including advancements in feeding, veterinary care and farm management protocols. From a genetic perspective, improvement strategies can involve selective breeding, crossbreeding, or a hybrid approach that integrates both methods (Padhi, 2016). ICs serve as reservoirs of genetic diversity, providing the foundation for selection in various production situations (Desta et al, 2013; Lawal et al, 2018). Thus, selective breeding aimed at improving traits in IC breeds may result in improved productivity within free-range systems, without raising production costs or losing biodiversity (Magothe et al, 2012). Although the selection programmes exhibit lengthy periods to achieve results, they provide more permanent genetic solutions, and such results are long-lasting (Padhi, 2016).
In Iran, backyard ICs significantly contribute to rural agriculture by serving as a source of both protein and income. Due to their importance in sustainable agriculture and consumer preference for IC products over commercial breeds, efforts have intensified to improve IC productivity. To achieve this, indigenous chicken breeding centres (ICBCs) were established across six provinces (Esfahan, Khorasan Razavi, Fars, Yazd, West Azerbaijan, and Mazandaran) in the country. The focus of ICBCs lies in the genetic improvement of some economic traits, alongside the reproduction and distribution of dual-purpose chickens that are adapted to regional conditions (for both rural and semi-industrial contexts). The IC breeding programme at these centres has been underway for several years to improve growth and reproductive traits. A similar selective breeding programme is implemented at the centres, with the selection process for each generation based on the estimated breeding values for five traits under selection derived from a multi-trait analysis approach. All populations of the ICBCs are closed, with no gene flow from external sources (Jelokhani-Niaraki and Ghorbani, 2021). The original base populations from each centre have now diverged into distinct, genetically improved breeds, characterized by their improved productive and reproductive performance. The country currently has six genetically improved chicken breeds, each originating from a dedicated centre within its respective province. These registered breeds are designated as follows: the Caspian (originating from the Mazandaran region), Parseh (from Fars), Sepahan (from Esfahan), Tusika (from Khorasan Razavi), Urmiana (from West Azerbaijan) and Isatis (from Yazd).
Increased inbreeding is one of the potential challenges that may occur in closed populations. Closed populations that are small and simultaneously under selection pressures may experience a rapid decrease in heterozygosity and allelic diversity (Selvaggi et al, 2010). Inbred individuals are often less adaptable to environmental changes, leaving them more sensitive and weaker (Barros et al, 2017). Maintaining genetic diversity in a population can be achieved by minimizing the rise in inbreeding over successive generations (D'Ambrosio et al, 2019). Even though inbreeding can be used as a valuable tool to identify and eliminate deleterious recessive alleles in a population, its consequences, such as reduced reproductive efficiency and growth rate, increased mortality rates, and increased incidence of hereditary diseases, have raised concerns (Yadav et al, 2019). Limiting inbreeding is vital to maintain genetic diversity, which in turn allows future generations to adapt to environmental change and respond to selection. Without this diversity, their adaptive capacity is critically diminished (Van Wyk et al, 2009). Inbreeding depression in domestic animals can reduce selection response and potential genetic progress in economic traits (Selvaggi et al, 2010). Increasing inbreeding within the closed populations of ICBCs might unfavourably influence the traits productivity during the selection process and potentially hinder breeding progress. Consequently, tracking inbreeding levels across generations is essential for optimizing selection and mating strategies. This study examined inbreeding rates and their effects on growth and reproductive traits in six indigenous chicken breeds to guide future breeding efforts.
Materials and methods
Data and traits
Data from 404,597 chickens were collected across six ICBCs in Esfahan, Khorasan Razavi, Fars, Mazandaran, Yazd, and West Azerbaijan provinces, spanning 15 to 29 generations (a year is equivalent to each generation). The study evaluated eight traits including body weight at hatch (BW1), body weight at 8 weeks (BW8), body weight at 12 weeks (BW12), age at sexual maturity (ASM), weight at sexual maturity (WSM), egg weight on the first day of laying (EW1), egg number (EN) and average egg weight (AEW). The AEW represents the average weight of eggs produced at 28, 30 and 32 weeks, while EN indicates the average number of eggs produced over the first 84 days. To avoid the increase of inbreeding within the ICBCs, a controlled mating system has been implemented. This system maintains a rooster-to-hen ratio of approximately 1:10 and prioritizes the selection of breeding stock with minimal genetic relatedness.
After mating the hens with a specific rooster, all eggs were individually marked with the parents' identification. Eggs from each hen were housed in distinct, partitioned sections of the hatching baskets. The use of covered baskets prevented the chicks from mixing after hatching, which guaranteed that every chick's parentage was known. The chicks were then tagged individually.
At these centres, chickens were selected in each generation based on estimated breeding values (EBVs) for some economic traits, using a multi-trait animal model analysis. A detailed description of the pedigree data investigated in this study is presented in Table 1.
Table 1. Pedigree data information used in the study
|
Indigenous chicken breeding centres (ICBCs) |
Pedigree information |
|||||
|
West Azerbaijan |
Yazd |
Esfahan |
Mazandaran |
Khorasan Razavi |
Fars |
|
|
61,974 |
57,746 |
98,064 |
82,265 |
39,280 |
65,268 |
No. of total chickens |
|
54,982 |
45,351 |
77,313 |
59,075 |
21,892 |
40,184 |
Inbred chickens |
|
1,792 |
1,071 |
1,911 |
2,250 |
1,165 |
2,782 |
Sires |
|
9,859 |
8,578 |
11,512 |
16,507 |
8,015 |
14,855 |
Dams |
|
11,651 |
9,649 |
13,423 |
18,757 |
9,180 |
17,637 |
Chickens with offspring |
|
50,323 |
48,097 |
84,641 |
63,508 |
30,100 |
47,631 |
Chickens without offspring |
|
21 |
15 |
21 |
26 |
12 |
25 |
No. of generations |
|
1994–2017 |
2001–2017 |
1995–2018 |
1990–2017 |
2006–2017 |
1991–2017 |
Years covered |
Statistical analysis
Pedigree data were processed through sequential rounds of screening and quality checks using Foxpro (version 2.6) and MS Excel (2010 version), and faulty or outlier data points were eliminated. The exclusion was based on practical and experiential grounds, specifically the removal of clearly erroneous records resulting from data entry errors (e.g. implausible trait values) rather than a statistical threshold. The number of records removed was negligible (approximately 30 per breed) compared to the total dataset.
The analysis-ready files were then prepared for subsequent analysis. Inbreeding coefficients were calculated for all chickens in the pedigree using the CFC software (Sargolzaei et al, 2006). The descriptive statistics of these coefficients were estimated based on the population of inbred chickens throughout the period, percentage in the total population and generation. Since considering the information of common ancestors and the complete pedigree is crucial in estimating inbreeding coefficients, the inbreeding coefficient was estimated based on all available data and kinship relationships in the pedigree. The annual rate of inbreeding change was calculated by fitting a linear regression of inbreeding on generation using SPSS software (IBM Corp, 2017).Regression coefficients of studied traits on inbreeding percentage were estimated by Wombat software (Mayer, 2007) and restricted maximum likelihood (REML) method using six different models. Inbreeding coefficient was also included as a covariate in the model. In this study, among the six statistical models considered for each trait, the final appropriate model for each of them was selected through three methods of likelihood ratio test (LRT), Akaike’s information criterion (AIC) and Bayesian information criterion (BIC). In the LRT test, the model with the highest log likelihood value was selected as the base model. Then, in order to evaluate the significant difference between the models, Q was estimated using the difference in log likelihood as follows (Lewis et al, 2011):
Q = 2(log LB - log LA)
Here, LA and LB are the likelihoods of the nested (studied) and full models, respectively. The value of LB must be larger than or equal to that of LA because model A is a special case of model B.
In this study, Q can adopt a chi-squared (χ2) distribution. The calculated Q value for all models was compared with the χ2 distribution. In general, the model with the highest log likelihood is selected as the most appropriate model, but if χ2 is significant, it is statistically superior to the other model. In the case where the difference between the models is not statistically significant (P < 0.05), the simplest model can be selected as the most appropriate model. In the second and third methods, the model with the minimum BIC (Schwarz, 1978) and AIC (Akaike, 1974) was selected as the most appropriate model. The AIC and Bayesian information indices were calculated as follows (Fischer et al, 2004):
AIC = −2 (Log L) + 2p
BIC = −2 (Log L) + p*Log (N – r(X))
Log L is the log likelihood, p is the number of model parameters, N is the number of records, and (r)X is the rank of the matrix X.
In this study, regression coefficients of studied traits on inbreeding percentage were estimated based on the appropriate model. The models used in this study were as follows:
- y = Xb + Z1a + e
- y = Xb + Z1a + Z3c + e
- y = Xb + Z1a + Z2m + e Cov (a,m) = 0
- y = Xb + Z1a + Z2m + e Cov (a,m) ≠ 0
- y = Xb + Z1a + Z2m + Z3c + e Cov (a,m) = 0
- y = Xb + Z1a + Z2m + Z3c + e Cov (a,m) ≠ 0
where y: observations vector; X: incidence matrix that relate observations to the fixed effects of model; b: the vector of fixed effects and associated variables (including the fixed effects generation-hatch for all traits, and also sex effect for the BW1, BW8 and BW12 traits, and auxiliary variable: number of recording days for egg number); Z1: incidence matrix that relate observations to the direct additive genetic effects of model; a: vector with direct genetic effects; e: vector of residual effects; Z3: incidence matrix that relate observations to the maternal common environmental effects; c: vector of maternal common environmental effects; Z2: incidence matrix that relate observations to the maternal additive genetic effects of model; m: vector of maternal additive genetic effects; and Cov (a,m): covariance of direct and maternal additive genetic effects.
Results and discussion
In this study, the effectiveness of the selection process in the national breeding programme for ICs was evaluated by examining the extent of inbreeding and the resulting regression effects on some economic traits in ICBCs, using pedigree data from more than 400,000 ICs. The analysis of pedigree across the centres indicated that 61.6% of the ICs in Fars, 55.7% in Khorasan Razavi, 71.8% in Mazandaran, 78.8% in Esfahan, 78.5% in Yazd, and 88.7% in West Azerbaijan were found to be inbred. The average inbreeding coefficient varied from 2.2% in Fars to 6.3% in West Azerbaijan (Table 2).
Table 2. Changes in the average inbreeding rates across generations. F, inbreeding coefficient; ge, average number of discrete generation equivalents.
|
Indigenous chicken breeding centres (ICBCs) |
Generation |
|||||||||||
|
Khorasan Razavi |
Yazd |
West Azerbaijan |
Esfahan |
Fars |
Mazandaran |
|||||||
|
(ge) |
F |
(ge) |
F |
(ge) |
F |
(ge) |
F |
(ge) |
F |
(ge) |
F |
|
|
1 |
0 |
- |
- |
0.5 |
0 |
0.5 |
0 |
1 |
0 |
0.96 |
0 |
1 |
|
2 |
0 |
1 |
0 |
0.74 |
0 |
0.61 |
0 |
1.49 |
0 |
1.47 |
0 |
2 |
|
3 |
0.001 |
1.99 |
0.005 |
1.70 |
0 |
0.82 |
0 |
1.75 |
0 |
1.74 |
0 |
3 |
|
4 |
0.005 |
2.98 |
0.009 |
2.63 |
0.004 |
0.53 |
0 |
1.14 |
0 |
1.81 |
0 |
4 |
|
5 |
0.006 |
3.99 |
0.010 |
3.45 |
0.004 |
1.05 |
0 |
2.11 |
0 |
1.90 |
0 |
5 |
|
6 |
0.016 |
4.97 |
0.005 |
4.23 |
0.004 |
2.06 |
0.001 |
2.05 |
0 |
2.91 |
0.001 |
6 |
|
6.9 |
0.018 |
5.98 |
0.024 |
5.15 |
0.031 |
3.06 |
0.005 |
3.05 |
0.001 |
3.58 |
0.004 |
7 |
|
8 |
0.020 |
6.96 |
0.015 |
6.20 |
0.042 |
4.07 |
0.002 |
4.03 |
0.002 |
3.73 |
0.003 |
8 |
|
9 |
0.026 |
7.96 |
0.023 |
7.17 |
0.032 |
5.07 |
0.012 |
5.02 |
0.007 |
4.56 |
0.004 |
9 |
|
10 |
0.037 |
8.97 |
0.030 |
8.17 |
0.046 |
6.07 |
0.019 |
5.99 |
0.012 |
5.76 |
0.008 |
10 |
|
10.99 |
0.050 |
9.97 |
0.040 |
9.05 |
0.050 |
7.08 |
0.029 |
6.98 |
0.027 |
6.66 |
0.006 |
11 |
|
12 |
0.058 |
10.97 |
0.049 |
9.95 |
0.055 |
8.07 |
0.030 |
7.88 |
0.035 |
7.72 |
0.029 |
12 |
|
- |
- |
11.97 |
0.053 |
10.72 |
0.068 |
9.01 |
0.039 |
5.89 |
0.011 |
8.71 |
0.030 |
13 |
|
- |
- |
12.97 |
0.058 |
11.59 |
0.060 |
10.04 |
0.045 |
7.12 |
0.024 |
9.74 |
0.050 |
14 |
|
- |
- |
13.97 |
0.067 |
12.46 |
0.065 |
11.07 |
0.055 |
8.08 |
0.020 |
10.75 |
0.051 |
15 |
|
- |
- |
- |
- |
13.16 |
0.068 |
12.07 |
0.064 |
9.05 |
0.022 |
11.75 |
0.053 |
16 |
|
- |
- |
- |
- |
14.14 |
0.080 |
13.07 |
0.075 |
10.05 |
0.036 |
12.76 |
0.054 |
17 |
|
- |
- |
- |
- |
15.19 |
0.089 |
14.07 |
0.081 |
11.06 |
0.031 |
13.75 |
0.079 |
18 |
|
- |
- |
- |
- |
16.16 |
0.096 |
15.07 |
0.093 |
12.07 |
0.034 |
14.76 |
0.068 |
19 |
|
- |
- |
- |
- |
17.16 |
0.119 |
16.07 |
0.098 |
13.06 |
0.041 |
15.68 |
0.077 |
20 |
|
- |
- |
- |
- |
17.97 |
0.128 |
17.07 |
0.114 |
14.06 |
0.049 |
16.76 |
0.089 |
21 |
|
- |
- |
- |
- |
- |
- |
- |
- |
15.07 |
0.051 |
17.76 |
0.097 |
22 |
|
- |
- |
- |
- |
- |
- |
- |
- |
16.06 |
0.058 |
18.76 |
0.108 |
23 |
|
- |
- |
- |
- |
- |
- |
- |
- |
17.06 |
0.061 |
19.76 |
0.116 |
24 |
|
- |
- |
- |
- |
- |
- |
- |
- |
18.07 |
0.067 |
20.76 |
0.123 |
25 |
|
- |
- |
- |
- |
- |
- |
- |
- |
- |
- |
21.76 |
0.141 |
26 |
|
5.61 |
0.016 |
7.74 |
0.029 |
10.65 |
0.063 |
8.77 |
0.043 |
7.57 |
0.022 |
9.52 |
0.043 |
Average |
|
0.028 |
0.037 |
0.071 |
0.055 |
0.036 |
0.059 |
Average inbreeding coefficients in the inbreds |
||||||
Overall, in the populations examined, the number of inbred chickens was significant; however, the level of inbreeding was assessed to be below 10%, except in the most recent generations, where it exceeded 10%. The number of chickens with low inbreeding in these centres may be linked to inadequate data regarding parents or the execution of controlled matings within the population. In general, the frequency of inbred chickens with an inbreeding coefficient that exceeded 15% remained low across all centres. Close matings may be regarded as a potential factor contributing to the increased inbreeding coefficients.
The findings indicate that the inbreeding rate is increasing by less than 1% across the centres. Specifically, the average inbreeding rate is approximately 0.6% in Esfahan, West Azerbaijan, and Mazandaran; about 0.5% in Yazd and Khorasan Razavi; and around 0.3% in Fars. In an earlier study focused on Thai native chickens, the authors found that the inbreeding coefficient increased by 0.09% each year. They emphasized that this degree of inbreeding, at 0.09% per generation, falls within the commonly accepted threshold, which is typically regarded as approximately 1% per generation (Tongsiri et al, 2019). According to Nicholas (1989), the inbreeding rates of up to 0.5% per year should be acceptable in animal breeding programmes, since this results in a coefficient of variation in selection response of < 10% during the course of a 10-year selection period. A previous study estimated the inbreeding rate of Kokok Balenggek Chickens (KBC) under ex situ conservation as 0.31%. It was concluded that since the inbreeding rate was less than 1% – which implies that 1% of heterozygosity is lost per generation – the population is not at risk of extinction (Rusfidra et al, 2014). According to Weigel (2001), although the maintenance of genetic diversity and the preservation of selection response in future generations are vital for breeding programmes, the main effect of inbreeding at the farm level is inbreeding depression. Based on the estimated inbreeding rates in this study, the populations will retain their capacity to respond to selection in the future. Our results suggest that inbreeding rates are at a favourable level and selection has not adversely affected genetic diversity in Iranian ICBCs. This fact was also supported by genetic improvements made in the studied traits (Jelokhani-Niaraki and Ghorbani, in press). Nonetheless, this minimal level of inbreeding could potentially lead to a decline in the performance of traits.
Figure 1 depicts the trend of increased inbreeding across centres.
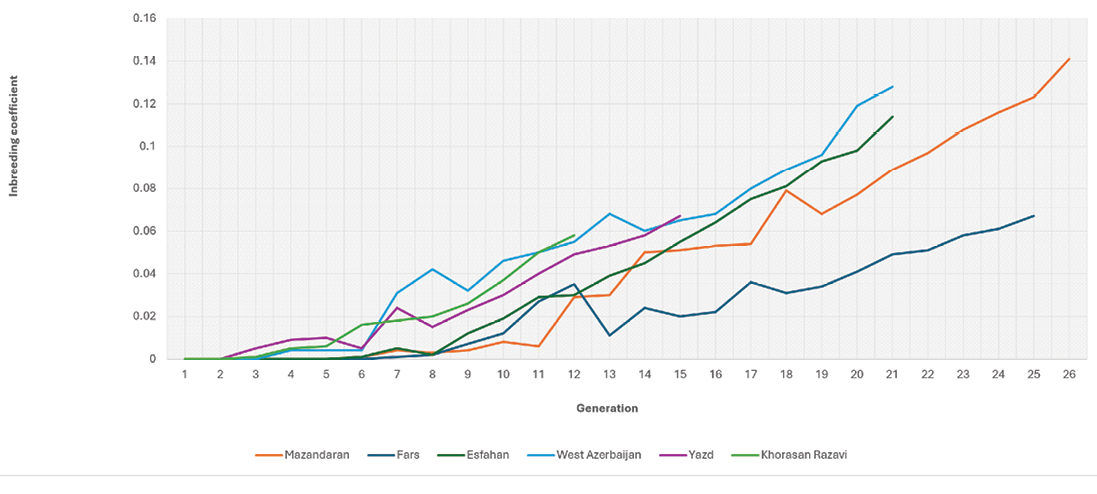
The inbreeding trend in all centres was almost identical. Although the studied populations are under genetic selection and closed, the populations in all centres exhibit a low inbreeding rate during first generations, which gradually increases with a gentle slope, ultimately reaching the highest inbreeding rates in the final generations. In the initial generations, the inbreeding rate was estimated to be zero, which may be attributed to the uncertainty surrounding pedigree information from those early generations. From another viewpoint, a pedigree with numerous unknown parents also contains several unknown common ancestors, and the obscurity of these common ancestors might be interpreted as their exclusion from the pedigree. Various studies have indicated that the accurate estimation of inbreeding is highly dependent on pedigree information. To accurately estimate the inbreeding coefficient in a population, two factors are particularly important: the completeness of the pedigree records and the careful control of mating. It has been observed that the amount of pedigree information used for estimating inbreeding has a direct effect on the inbreeding depression estimates. The increase in inbreeding is due to the fact that animals with similar breeding values are more likely to be related compared to those with different breeding values (Quinton et al, 1992; Miglior et al, 1995). According to a prior study regarding the effect of incomplete pedigrees on the estimates of inbreeding and inbreeding depression in Holstein and Jersey cows, the authors discovered that partial pedigrees result in a reduction of the average inbreeding estimate and the variance of these estimates within the groups of cows (Cassell et al, 2003). When attempting to perform a regression analysis of a response variable against inbreeding estimates derived from partial pedigrees, the resulting estimate of inbreeding depression may not correspond with that derived from complete pedigrees. It is logical to expect that a more comprehensive pedigree dataset will yield more precise assessments of inbreeding depression; however, various factors such as the precision of pedigree and phenotypic data, the size of datasets, statistical methods employed, and the models used will affect this result (Cassell et al, 2003). Besides the quality of the pedigree, the depth of the pedigree also plays a crucial role in more precisely estimating the inbreeding coefficient within the population. One method to assess and analyze the depth of the pedigree is to estimate the average number of discrete generation equivalents or the average number of generations known (ge). In our study, the assessment of this parameter revealed that the quality of the pedigree data in the ICBCs is satisfactory, and the inbreeding coefficients are estimated with a high degree of accuracy (Table 2).
To improve the accuracy of the most fitting model for predicting the breeding values of each trait, three different methodologies (LRT, AIC and BIC) were utilized. The findings from all centres indicated that there was no noticeable difference between the approaches used to select the most appropriate model for each trait. In a study that compared Legendre and B-spline random regression models for estimating the variance components of average birth weight in lambs per lambing in Mehraban sheep, the authors found that both AIC and BIC methods identified the model incorporating quadratic, linear, and quadratic B-spline fitted for random regressions and fixed regression, respectively, as the most appropriate model (Zamani et al, 2015). In another study regarding the modelling and fitting the growth curve model for Japanese quail under various nutritional conditions, the authors utilized both methods to fit three separate nonlinear growth models including Bertalanffy, Gompertz and Logistic. Their results revealed that both AIC and BIC methods identified the Logistic model as the most appropriate model (Dudusola et al, 2019).
The analysis of the regression coefficient of inbreeding on the traits revealed that the influence of inbreeding depression was low for most of the traits analyzed (Table 3).
Table 3. Regression coefficients of studied traits on inbreeding percentage. BW1, body weight at 1 day of age; BW8, body weight at 8 weeks of age; BW12, body weight at 12 weeks of age; ASM, age at sexual maturity; WSM, weight at sexual maturity; EN, egg number; EW1, egg weight at first day of laying and AEW, average egg weight at 28th, 30th and 32nd weeks. Significance level: p < 0.01. All regression coefficients reported in the table are statistically significant.
|
Indigenous chicken breeding centres (ICBCs) |
Traits |
|||||
|
Khorasan Razavi |
Yazd |
West Azerbaijan |
Esfahan |
Fars |
Mazandaran |
|
|
-0.04 |
0.0003 |
-0.04 |
-0.008 |
0.02 |
0.02 |
BW1 |
|
-0.51 |
-0.69 |
-1.52 |
-2.52 |
-1.07 |
-1.32 |
BW8 |
|
-1.17 |
-1.53 |
-2.49 |
-3.51 |
-2.14 |
-2.04 |
BW12 |
|
0.19 |
0.16 |
0.12 |
0.23 |
0.38 |
0.31 |
ASM |
|
1.05 |
-2.27 |
-1.22 |
-3.97 |
0.27 |
-0.11 |
WSM |
|
0.08 |
-0.14 |
-0.01 |
-0.13 |
-0.07 |
-0.18 |
EN |
|
-0.05 |
-0.05 |
-0.01 |
0.06 |
0.08 |
0.03 |
EW1 |
|
-0.02 |
-0.05 |
-0.02 |
0.02 |
-0.01 |
-0.03 |
AEW |
Although inbreeding typically results in decreased fitness, the extent and specific effects of inbreeding can fluctuate considerably, influenced by the genetic makeup of the species or populations and their interactions with the environment (Hedrick and Kalinowski, 2000). In the present study, the significant effect of inbreeding on BW12 was found throughout all centres. This effect varied from -1.53 in Yazd to -3.51 in Esfahan. These values indicate that for each 1% rise in inbreeding, BW12 decreases by 1.53g in the Yazd population and by 3.51g in the Esfahan population. A negative trend was similarly identified for BW8, where every 1% increase in inbreeding leads to a reduction from 0.51g in the Khorasan Razavi population to 2.52g in the Esfahan population. The findings concerning ASM were largely consistent across all centres, indicating that for each 1% increase in inbreeding, ASM rises from 0.12 days in West Azerbaijan to 0.38 days in Fars. The findings from some studies regarding the effect of increased inbreeding on the ASM indicate that these effects differ across breeds. For example, in the Leghorn breed, increased inbreeding results in a rise in the ASM (Sewalem et al, 1999), whereas in the New Hampshire strain, it causes a decline in the ASM (Szwaczkowski et al, 2003). The results showed that the effects of inbreeding on egg-related traits, including the number of eggs, weight of the first egg, and average weight of eggs, were minimal. A study investigating the effects of inbreeding depression on body weight traits, average egg weight, age at first lay, and the percentage of fertile eggs in laying hen strains revealed minor effects (Szwaczkowski et al, 2004). In another study on native Thai chickens, the findings indicated that inbreeding had no effect on body weight traits, with the exception of the BW1 trait (Tongsiri et al, 2019). Ameli et al (1991) conducted a study on the cumulative inbreeding effects in commercial White Leghorn populations subjected to long-term reciprocal recurrent selection. After 23 generations, their findings revealed an annual inbreeding coefficient increase of 0.7% when full- and half-sibling matings were avoided. This progressive inbreeding was associated with a decline in egg production of three eggs annually. Additionally, another investigation examined the inbreeding depression associated with a 10% rise in inbreeding for different Leghorn lines and egg traits, including egg number, egg weight and egg mass weight. The values of inbreeding depression were found to be lower than the annual genetic progress values (Savas et al, 1999). A study performed on strains of white egg layers with the objective of evaluating the response to selection for fertility and hatchability, as well as the influence of inbreeding on these traits, demonstrated that inbreeding depression was not evident for any of the traits. This finding indicates that the selection offsets any adverse effects of inbreeding (Schmidt and Figueiredo, 2005). In cases where inbreeding does not rise too quickly, some evidences show that the resulting depression effect may be diminished through selection (Schmidt and Figueiredo, 2005; Gowe et al, 1993).
Conclusion
The findings from the pedigree analysis indicate that the inbreeding levels within the ICBCs are rising at a relatively gentle rate and remain within an acceptable range. Given the genetic improvements made in all six breeds, the inbreeding levels in these populations have been effectively managed, and it has not adversely affected the genetic progress of the population. As maintaining genetic diversity and minimizing inbreeding in the ICBCs is crucial for the success of breeding programmes, it can be inferred that the strategies for mating and the selection of superior chickens have been effectively implemented over the generations.
Acknowledgements
The authors would like to acknowledge the Deputy of Animal Production Affairs in the Ministry of Agriculture-Jahad for the financial support, as well as the indigenous chicken breeding centres for their contribution to data collection.
Author contributions
Saber Jelokhani-Niaraki: original draft preparation, writing, review and editing. Sholeh Ghorbani: methodology, investigation, data analysis, project administration, writing, review and editing.
Conflict of interest statement
The authors declare no conflict of interest.
Ethics statement
This study did not require review or approval by an ethics committee.
References
Akaike, H. (١٩٧٤). A new look at the statistical model identification. IEEE Transactions on Automatic Control ١٩, ٧١٦-٧٢٣. doi: https://doi.org/10.1109/TAC.1974.1100705
Ameli, H., Flock, D. K., Glodek, P. (1991). Cumulative inbreeding in commercial White Leghorn lines under long-term reciprocal recurrent selection. Br. Poult. Sci ٣٢, ٤٣٩-٤٤٩. doi: https://doi.org/10.1080/00071669108417369
Barros, E. A., Brasil, L. D., Tejero, J. P., Delgado-Bermejo, J. V., Ribeiro, M. N. (2017). Population structure and genetic variability of the Segureña sheep breed through pedigree analysis and inbreeding effects on growth traits. Small. Rumin. Res ١٤٩, ١٢٨-١٣٣. doi: https://doi.org/10.1016/j.smallrumres.2017.02.009
Buranawit, K., Imboonta, N., Tongsiri, S., Masuda, Y., Phakdeedindan, P. (2025). Investigation of the effect of heat stress on egg production traits in Thai native chickens (Lueng Hang Kao Kabin) as determined by the temperature-humidity index. Poult. Sci ١٩, ١٠٥١٩٦. doi: https://doi.org/10.1016/j.psj.2025.105196
Cassell, B. G., Adamec, V., Pearson, R. E. (2003). Effect of incomplete pedigrees on estimates of inbreeding and inbreeding depression for days to first service and summit milk yield in Holsteins and Jerseys. J. Dairy. Sci ٨٦, ٢٩٦٧-٢٩٧٦. doi: https://doi.org/10.3168/jds.S0022-0302(03)73894-6
D’ambrosio, J., Phocas, F., Haffray, P., Bestin, A., Brard-Fudulea, S., Poncet, C., Quillet, E., Dechamp, N., Fraslin, C., Charles, M., Dupont-Nivet, M. (2019). Genome-wide estimates of genetic diversity, inbreeding and effective size of experimental and commercial rainbow trout lines undergoing selective breeding. Genet. Sel. Evol ٥١, ١-١٥. doi: https://doi.org/10.1186/s12711-019-0468-4
Desta, T. T., Dessie, T., Bettridge, J., Lynch, S. E., Melese, K., Collins, M., Christley, R. M., Wigley, P., Kaiser, P., Terfa, Z., Mwacharo, J. M. (2013). Signature of artificial selection and ecological landscape on morphological structures of Ethiopian village chickens. Animal. Genetic. Resources ٥٢, ١٧-٢٩. doi: https://doi.org/10.1017/s2078633613000064
Dudusola, I. O., Oseni, S. O., Adeyemi, E. A. (2019). Modeling the growth curve of Japanese Quail under different nutritional environments. Niger. J. Anim. Sci ٢١, ٥٣-٥٨.
Fischer, T. M., Van der Werf, J. H. J., Banks, R. G., Ball, A. J. (2004). Description of lamb growth using random regression on field data. Livest. Prod. Sci 89, 175-185. doi: https://doi.org/10.1016/j.livprodsci.2004.02.004
Gowe, R. S., Fairfull, R. W., McMillan, I., Schmidt, G. S. (1993). A strategy for maintaining high fertility and hatchability in a multiple-trait egg stock selection program. Poult. Sci 72, 1433-1448. doi: https://doi.org/10.3382/ps.0721433
Harrison, S. (2017). Evaluating long-term direct and correlated selection response in White Plymouth Rock chickens selected for high or low 8-week body weight. MS.c thesis, University of Nebraska, Lincoln.
Hedrick, P. W., Kalinowski, S. T. (2000). Inbreeding depression in conservation biology. Annu. Rev. Ecol. Syst 31, 139-162. doi: https://doi.org/10.1146/annurev.ecolsys.31.1.139
IBM Corp. (2017). IBM SPSS Statistics for Windows, Version 25.0 [Computer software]. Armonk, NY: IBM Corp.
Jaturasitha, S., Kayan, A., Wicke, M. (2008). Carcass and meat characteristics of male chickens between Thai indigenous compared with improved layer breeds and their crossbred. Arch. Anim. Breed 51, 283-294. doi: https://doi.org/10.5194/AAB-51-283-2008
Jelokhani-Niaraki, S., Ghorbani, S., Esmailkhanian, S. (2021). Estimation of inbreeding depression for economic traits in Esfahan improved native chicken population. J. Anim. Pro 23, 313-324. doi: https://doi.org/10.22059/jap.2021.314496.623576
Jelokhani-Niaraki, S., Ghorbani, S. (in press). Evaluating the effectiveness of the long-term selective breeding program for indigenous chicken breeds. Acta Sci. Anim. Sci.
Lawal, R. A., Al-Atiyat, R. M., Aljumaah, R. S., Silva, P., Mwacharo, J. M., Hanotte, O. (2018). Whole-genome resequencing of red jungle fowl and indigenous village chicken reveal new insights on the genome dynamics of the species. Front. Genet 9: 264. doi: https://doi.org/10.3389/fgene.2018.00264
Lawal, R. A., Hanotte, O. (2021). Domestic chicken diversity: Origin, distribution, and adaptation. Anim. Genet 52, 385-394. doi: https://doi.org/10.1111/age.13091
Lewis, F., Butler, A., Gilbert, L. (2011). A unified approach to model selection using the likelihood ratio test. Methods. Ecol. Evol 2, 155-162. doi: https://doi.org/10.1111/j.2041-210X.2010.00063.x
Magothe, T. M., Okeno, T. O., Muhuyi, W. B., Kahi, A. K. (2012). Indigenous chicken production in Kenya: II. Prospects for research and development. World's. Poult. Sci. J 68, 133-144. doi: https://doi.org/10.1017/S004393391200013X
Meyer, K. (2007). WOMBAT, A tool for mixed model analyses in quantitative genetics by REML. J. Zhejiang. Univ. Sci. B 8, 815-821. doi: https://doi.org/10.1631/jzus.2007.B0815
Miglior, F., Burnside, E. B., Dekkers, J. C. (1995). Nonadditive genetic effects and inbreeding depression for somatic cell counts of Holstein cattle. J. Dairy. Sci 78, 1168-1173. doi: https://doi.org/10.3168/jds.S0022-0302(95)76734-0
Milkias, M., Molla, M., Tilahun, S. (2019). Productive and reproductive performance of indigenous chickens in Gena Bossa District of Dawro Zone, Ethiopia. Int. J. Livest. Prod 10, 24-32. doi: https://doi.org/10.5897/IJLP2018.0551
Nicholas, F.W. (١٩٨٩). Incorporation of new reproductive technology in genetic improvement program. In Evolution and Animal Breeding. ed. Hill WG and Mackay TFC (Wallingford: CAB International). 203-209.
Padhi, M. K. (2016). Importance of indigenous breeds of chicken for rural economy and their improvements for higher production performance. Scientifica (Cairo) 2604685. doi: https://doi.org/10.1155/2016/2604685
Quinton, M., Smith, C., Goddard, M. E. (1992). Comparison of selection methods at the same level of inbreeding. J. Anim. Sci 70: 1060-1067. doi: https://doi.org/10.2527/1992.7041060x
Radwan, L. M. (2020). Genetic improvement of egg laying traits in Fayoumi chickens bred under conditions of heat stress through selection and gene expression studies. J. Therm. Biol 89, 102546. doi: https://doi.org/10.1016/j.jtherbio.2020.102546
Rusfidra., Tan Marajo, S. D., Heryandi, Y., Oktaveriza, B. (2014). Estimation of inbreeding rate in Kokok Balenggek Chicken (KBC) population under ex-situ conservation. Int. J. Poult. Sci 13, 364-367. doi: https://doi.org/10.3923/ijps.2014.364.367
Sargolzaei, M., Iwaisaki, H., Colleau, J. J. (2006). A tool for monitoring genetic diversity. In proceedings of the 8th World Congress Genetics Applied Livestock, ProBelo Horizonte
Savas, T., Preisinger, R., Röhe, R., Kalm, E., Flock, D. K. (1999). Auswirkungen der Inzucht auf Leistungsmerkmale und deren genetische Parameter bei Legehennen. Arch. Fur. Geflugelkd 63, 246-251.
Schmidt, G. S., Figueiredo, E. A. P. (2005). Selection for reproductive traits in white egg stock using independent culling levels. Braz. J. Poult. Sci 7, 231-235.
Schwarz, G. (1978). Estimating the dimension of a model. Ann. Stat ٦, ٤٦١-٤٦٤. doi: https://doi.org/10.1214/aos/1176344136
Selvaggi, M., Dario, C., Peretti, V., Ciotola, F., Carnicella, D., Dario, M. (2010). Inbreeding depression in Leccese sheep. Small. Rumin. Res 89, 42-46. doi: https://doi.org/10.1016/j.smallrumres.2009.12.005
Sewalem, A., Johansson, K., Wilhelmson, M., Lillpers, K. (1999). Inbreeding and inbreeding depression on reproduction and production traits of White Leghorn lines selected for egg production traits. Br. Poult. Sci 40, 203-208. doi: https://doi.org/10.1080/00071669987601
Siebenmorgen, C., Mörlein, J., Strack, M., Tetens, J., Mörlein, D. (2024). Enhancing agro-biodiversity in chicken: a sensory comparison of broths from German local chicken breeds and their crossbreeds. Poult. Sci 103, 103683. doi: https://doi.org/10.1016/j.psj.2024.103683
Stefanetti, V., Mancinelli, A. C., Pascucci, L., Menchetti, L., Castellini, C., Mugnai, C., Fiorilla, E., Miniscalco, B., Chiattelli, D., Franciosini, M. P., Proietti, P. C. (2023). Effect of rearing systems on immune status, stress parameters, intestinal morphology, and mortality in conventional and local chicken breeds. Poult. Sci 102, 103110. doi: https://doi.org/10.1016/j.psj.2023.103110
Szalay, I. T., Lan Phuong, T. N., Barta, I., Bodi, L., Emodi, A., Szentes, K. A., Dong Xuan, K. D. T. (2016). Conservation aspects of meat producing ability and heterosis in crosses of two natively different local Hungarian chicken breeds. Int. J. Poult. Sci 15, 442-447. doi: https://doi.org/10.3923/ijps.2016.442.447
Szwaczkowski, T., Cywa-Benko, K., Wezyk, S. (2003). A note on inbreeding effect on productive and reproductive traits in laying hens. Anim. Sci. Pap. Rep 21, 121-129.
Szwaczkowski, T., Cywa-Benko, K., Wezyk, S. (2004). Curvilinear inbreeding effects on some performance traits in laying hens. J. Appl. Genet 45, 343-345.
Tolone, M., Sardina, M. T., Criscione, A., Lasagna, E., Senczuk, G., Rizzuto, I., Riggio, S., Moscarelli, A., Macaluso, V., Di Gerlando, R., Cassandro, M., Portolano, B., Mastrangelo, S. (2023). High-density single nucleotide polymorphism markers reveal the population structure of 2 local chicken genetic resources. Poult. Sci 102, 102692. doi: https://doi.org/10.1016/j.psj.2023.102692
Tongsiri, S., Jeyaruban, G. M., Hermesch, S., Van Der Werf, J. H. J., Li, L., Chormai, T. (2019). Genetic parameters and inbreeding effects for production traits of Thai native chickens. Asian-Australas. J. Anim. Sci 32, 930-938. doi: https://doi.org/10.5713/ajas.18.0690
Van Wyk, J. B., Fair, M. D., Cloete, S. W. P. (2009). Case study: the effect of inbreeding on the production and reproduction traits in the Elsenburg Dormer sheep stud. Livest. Sci 120, 218-224. doi: https://doi.org/10.1016/j.livsci.2006.10.005
Weigel, K. A. (2001). Controlling inbreeding in modern breeding programs. J. Dairy. Sci 84, E177-184. doi: https://doi.org/10.3168/jds.S0022-0302(01)70213-5
Yadav, A., Jain, A., Sahu, J., Dubey, A., Gadpayle, R., Barwa, D. K., Kumar, V. (2019). A review on the concept of inbreeding and its impact on livestock. Int. J. Fauna. Biol. Stud 6, 23-30.
Zamani, P., Amirabadi-Farahani, M., Aliarabi, H., Malecky, M. (2016). Comparison of different Legendre and B-Spline random regression models to estimate variance components for average birth weight per lambing in Mehraban sheep. Iran. J. Anim. Sci 46, 407-415. doi: https://doi.org/10.22059/ijas.2015.56826