Growth performance and immune response to Newcastle disease in four gene pools of indigenous chicken in Rwanda
Abstract
In Rwanda, the most prevalent livestock farming activity carried out to improve livelihoods in rural areas is poultry farming. The most common bird species raised for egg and meat production is indigenous chicken (IC). Despite its economic significance, the improvement programs in Rwanda have given IC little attention. There is, therefore, little documentation on their production and disease resistance performance. This study aimed at evaluating the growth performance and immunologic response of IC against Newcastle disease vaccine in four gene pools in Rwanda. One hundred eighty-nine (189) IC from four gene pools were kept on-station using a completely randomized design. Thereafter, the IC were vaccinated with a live commercial Newcastle disease virus. Data on body weight were collected weekly for 20 weeks whereas serum samples were collected after 35 days. Antibody responses were determined using indirect ELISA. Analysis of variance was performed using the SAS Generalised Linear Model procedure. Growth patterns were modelled using the logistic function. Results revealed a highly significant difference (P<0.001) for growth performance and antibody response to Newcastle disease vaccine among the four gene pools. Gene pool A was the heaviest (1.6 kg) in the period of 20 weeks and gene pool C expressed the highest immune response (8,161 antibody titres) for Newcastle disease vaccine (P<0.001). The results indicated that the selection of gene pool A in breeding could yield IC with good growth performance trait whilst gene pool C could be selected for its higher immunity against Newcastle disease virus.
Keywords
Body weight, indigenous chicken, antibody, Newcastle disease
Author contributions
All authors contributed to the study conception and design. Material preparation, data collection and analysis were performed by RH, KN, AS, MN, JM, CAH, AI, LK, FG and TOO. The first draft of the manuscript was written by RH and all authors commented on previous versions of the manuscript. All authors read and approved the final manuscript.
Introduction
Indigenous chicken (IC) contribute considerably to the rural farmers' livelihood by providing excellent animal protein (Gebreselassie et al., 2015). Though these birds are predominant in most Rwanda households, their production and genetic potential have not been fully exploited (Padhi, 2016). Low genetic potential and high occurrence of diseases like Newcastle disease (ND) are among the main features affecting IC productivity in the tropics (Lwelamira & Katule, 2005). Despite their low egg productivity and growth rate (Mbuza, Denis, Janvier, & Xavier, 2016), they have a prodigious potential to improve rural livelihoods (Ministry of Agriculture and Animal Resources (MINAGRI), 2012).
Growth identified as an increase in weight, length and height with age (Aggrey, 2002; Yang et al., 2006) is very significant in any IC production systems. An improvement in this trait is expected to have a countless positive impact on farmers livelihoods (Magothe, Muhuyi, & Kahi, 2010). Several mathematical functions are used to describe growth and provide biologically interpretable parameters. In order to estimate the growth of chicken, growth models coupled with fitted longitudinal experimental data are used. The most growth models frequently used are nonlinear functions (Hyánková, Knížetová, Dědková, & Hort, 2001; Karkach, 2006; Mignon-Grasteau & Beaumont, 2000; Ndri, Koua, Ahouchi, & AdepoGourene, 2018). The nonlinear models have been utilized because of their several advantages, which include describing weight per age (Hyánková et al., 2001), and estimating the association between body weight and feed requirement (Fiengül & Kiraz, 2005). The growth curve parameters determined by the nonlinear models are used to decide the appropriate age whereat to select chicken and to design management approaches for breeding (Fiengül et al., 2005).
Growth performance is influenced by genes and management practises, especially nutrition and health (Dana, Dessie, Waaij, & Arendonk, 2010; Gondwe & Wollny, 2005; Mwalusanya et al., 2002). Newcastle disease (ND) is among the most severe problems encumbering IC growth performance in Rwanda (Mazimpaka, Tukei, Shyaka, & Gatari, 2018). Newcastle disease, which affects many bird’s species globally is brought about by single-strand, non-segmented, negative-sense RNA virus also called Avian paramyxovirus 1 (APMV-1) (Cattoli, Susta, Terregino, & Brown, 2011). This disease is an issue of great concern to the farmers because its outbreak can cause a high economic loss of up to 100% flock mortality. Newcastle disease has no effective cure. The spread of this virus is, however, contained by appropriate management strategies such as vaccination (Alexander, 2001). The possibility of eradicating this avian disease currently is completely questionable. This is because pathogen virulence, which renders the vaccine ineffective increases with time. Consequently, requiring new vaccines to be developed (Witter, 1998). Although new vaccines lessen ND epidemics, frequent research to develop the vaccine makes the strategy expensive. Breeding using indirect selection for the development of immunological response trait is, therefore, the best long-term strategy for mitigating diseases (Gavora, Spencer, & J, 1983); in this case, immune response trait will be used to develop IC breeds with a high-level of biosecurity (Padhi, 2016).
Although body weight and disease tolerance are the highly preferred traits by poultry farmers (Banerjee, 2012), in Rwanda there is no established structure for breeding programmes, nor for genetic improvement, nor for conservation (Mahoro, Muasya, Mbuza, Mbuthia, & Kahi, 2018). In an effort to improve genetic potential through within breed selection of IC in Rwanda (Shapiro, Gebru, Desta, & Nigussie, 2017), preliminary studies have been conducted (Habimana et al., 2020; Hirwa et al., 2019; Mahoro, Muasya, Mbuza, Habimana, & Kahi, 2017; Mbuza et al., 2016). Research on the morphological characterisation of IC ecotypes showed a very huge variation among IC in Rwanda (Hirwa et al., 2019). Subsequently, a study on genetic diversity and population structure unveiled the presence of four different gene pools among IC in Rwanda (Habimana et al., 2020). There is, however, no information on the diversity in growth performance and immune responses to ND among those four gene pools. Availability of such information would be necessary for designing breeding strategies for increased IC productivity in Rwanda. Increasing IC performance would contribute towards improved food security and secure livelihoods. This study aimed at evaluating the growth performance and ND immunity of IC among four gene pools in Rwanda.
Materials and methods
Ethical approval
This study was conducted in line with the principles of the Declaration of Helsinki. Approval was granted by the Research Screening and Ethical Clearance Committee of the College of Agriculture, Animal Sciences and Veterinary Medicine, University of Rwanda (Ref: 031/19/DRI September 2, 2019).
Study sites
The study was carried out on-station at the University of Rwanda-Nyagatare campus in Nyagatare district, Rwanda. The coordinates of the area of study are 1° 18' 0.00"S, 30° 19' 30.00"E (Latitude: -1.3000; Longitude: 30.3250). The location of study is characterized by two main seasons: one long dry season that varies between 3 and 5 months with an annual average temperature varying between 25.3°C and 27.7°C. The monthly distribution of the rains varies from one year to another. Annual rainfalls are very low (827mm/year) and unpredictable to satisfy agriculture and livestock needs.
Study population
Indigenous chickens were selected from four gene pools previously identified (Habimana et al., 2018). These gene pools are distributed across the five agro-ecological zones in Rwanda, which are Central North and North West, South West, South West and Central South and East. The aforementioned gene pools were designated as letters A, B, C and D, respectively.
Sampling, data collection and management of experimental chicken
Seven hundred and twenty (720) fertile eggs were collected from four IC gene pools previously identified (Habimana et al., 2018) and only 707 eggs were viable to be incubated. Eggs were concurrently incubated but separated based on gene pool within the incubator (LDG-1200). After 21 days, 189-day old chicks were obtained from hatch (Table 1). Each chick was weighed, wing tagged with an identification number, and allocated into a house with four equal compartments (5m x 3m for each one). Brooding of chicks was done from hatching to week six (Ngeno, Bebe, & Kahi, 2010; Sayed, Ahmed, Alyousef, & M, 2016), in deep litter brooders containing infrared electric bulbs (230V, 250W). Initial brooding temperature, at the level of the chicks, was 36 to 35°C and reduced by approximately 2 to 3°C per week until 21°C was reached. The IC gene pools were reared in different brooders. All birds were kept under the same environmental conditions and management practices. Feeds were provided ad libitum on a starter diet (20% crude protein and 12.9 MJ ME /kg diet) for the first six weeks and a growing diet (16.8% crude protein and 12.5 MJ ME /kg diet) from the 7th to 20th week. Clean water was provided daily ad libitum. Disinfection of the brooding and rearing pens was done procedurally. The IC were then immunized with two commercial ND virus live vaccines, which were AVI ND HB1 in drinking water at 2 days of age and AVI ND Lasota (Intervet International B.V., Boxmeer, Netherlands) by eye drop at 28 days of age according to manufacturer’s instructions. At 7 days after the second immunization (35 days of age) as per the protocol outlined by (Al-Garib, Gielkens, Gruys, & Kochi, 2003), blood samples were collected without anticoagulant for separation of sera to detect the titre of antibody against ND vaccine. The Ab responses to ND were detected using indirect ELISA (ID Screen® Newcastle Nucleoprotein Indirect Version 2, IDvet, Grabels, FRANCE). The IDSoft™ data analysis programme was used to compute the Ab titres.
|
Gene pools |
Collected fertile eggs |
Incubated eggs |
Hatched eggs |
Chicks in brooder |
|---|---|---|---|---|
|
A |
180 |
179 |
72 |
72 |
|
B |
180 |
177 |
34 |
34 |
|
C |
180 |
175 |
36 |
36 |
|
D |
180 |
176 |
47 |
47 |
|
Total |
720 |
707 |
189 |
189 |
Data analysis
Descriptive statistics were generated using the SAS Generalised Linear Models procedure (SAS Institute, 2011). Body weights and Ab response were subjected to analysis of variance (ANOVA) with gene pools as the main variable in a completely randomized design and fixed effects model (Equation 1). For the analysis of body weight at hatch, egg weight was fitted in the model as a covariate, whereas in other ages; body weight at hatch was also fitted as a covariate. Tukey’s test was used for means separation between gene pools.
where: Yijk: record of kth chicken at particular age from ith gene pool with jth sex, μ: overall mean; Gi: fixed effect of ith gene pool; Sj: fixed effect of jth sex; (GS)ij: interaction between gene pool and sex; eijk: random error.
The analysis of longitudinal growth data was performed using non-linear regression. The following logistic regression model (Equation 2) using PROC NLIN of SAS (SAS Institute, 2011) was fitted to get growth curve parameters (a, b and k).
where: yt: live weight at age t, a: asymptotic or mature weight, b: scaling parameter, k: maturity index and t: age in weeks.
Results
Growth performance
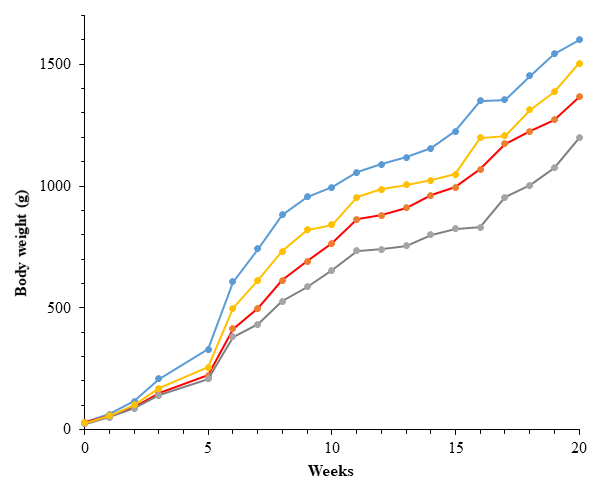
Body weights (BW) from hatch to 20 weeks of age among the four gene pools of IC in Rwanda are presented in Figure 1. The mean BW were significantly different (p < 0.001) across gene pools from week 0 to week 20. At hatch, gene pool A and B had the highest body weight (29.63±3.78 and 29.78±3.69g, respectively) and the lowest BW (24.29±3.39g) was recorded in gene pool C. At week one, Gene pool D and A exhibited higher BW (58.24±10.70 and 62.94±11.59g, respectively) followed by gene pool B (55.95±7.79g). At week 2, gene pool A showed the highest BW (116.32±27.73g) and gene pool C exhibited the lowest BW (87.51±24.06g). At week three, gene pool A showed the highest BW (208.19±56.16g) followed by gene pool D (170.69±43.43g) and the lowest BW was recorded in gene pool C (140.40±37.49g). During the remaining rearing period, the trend observed in week 3 was maintained.
The least-square means of the growth parameters (a, b and k), coefficient of determination (R2) are given in Table 2. The fitted parameters for the logistic model revealed a significant gene pool effect (P < 0.001) in the asymptotic weights (a), scaling parameter (b) and the maturity index (k). The lowest for these parameters were found for gene pool C.
|
Parameters |
Gene pools |
Overall |
P-value |
|||
|
A |
B |
C |
D |
|||
|
a |
1446.57±62.42 a |
1286.31±58.88 ab |
1086.38±66.64 b |
1350.13±69.16 a |
1309.46±59.82 |
0.000 |
|
b |
15.41±5.19 a |
16.33±4.13 a |
13.65±3.93b |
15.15±4.87 a |
15.02±4.41 |
|
|
k |
0.35±0.05 a |
0.30±0.04a |
0.29±0.04b |
0.32±0.05 a |
0.321±0.04 |
|
|
R2 |
0.96 |
0.97 |
0.96 |
0.96 |
0.96 |
|
Antibody titres for Newcastle disease vaccine
Antibody titres to Newcastle disease were statistically different (p < 0.001) across the gene pools. Gene pool C was found to be significantly higher in Ab titre for the ND virus vaccine (8,161). Lower Ab titre to ND vaccine was recorded in gene pool A (4,879) (Table 3).
|
Parameters |
Gene pools |
P-Value |
|||
|
A (n=56) |
B (n=33) |
C (n=35) |
D (n=46) |
||
|
Mean |
4,879a |
5,089a |
8,161b |
6,070c |
0.000 |
|
Minimum |
1,105 |
2,019 |
2,119 |
1,615 |
|
|
Maximum |
8,225 |
7,784 |
11,758 |
9,788 |
|
|
GMT |
4,428 a |
4,748 a |
7,742 b |
5,599 c |
|
|
CV |
39% |
35% |
28% |
37% |
|
Discussion
This experiment sought to evaluate diversity in growth performance and Ab response to ND among four different gene pools of IC in Rwanda.
Growth performance
This experiment compared the growth performance of four gene pools of IC in Rwanda. The results of this study showed the existence of a large variation in growth between the four IC gene pools in Rwanda. Growth is a quantitative trait that is influenced by genes and production environment such as health and nutrition (Dana et al., 2010; Gondwe et al., 2005; Mwalusanya et al., 2002). Since the IC were kept under the same environmental conditions in this study, the witnessed differences between the IC gene pools could result in genetic diversity among these IC populations. In addition to that, gene pool A and gene pool C are morphologically different (Hirwa et al., 2019). These results affirmed the previous study undertaken on IC genetic diversity and population structure using microsatellite markers in Rwanda (Habimana et al., 2020). The difference in growth performance of four gene pools is due to the difference in feed conversion efficiency (FCE), with heavier gene pool having higher FCE and perhaps due to smaller maintenance requirements (Tadelle, Kijora, & Peters, 2003). Feed conversion efficiency is normally influenced by the climate, feed properties, gut microbiota and genetic predispositions (Reyer, Hawken, Murani, Ponsuksili, & Wimmers, 2015). In this situation where the IC were kept under similar environment, the difference in FCE is likely due to their genetic constitution. Indigenous chickens in the tropics have major genes which affect their performance (Ibe, 1993). There are typically a big number of genes involved in growth which leads to differences in BW. These genes can be activated or deactivated at different stage depending on the development of the genetic background of the IC (Rouzic, Álvarez-Castro, & Carlborg, 2008). Certain genes regulating BW in gene pool A are not found in gene pool C. This occurrence is attributed to mutations and recombination, which are the most important factors responsible for the genetic variances between breeds and populations of chicken (Weigend & Romanov, 2001). The significant differences observed between gene pools in this study for BW measured were confirmed also in Ethiopia (Dessie & Ogle, 2001; Tadelle et al., 2003), Tanzania (Msoffe et al., 2001), Zimbabwe (McAinsh, Kusina, Madsen, & Nyoni, 2004), Botswana (McAinsh et al., 2004), Kenya (Ngeno et al., 2010; Ngeno, Magothe, Okeno, Bebe, & Kahi, 2013; Ngeno, Waaij, Kahi, & Arendonk, 2014) and Bangladesh (Bhuiyan, Bhuiyan, & Deb, 2011). These differences among IC gene pools enable selection of parent lines for practical IC breeding (Ngeno et al., 2010), which results in their genetic improvement (Li, Korol, Fahima, Beiles, & Nevo, 2002).
The growth rate among gene pools varied for the first three weeks. Thus, their ranking was not consistent. This implies that a gene pool by age interaction occurred. For this reason, a constant criterion cannot be used in genetic selection for BW between the gene pools. The genetic relationship between immature BW and age when selection decisions are made and desired matured weight may not be the same for different gene pools. There was an increase in the BW measurements during the birds’ maturity period, demonstrating a direct positive relationship between BW and age. This was confirmed by the observed differences in growth curve parameters among the gene pools. This result agrees with previous reports from Nigeria (Ojedapo, 2013), Ethiopia (Tadelle et al., 2003) and Kenya (Ngeno et al., 2010; Ngeno et al., 2013).
Growth parameters were also determined to obtain a better description of the growth performance of Rwandese IC gene pools. The overall coefficient of determination (R2 = 0.964) was high in this study, demonstrating the sufficiency of the model in fitting and describing growth data effectively. The objective of a curve fitting was to describe body weight increase in respect to age using equations with few parameters (Ricklefs, 1985). Curve parameters provide information on growth characteristics (Ndri et al., 2018) and can be used for pre-selection (Eleroǧlu, Yildirim, Şekeroǧlu, Çoksöyler, & Duman, 2014). Growth curve patterns have been performed to increase the performance of domestic poultry. Growth parameters are also heritable (Mignon-Grasteau et al., 2000). Selection approaches have been used to change the shapes of growth curves, leading to quick growth in poultry (Hyánková et al., 2001; Maruyama, Vinyard, Akbar, Shafer, & Turk, 2001). In addition, a detailed understanding of growth characteristics will contribute to design feeding schemes to minimise production costs while maximising production efficiency of IC.
Immune Response
The findings showed that all IC had good immunity ranging from 4,879 to 8,161 (> cut-off: 993), but the chickens in gene pool C had a comparatively higher immunoglobulin titre against ND than the others (p<0.05) (Table 3). The high Ab found in the gene pool C may have resulted from their genetic make-up. Genetic diversity in Ab responses of the chicken could be due to the major histocompatibility complex (MHC) (Lwelamira, Kifaro, Gwakisa, & Msoffe, 2008), immunoglobulin allotypes, and to genes not associated with either MHC or allotypes (Gavora et al., 1983). This result complements Palladino, Gilmour, Scafuri, Stone, and Thorbecke (1977) study, which showed a quantitative variance between Ab responses. The Ab response to the similar virus varies between IC populations (Pitcovski et al., 2001) and selection for an Ab response may increase disease resistance in chicken (Gross, Siegel, Hall, Domermuth, & DuBoise, 1980). The levels of Ab in appropriate response to a pathogen is known as immune competence; the higher the levels, the greater the immune competence (Star, Frankena, Kemp, Nieuwland, & Parmentier, 2007). A standard immune response to a pathogen results in a disease resistance. This aptitude plays a key role in controlling disease occurrences (Lamont, Laan, Cahaner, Poel, & Parmentier, 2009). The reduction of disease outbreaks contributes to increased animal production and profitability (Wakchaure & Ganguly, 2016). This result on significant differences between gene pools for Ab responses to ND virus concurs with previous reports, (Chang et al., 2011; Hassan, Afify, & Aly, 2004; Taha, El-Edel, El-Lakany, & Shewita, 2012)
A noticeable trend observed in this research was that gene pool A, the heaviest had a low ND Ab titre, while the slowest growing gene pool C had the highest ND Ab titre, reinforcing the negative genetic correlation between BW and Ab response (Martin et al., 1990; Parmentier, Walraven, & Nieuwland, 1998; Siegel, Gross, & Cherry, 2009). The negative correlation between BW and Ab response is caused by pleiotropic effects between genes associated with immunoresponsiveness (Martin et al., 1990). The negative relationship between Ab production and BW occur as a result of resources allocation to immune responses rather than growth (Dunnington & Siegel, 1996; Hassan et al., 2004). Increasing Ab response consumes large quantities of energy that the IC could have used in increasing the BW (Rauw, 2012). An animal, as an entire organism, has various physiological functions which may be competitive for its inadequate resources during its lifetime (Lamont et al., 2009). Protein secretion in antibodies and protein deposition in muscle compete for the restricted accessible nutrient resources (Hassan et al., 2004). To achieve a delicate equilibrium of optimal productivity and immunoresponsiveness, knowledge of the nutrient requirements of an activated immune system with respect to individual genes regulating protein synthesis in lymphocytes and muscle tissue is needed (Lamont et al., 2009).
The existence of diversity in body weight and immune response to ND among gene pools of IC populations in this study is attributed to the geographical isolation and eras of artificial and natural selection. Earlier studies in Rwanda (Habimana et al., 2018), Senegal (Missohou, Sow, & Ngwe-Assoumou, 1998); Ethiopia (Halima, Neser, Marle-Koster, & Kock, 2007) and results by Hauser, Carvalho, and Pitcher (1995) reported that ecological zones lead to the establishment of population traits with probable variations in genetic effect. This also confirms the genotype by environment interaction (GxE) revealed in previous studies (James, 2009; Lwelamira, 2012; Mathur & Horst, 1994). The genetic variances observed in these different gene pools could be utilised in crossbreeding programmes targeting IC with better growth performance and higher immunoglobulins against the ND virus. Consequently, gene pools A and C could be considered.
Conclusion
This study revealed that gene pool A was the heaviest and the gene pool C expressed the highest immune response for Newcastle disease vaccine. This research work provides the basis for choosing a suitable IC gene pool for breeding programme. From this result, it was evident that the selection of gene pool A in breeding would yield IC with good growth performance trait whilst gene pool C could be selected for its higher immunity against Newcastle disease. For further studies, there is a need to contemplate diversity in egg production and other important poultry’s diseases among IC gene pools in Rwanda. Besides, with regard to immune response, immunoglobulins Y (IgY), M (IgM) and possibly A (IgA) should be examined separately across IC gene pools in Rwanda.
Supplemental data
Supplemental File 1: Abstract in French