Phenotypic diversity among finger millet (Eleusine coracana (L.) Gaertn.) landraces of Nepal
Abstract
Finger millet (Eleusine coracana (L.) Gaertn.) is the fourth most important crop in Nepal having multiple benefits but is still neglected by mainstream research and development. The main option to boost its productivity is developing superior varieties through enhanced use of germplasm in breeding programmes. With the objective of enhancing utilization of landraces conserved ex situ, a total of 300 finger millet accessions collected from 54 districts were characterized in three hill locations of Nepal for two consecutive years (2017–2018). Nine qualitative and 17 quantitative traits were recorded, and combined mean data were subjected to multivariate analysis to assess agromorphological diversity. Shannon–Weaver diversity indices (H') showed high diversity (0.647–0.908) among the accessions for qualitative traits except for finger branching and spikelet shattering whereas high diversity (0.864–0.907) was observed for all quantitative traits. The first five principal components (PC) explained 61.8% of the total phenotypic variation with two PCs explaining 37.5% variation mainly due to flowering and maturity days, plant height, flag leaf length, grain and straw yield, ear weight, ear exsertion and number of fingers per head. Genotypes were grouped into four clusters with 16, 66, 107 and 111 accessions based on quantitative traits. The correlation between the traits indicated that accessions with early flowering, tall plants, long leaves, high tillers, large ears and bold grains could be given priority for further evaluation in multiple locations. Potential landraces identified for each trait could either be deployed to wider areas as varieties or used as trait donors in finger millet breeding.
Keywords
Eleusine coracana, finger millet, multivariate analysis, phenotypic diversity, Nepal
Introduction
Finger millet (Eleusine coracana (L.) Gaertn.) is an allotetraploid species (2n = 4x = 36; genome constitution AABB) of the grass family Poaceae (Dida et al., 2007). It evolved from a wild species (E. coracana ssp. africana (Kenn.-O'Bryne) (AABB)) which is the natural cross between wild species (E. indica (L.) Gaertn. (AA)) and extinct unknown species (BB) (Liu, Jiang, Wen, & Peterson, 2014). East Africa is considered its primary centre of diversity (Phillips, 1972) where nine out of ten known species of the genus Eleusine – coracana, africana, indica, floccifolia (Spreng), intermedia (Chiov.) (S.M.Phillips), multiflora (Hochst. ex A.Rich), jaegeri (Pilg.), kigeziensis (S.M.Phillips) and semisterilis (S.M.Phillips) – are found, except E. tristachya (Lam.) (Hilu & De-Wet, 1976). Ploidy and hybridization barriers suggest that tetraploid (2n = 4x = 36) species E. coracana (AABB) and E. africana (AABB) are in the primary gene pool, diploid (2n = 2x = 18) species E. indica (AA), E. tristachya (AA) and E. floccifolia (BB) formed the secondary gene pool and the rest of the species are in the tertiary gene pool (Sood, Joshi, Chandra, & Kumar, 2019). It was domesticated about 5,000 years ago in eastern Africa (Ethiopian highlands) and introduced into the Indian subcontinent 3,000 years ago (Hilu, De-Wet, & Harlan, 1979; Upadhyaya, Gowda, Pundir, Reddy, & Singh, 2006).
Globally, finger millet ranked fourth in importance among millet crops after sorghum, pearl millet and foxtail millet (Upadhyaya, Gowda, & Reddy, 2007). In many countries, precise data on cultivation area and production of finger millet are not available because the production statistics of this crop had often been combined with other millets (Upadhyaya et al., 2010). It is cultivated on 3.8 million ha (12% of the total millet area) with coverage in more than 25 countries in Africa (e.g. Uganda, Tanzania, Kenya, Ethiopia, Rwanda, Zaire, Eritrea and Somalia) and Asia (e.g. India, Nepal, Sri Lanka, Myanmar, China and Japan) (Bora, 2013; Hittalmani et al., 2017; Kumar et al., 2016; Upadhyaya et al., 2010; Vetriventhan, Upadhyaya, Dwivedi, Pattanashetti, & Singh, 2016). It is grown in a wide range of environments from the tropical coastal regions of India (Upadhyaya et al., 2006) to the high mountains (3,130 masl) of Nepal (Bastola, Pandey, Ojha, Ghimire, & Baral, 2015; Gaihre, Gauchan, & Timsina, 2021). Having the C4 photosynthetic pathway (Hittalmani et al., 2017; Parvathi, Nataraja, Reddy, Naika, & Gowda, 2019), it is a hardy crop grown in marginal land and stress environments with very low or minimum input (Goron, Bhosekar, Shearer, Watts, & Raizada, 2015). Finger millet (kodo in Nepali) is the fourth most important cereal crop in Nepal after rice, maize and wheat in terms of area and production, and occupies an average of 7.7% (265,401ha) of the total cultivated area covered by cereal crops and accounts for 2.9% (326,443t) of total cereal production with average yield of 1.23t/ha (MOALD, 2022).
Nutritionally, its importance is well recognized because of its high content of calcium (0.34%), dietary fiber (18%), protein (6–13%), minerals (2.5–3.5%), phytates (0.48%) and phenolic compounds (0.3–3%) (Chandra, Chandra, Pallavi, & Sharma, 2016). It is enriched with calcium, iron, zinc, proteins and calories (O’Kennedy, Grootboom, & Shewry, 2006; Upadhyaya et al., 2011). The crop is also valued for its health beneficial effects like anti-diabetic, anti-tumorigenic, antioxidant and antimicrobial properties (Devi, Bharathi, Sathyabama, Malleshi, & Priyadarisini, 2011; Kumar et al., 2016; Nakarani et al., 2021). Besides food and nutrition, it is an integral component of agrotourism in Nepal due to local specialties made from it, such as dhindo (thick porridge) and high quality raksi (home-made wine) (Gaihre et al., 2021; Ghimire, Bhandari, Gurung, Dhami, & Baniya, 2017; Joshi, Joshi, & Ghimire, 2020).
(Vetriventhon et al., 2020) reported a total of 36,873 finger millet accessions (including landraces, improved cultivars, wild and weedy relatives) conserved ex situ at global level and this number is ever increasing. Most of these collections are yet to be characterized and utilized in breeding. The International Crop Research Institute for Semi-Arid Tropics (ICRISAT) has developed a finger millet core collection of 622 accessions, including 70 accessions from Nepal, based on agromorphological diversity from their entire collection of 5,940 accessions (Upadhyaya et al., 2006). Two studies reported on the characterization of Nepalese finger millet accessions (Bhattarai, Ghimire, Joshi, & Bhatta, 2014) but the landraces used in those studies were not properly represented in the entire genebank collection. Characterization of collected landraces is the most important avenue to open the door for their utilization. However, less utilization of local genetic resources for crop improvement programmes is evident in Nepal due to lack of information about the desirable accessions in the genebank resulting from poor characterization and evaluation data. Three out of six finger millet varieties notified in the country were improved from native landraces, which include Okhle-1, Kabre kodo-1 and Rato kodo. The present study describes the characterization of finger millet accessions conserved at the National Agriculture Genetic Resources Centre (NAGRC, Genebank) of Nepal, grouping of accessions with similar characters using a range of multivariate statistical tools and identifying potential landraces to be utilized in finger millet improvement programmes.
Materials and methods
Plant materials and experimental sites
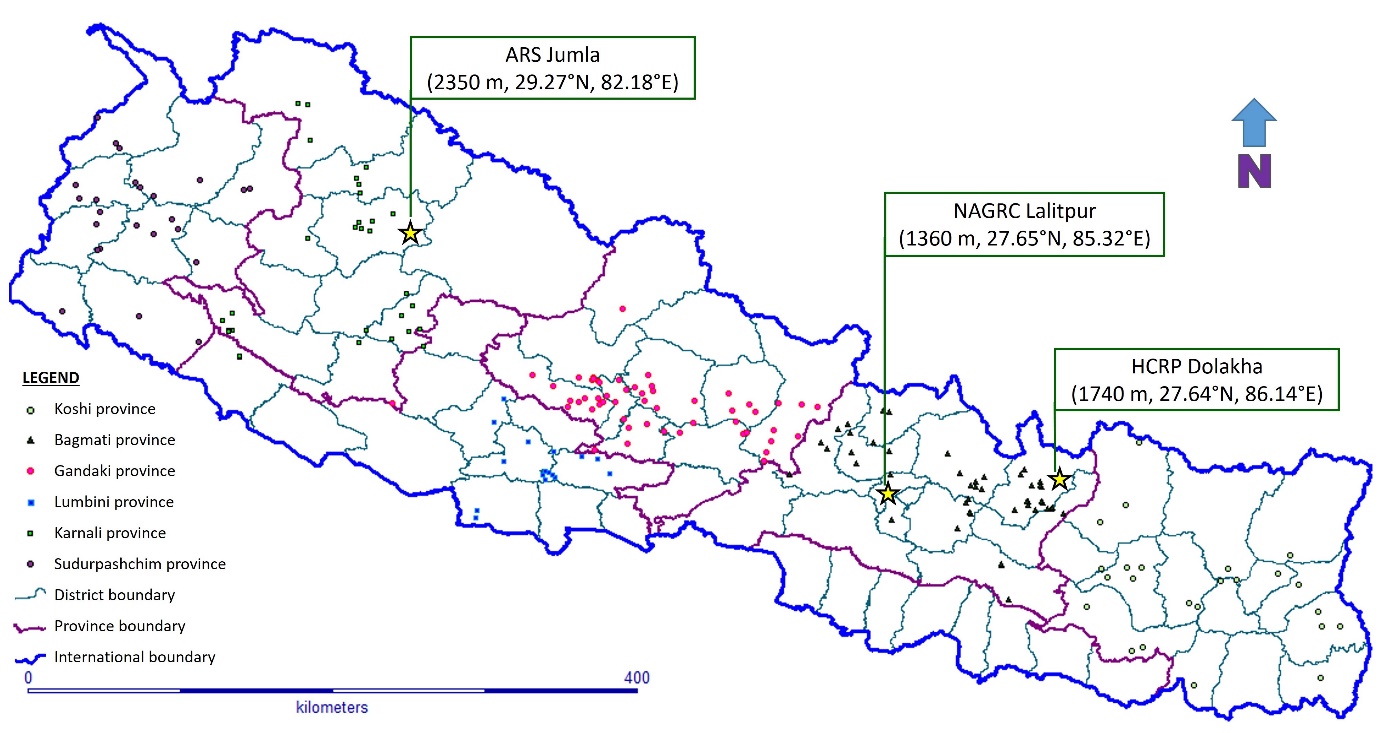
This study used 300 finger millet accessions (Supplemental Table 1) received from NAGRC which include 295 landraces collected from 54 districts of 6 provinces, and 5 released varieties (Okhle-1, Dalle kodo-1, Kabre kodo-1, Kabre kodo-2 and Shailung kodo-1) of Nepal. A total of 295 landraces were selected from nearly 1,000 accessions of 54 districts based on proportions and representation, so that there was minimum repetition in local name and at least one accession from each district. Experiments were conducted at three mountain locations of Nepal, namely Agriculture Research Station (ARS) Vijayanagar, Jumla (2,350 masl); NAGRC Khumaltar, Lalitpur (1,360 masl) and Hill Crops Research Programme (HCRP), Kabre, Dolakha (1,740 masl). Geocoordinates of experimental locations and collection sites of landraces were mapped (Figure 1). All three sites had coarse textured sandy loam soil.
General methodology
The experiments were laid out in alpha lattice design with 300 entries and two replications having 15 blocks within replications and 20 plots in each block. Each plot was constituted by 20 plants in a single row of 2m length with 25cm spacing between rows. During 2017 and 2018 respectively, seeding was done on 24 and 19 April at Jumla, 3 June and 26 May at Dolakha and 17 June and 7 June at Khumaltar. Direct seeding was done with the application of chemical fertilizers at the rate of 20:10:10 kg/ha N:P2O5:K2O as basal doses. Thinning was applied within 25–30 days after seeding to maintain a plant-to-plant spacing of 10cm within rows. Manual weeding was done as per requirement but no irrigation and pesticides were applied.
Data recording
Morphological data of nine qualitative and 17 quantitative traits were recorded as per the standard descriptors of finger millet (IBPGR, 1985). The qualitative traits were recorded from a single replication of 2017 at Khumaltar only, based on observations as per the descriptor states. Observations on days to 50% flowering, days to 80% maturity, grain yield (kg/ha) and straw yield (t/ha) were based on whole plot data whereas measurements on other quantitative traits such as plant height (cm), tillers per hill (n), flag leaf length (cm), flag leaf width (cm), flag leaf sheath length (cm), ear exsertion (cm), ear head length (cm), ear head width (cm), fingers per head (n), length of the longest finger (cm), width of the longest finger (cm), weight per head (g) and weight of 1,000 grains (g) were made from five randomly selected plants. Observations for days to maturity of those accessions which did not set grains due to extremely low temperature after flowering at Jumla were considered as missing values whereas grain yield of those accessions were estimated as zero.
Data analysis
The frequency of each descriptor state for all qualitative traits were tabulated with their proportions whereas observations for all quantitative traits of each year and locations were subjected to unbalanced analysis of variance (ANOVA) using regression model with the software GenStat version 15 (VSN International, 2015). The combined mean data were subjected to descriptive statistical analysis such as minimum, maximum, mean, standard error and coefficient of variation using Minitab-17 (MINITAB, 2010). Hierarchical clustering of observations and construction of dendrogram were done based on unweighted pair group method with arithmetic mean (UPGMA) by using FactoMineR package (Sebastien, Josse, & Husson, 2008) and factor map visualization was made by using Factoextra package (Kassambara & Mundt, 2020) of R statistical software (R Core Team, 2020). Correlation analysis (Pearson’s coefficient with probability) and principal component analysis (PCA) were done using Minitab-17 (MINITAB, 2010). Standardized Shannon-Weaver diversity indices (H') (Shannon & Weaver, 1949) were calculated for each trait with Microsoft Excel (Ghimire, Joshi, Dhakal, & Sthapit, 2018; Ghimire, Joshi, Gurung, & Sthapit, 2018) .
Results
Diversity index and frequency distribution of qualitative traits
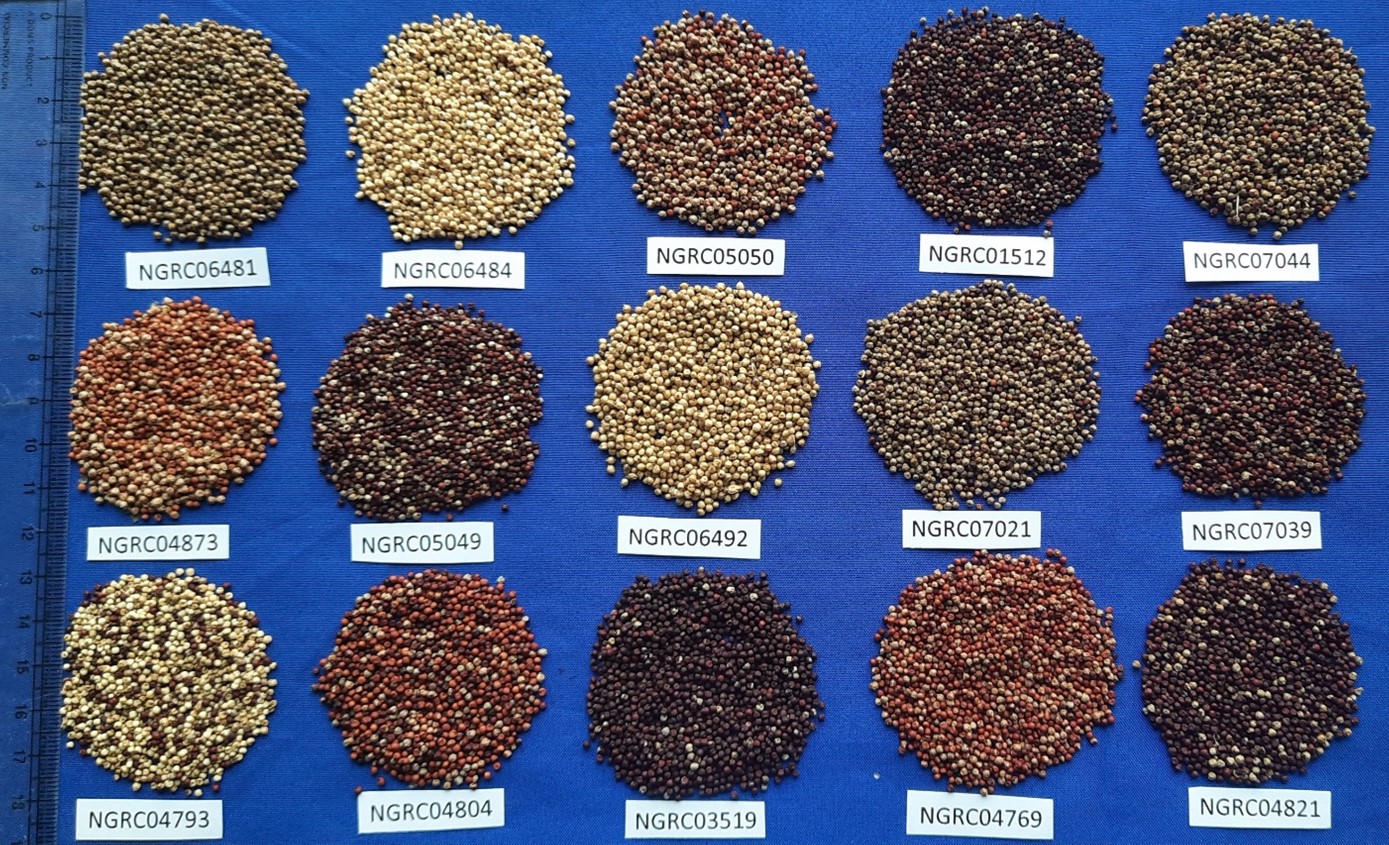
Based on Shannon-Weaver diversity index (H'), we observed very low diversity for finger branching and grain shattering (0.122) but it was highest for plant pigmentation (0.908) followed by grain covering (0.793), ear shape (0.790) and seed colour (0.722) (Table 1). The data showed that the predominant ear shapes in Nepalese finger millet are open (42.7%) and semi-compact (41.7%) types. More than two-thirds (68%) of accessions had intermediate ear size followed by large ear size (29.7%). Less than 2% of the accessions had branching in fingers and grain shattering. Similarly, one-third of the accessions had pigmented plants while very few accessions were highly susceptible to lodging (3.3%). Seed colour varied from white to purple-brown (Figure 2). The predominant seed colour in the collection was light-brown (53%) followed by purple-brown (37%).
|
Qualitative traits |
H' |
Descriptor states |
Frequency (n) |
Proportion (%) |
|
Ear shape |
0.790 |
Droopy |
38 |
12.7 |
|
Open |
128 |
42.7 |
||
|
Semi-compact |
125 |
41.7 |
||
|
Compact |
9 |
3.0 |
||
|
Ear size |
0.647 |
Small |
7 |
2.3 |
|
Intermediate |
204 |
68.0 |
||
|
Large |
89 |
29.7 |
||
|
Finger branching |
0.122 |
Absent |
295 |
98.3 |
|
Present |
5 |
1.7 |
||
|
Grain covering |
0.793 |
Exposed |
67 |
22.3 |
|
Intermediate |
196 |
65.3 |
||
|
Enclosed |
37 |
12.3 |
||
|
Lodging susceptibility |
0.654 |
Low |
209 |
69.7 |
|
Intermediate |
81 |
27.0 |
||
|
High |
10 |
3.3 |
||
|
Plant pigmentation |
0.908 |
Not pigmented |
203 |
67.7 |
|
Pigmented |
97 |
32.3 |
||
|
Seed colour |
0.722 |
White |
11 |
3.7 |
|
Light-brown |
159 |
53.0 |
||
|
Copper-brown |
19 |
6.3 |
||
|
Purple-brown |
111 |
37.0 |
||
|
Spikelet density |
0.676 |
Sparse |
89 |
29.7 |
|
Intermediate |
201 |
67.0 |
||
|
Dense |
10 |
3.3 |
||
|
Spikelet shattering |
0.122 |
Absent |
295 |
98.3 |
|
Present |
5 |
1.7 |
Descriptive statistics and diversity indices of quantitative traits
Range, mean, standard error of mean (SE), coefficient of variation (CV) and Shannon-Weaver diversity index (H') of each quantitative trait are presented in Table 2. A wide range of variation in agronomic performance was observed among the evaluated accessions. The early maturing accessions started flowering at 75 days after seeding and the late maturing accessions flowered at 140 days whereas the average plant height ranged from 61 to 119cm. The average adjusted grain yield and straw yield ranged from 230 to 3,494kg/ha and 2.0 to 20.2t/ha, respectively. The CV varied from 6.2% for flag leaf length to 33.3% for grain yield. H' ranged from 0.864 to 0.907 suggesting high diversity in finger millet accessions for all quantitative traits.
|
Trait |
Minimum |
Maximum |
Mean |
SE |
CV (%) |
H' |
|
Days to 50% flowering (n) |
75 |
140 |
112.2 |
0.70 |
10.8 |
0.870 |
|
Days to 80% maturity (n) |
122 |
174 |
154.4 |
0.59 |
6.6 |
0.871 |
|
Plant height (cm) |
61 |
119 |
95.4 |
0.44 |
8.0 |
0.864 |
|
Tillers per hill (n) |
2.5 |
5.9 |
4.4 |
0.03 |
11.1 |
0.898 |
|
Flag leaf length (cm) |
22 |
32 |
27.2 |
0.10 |
6.2 |
0.880 |
|
Flag leaf width (cm) |
0.5 |
1.2 |
0.91 |
0.01 |
9.7 |
0.906 |
|
Flag leaf sheath length (cm) |
11 |
22 |
15.1 |
0.08 |
8.7 |
0.872 |
|
Ear exsertion (cm) |
7.2 |
14 |
10.8 |
0.07 |
10.7 |
0.899 |
|
Ear head length (cm) |
4.5 |
8.8 |
6.2 |
0.04 |
11.0 |
0.880 |
|
Ear head width (cm) |
3.0 |
6.5 |
4.2 |
0.03 |
13.3 |
0.867 |
|
Fingers per head (n) |
4.1 |
8.9 |
7.0 |
0.04 |
9.4 |
0.878 |
|
Length of the longest finger (cm) |
4.0 |
9.8 |
5.9 |
0.06 |
16.9 |
0.875 |
|
Width of the longest finger (cm) |
0.48 |
0.93 |
0.68 |
0.005 |
11.9 |
0.902 |
|
Weight per head (g) |
3.1 |
10 |
5.9 |
0.06 |
17.6 |
0.897 |
|
Weight of 1,000 grains (g) |
1.8 |
3.2 |
2.3 |
0.01 |
9.5 |
0.882 |
|
Grain yield (kg/ha) |
230 |
3,494 |
1,577 |
30.3 |
33.3 |
0.884 |
|
Straw yield (t/ha) |
2.0 |
20.2 |
9.3 |
0.17 |
30.7 |
0.907 |
Clustering observations
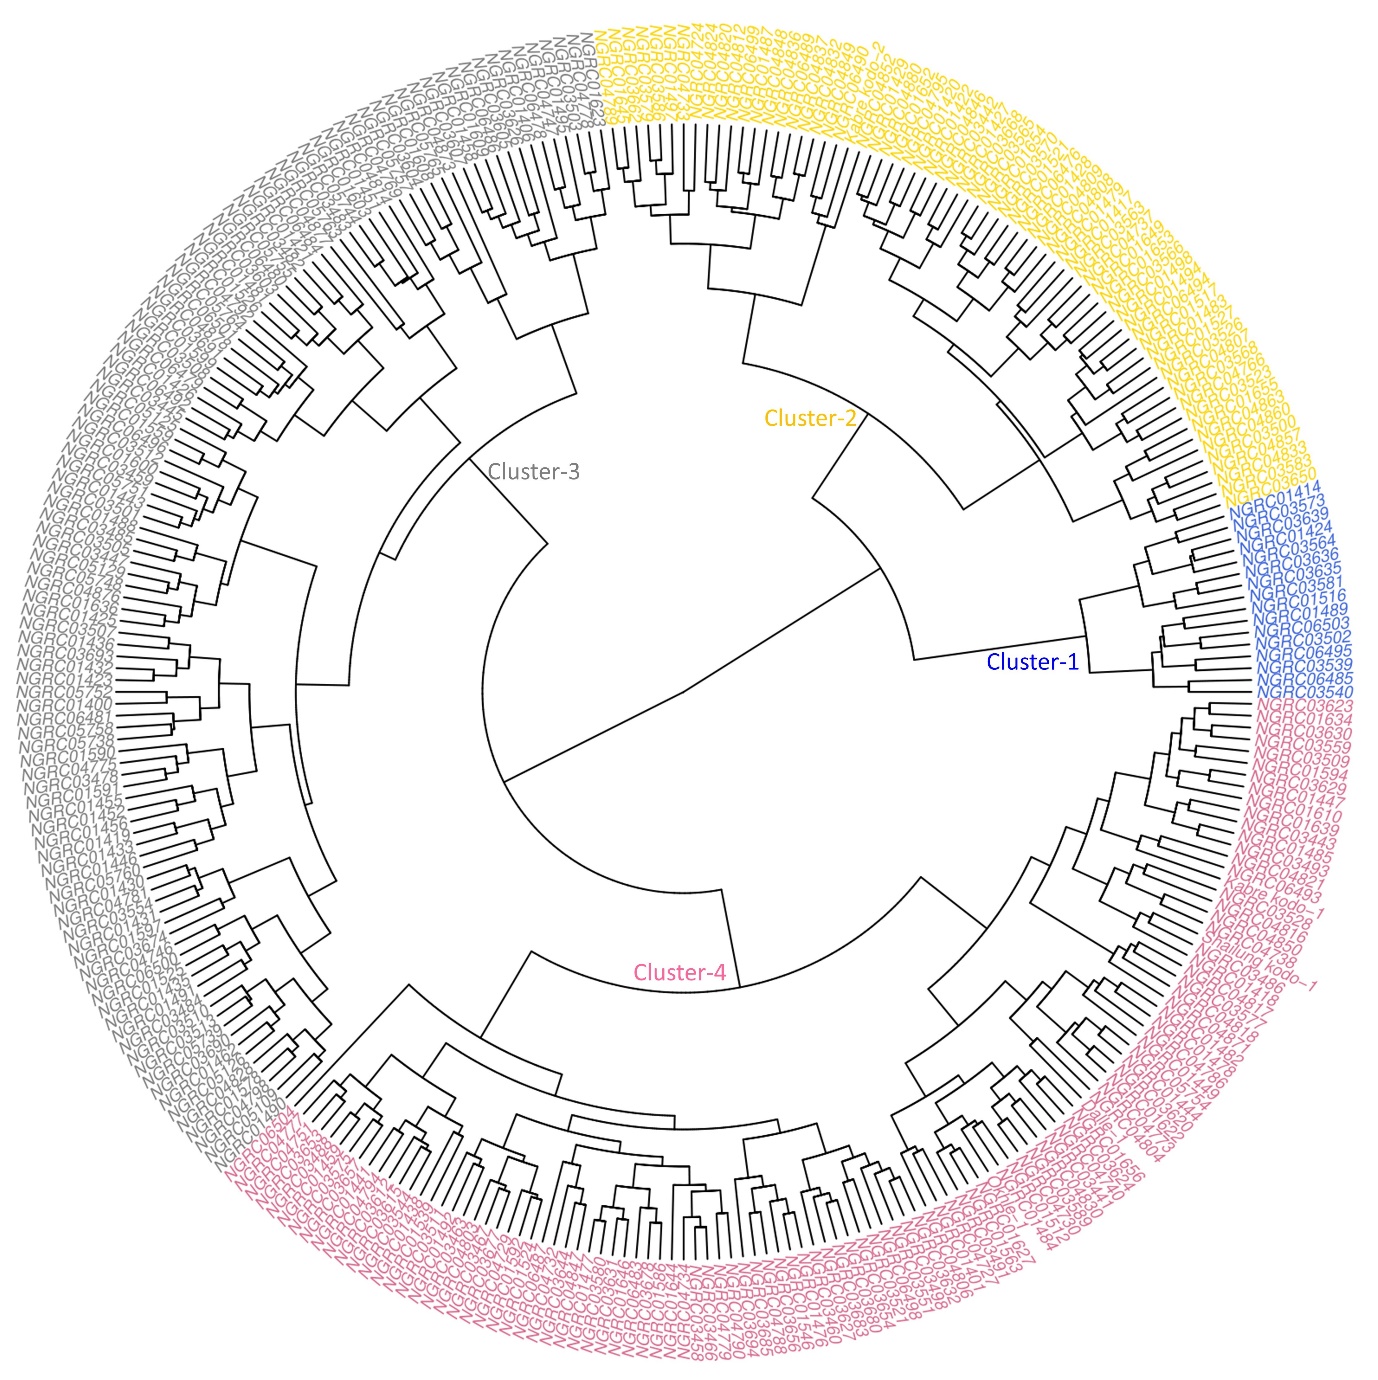
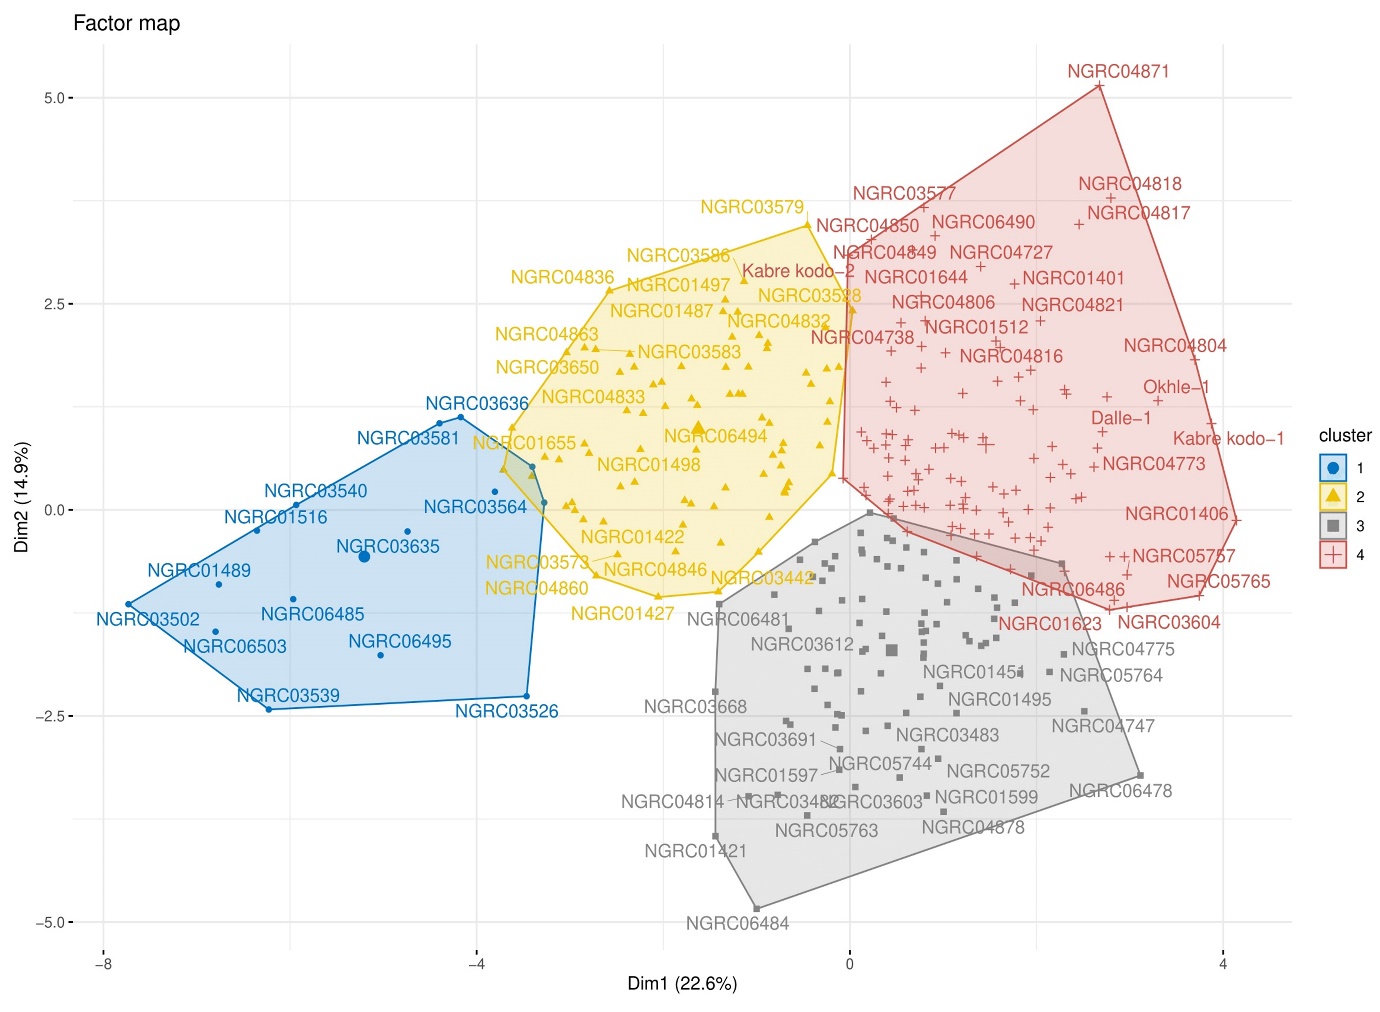
A UPGMA hierarchical clustering divided the entire 300 accessions into four clusters (Figure 3). The number of accessions in each cluster and cluster characteristics for each quantitative trait are presented in Table 3. Cluster 4 was the largest cluster with 111 (37%) accessions having the highest cluster means for grain yield (1,858 kg/ha), straw yield (10.6t/ha), plant height (100cm), 1,000-grain weight (2.4g), weight per head (6.5g) and ear length (6.6cm). Cluster 3 was the second largest cluster with 107 (35.6%) accessions having the lowest mean grain yield (1,147kg/ha) but the longest mean flowering days (122) and maturity days (161 days). Cluster 1 was the smallest cluster with 16 (5.3%) accessions characterized by the lowest cluster mean for straw yield (4.9t/ha), weight per head (4.5g), finger length (5.0cm), ear length (5.5cm), fingers per head (5.6), plant height (78cm), flowering (85 days) and maturity (132 days). Non-significant difference was observed between cluster mean and overall mean for flag leaf width.
|
Trait |
Cluster 1 |
Cluster 2 |
Cluster 3 |
Cluster 4 |
Overall |
|||||
|
Mean |
Sd |
Mean |
Sd |
Mean |
Sd |
Mean |
Sd |
Mean |
Sd |
|
|
Number of accessions |
16 |
66 |
107 |
111 |
300 |
|||||
|
Days to 50% flowering (n) |
85** |
6.56 |
101** |
6.13 |
122** |
7.14 |
116** |
6.39 |
112 |
12.1 |
|
Days to 80% maturity (n) |
132** |
5.86 |
145** |
6.01 |
161** |
5.53 |
158** |
5.71 |
154 |
10.2 |
|
Plant height (cm) |
78** |
8.92 |
– |
– |
93** |
5.90 |
100** |
5.69 |
95.4 |
7.6 |
|
Tillers per hill (n) |
– |
– |
– |
– |
4.2** |
0.44 |
4.5** |
0.45 |
4.4 |
0.49 |
|
Flag leaf length (cm) |
24.4** |
1.07 |
26.8* |
1.46 |
– |
– |
27.9** |
1.44 |
27.2 |
1.68 |
|
Flag leaf width (cm) |
– |
– |
– |
– |
– |
– |
– |
– |
0.91 |
0.09 |
|
Flag leaf sheath length(cm) |
13.8** |
0.91 |
16.0** |
1.18 |
14.4** |
1.17 |
– |
– |
15.1 |
1.31 |
|
Ear exsertion (cm) |
10.1* |
1.18 |
– |
– |
10.3** |
1.08 |
11.2** |
1.10 |
10.8 |
1.15 |
|
Ear head length (cm) |
5.5** |
0.45 |
5.8** |
0.53 |
– |
– |
6.6** |
0.63 |
6.2 |
0.68 |
|
Ear head width (cm) |
3.8** |
0.56 |
4.0** |
0.48 |
– |
– |
4.4** |
0.50 |
4.2 |
0.56 |
|
Fingers per head (n) |
5.6** |
0.88 |
6.8** |
0.46 |
7.3** |
0.52 |
– |
– |
7.0 |
0.66 |
|
Length of longest finger (cm) |
5.0** |
0.70 |
5.4** |
0.80 |
– |
– |
6.6** |
0.96 |
5.9 |
1.01 |
|
Width of longest finger (cm) |
– |
– |
– |
– |
0.67* |
0.09 |
– |
– |
0.68 |
0.08 |
|
Weight per head (g) |
4.5** |
0.72 |
5.6** |
0.80 |
5.6** |
0.84 |
6.5** |
0.96 |
5.9 |
1.03 |
|
Weight of 1,000 grains (g) |
– |
– |
– |
– |
2.2** |
0.19 |
2.4** |
0.22 |
2.3 |
0.22 |
|
Grain yield (kg/ha) |
1,181** |
379.8 |
1,756** |
359.5 |
1,147** |
385.1 |
1,858** |
473.9 |
1,577 |
524.4 |
|
Straw yield (t/ha) |
4.9** |
2.22 |
7.3** |
1.98 |
10.1** |
2.35 |
10.6** |
2.42 |
9.3 |
2.85 |
Principal component analysis
The contribution of various traits in total phenotypic variation among 300 finger millet accessions was evaluated by principal component analysis (PCA). The first five principal components with eigenvalue ~1 or more, explained 61.8% of the total variation (Table 4). The first principal component (PC-1) explained 22.6% of the total variation which was positively attributed to days to maturity (0.421), days to flowering (0.401), straw yield (0.338), fingers per head (0.303), finger length (0.295), ear length (0.290), plant height (0.280), leaf length (0.255), weight per head (0.252) and ear width (0.229). The second component (PC-2) explained an additional 14.9% of the total variation.The maximum variation in this PC was primarily due to the lower grain yield (-0,496), sheath length (-0.389), plant height (-0.313), 1,000-grain weight (-0.278), ear exsertion (-0.256), and tillers per plant (-0.255) but higher value of days to flowering (0.314) and maturity (0.267). The third component (PC-3), which explained 9.1% of the total variation, differentiated the accessions by higher finger length and ear length but lower leaf length.
|
Eigen analysis |
Entry means |
Cluster means |
|||||||||
|
PC-1 |
PC-2 |
PC-3 |
PC-4 |
PC-5 |
PC-1 |
PC-2 |
PC-3 |
PC-4 |
PC-5 |
||
|
Eigenvalue |
3.763 |
2.691 |
1.461 |
1.237 |
0.998 |
10.28 |
4.79 |
1.93 |
0 |
0 |
|
|
Proportion |
0.226 |
0.149 |
0.091 |
0.083 |
0.069 |
0.605 |
0.282 |
0.113 |
0 |
0 |
|
|
Cumulative (%) |
22.6 |
37.5 |
46.6 |
54.9 |
61.8 |
60.5 |
88.7 |
100 |
100 |
100 |
|
|
Eigenvectors |
|
|
|
|
|
|
|
|
|
|
|
|
Days to 50% flowering |
0.401 |
0.314 |
-0.044 |
-0.057 |
0.088 |
0.296 |
-0.114 |
0.141 |
0.083 |
-0.081 |
|
|
Days to 80% maturity |
0.421 |
0.267 |
-0.046 |
-0.086 |
0.044 |
0.300 |
-0.099 |
0.116 |
0.057 |
-0.454 |
|
|
Plant height |
0.280 |
-0.313 |
-0.214 |
0.065 |
0.166 |
0.279 |
0.189 |
0.124 |
0.042 |
0.308 |
|
|
Tillers per hill |
0.032 |
-0.255 |
0.103 |
-0.383 |
0.091 |
-0.123 |
0.419 |
-0.032 |
0.148 |
-0.007 |
|
|
Flag leaf length |
0.255 |
-0.102 |
-0.318 |
0.206 |
-0.343 |
0.304 |
0.079 |
0.097 |
-0.005 |
-0.256 |
|
|
Flag leaf width |
-0.014 |
-0.022 |
-0.142 |
-0.442 |
-0.780 |
-0.130 |
0.007 |
0.654 |
-0.054 |
-0.001 |
|
|
Flag leaf sheath length |
-0.021 |
-0.389 |
-0.283 |
0.042 |
0.147 |
0.147 |
0.392 |
0.150 |
0.149 |
0.305 |
|
|
Ear exsertion |
0.124 |
-0.256 |
-0.124 |
0.396 |
-0.136 |
0.260 |
0.252 |
0.034 |
0.177 |
-0.456 |
|
|
Ear head length |
0.290 |
-0.145 |
0.456 |
-0.017 |
-0.005 |
0.274 |
0.022 |
-0.343 |
-0.068 |
-0.168 |
|
|
Ear head width |
0.229 |
-0.006 |
0.258 |
0.206 |
-0.343 |
0.266 |
-0.230 |
-0.101 |
-0.102 |
0.298 |
|
|
Fingers per head |
0.303 |
0.118 |
-0.340 |
-0.132 |
0.101 |
0.294 |
0.015 |
0.240 |
-0.090 |
-0.071 |
|
|
Length of longest finger |
0.295 |
-0.094 |
0.468 |
-0.100 |
0.070 |
0.275 |
-0.065 |
-0.322 |
0.025 |
0.039 |
|
|
Width of longest finger |
-0.010 |
-0.087 |
0.218 |
0.519 |
-0.200 |
-0.098 |
0.340 |
-0.425 |
0.197 |
-0.023 |
|
|
Weight per head |
0.252 |
-0.218 |
-0.088 |
-0.159 |
0.095 |
0.297 |
0.141 |
0.013 |
-0.030 |
0.327 |
|
|
Weight of 1,000 grains |
0.041 |
-0.278 |
0.220 |
-0.255 |
-0.074 |
-0.124 |
0.412 |
0.122 |
0.287 |
-0.088 |
|
|
Grain yield |
0.073 |
-0.496 |
-0.061 |
-0.048 |
0.036 |
0.131 |
0.414 |
-0.009 |
-0.776 |
0.016 |
|
|
Straw yield |
0.338 |
0.131 |
-0.073 |
0.097 |
-0.010 |
0.305 |
-0.089 |
0.066 |
0.403 |
0.295 |
|
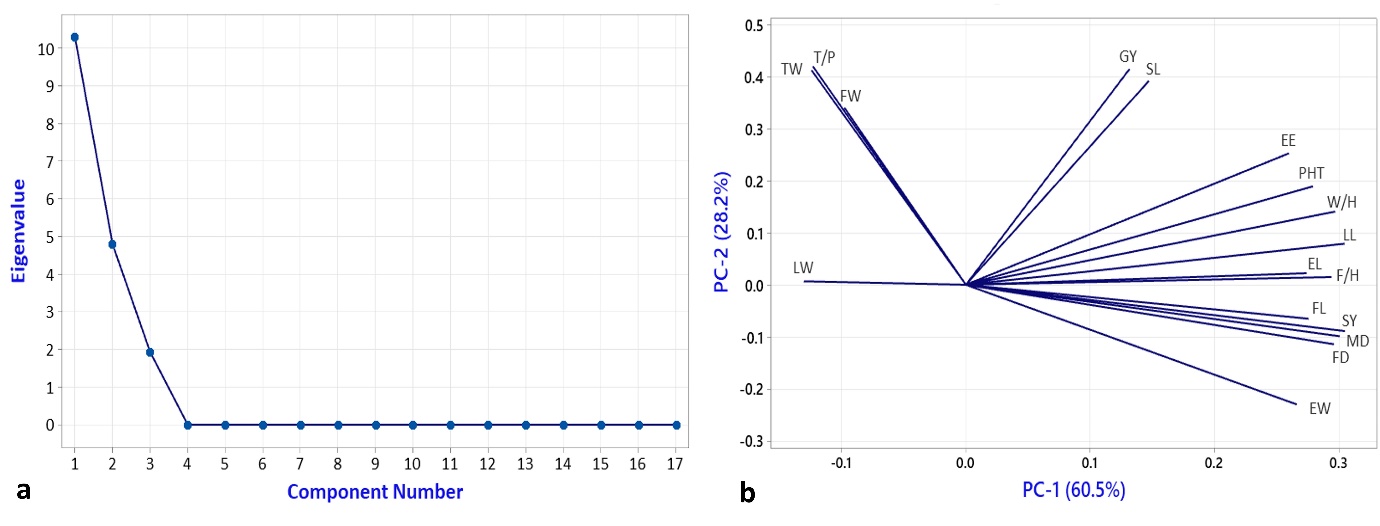
PCA using cluster means showed that the first three components explained 100% of the total variability with 60.5 and 28.2% contribution by PC-1 and PC-2, respectively (Table 4). Most of the traits occupied the right side of the bi-plot and thus contributed with positive loadings to the variation explained by PC-1 (Figure 4b). A clear-cut elbow on the fourth component in the scree plot (Figure 4a) as well as the two-dimension scatterplot of PC1 and PC2 (Figure 5) revealed strong support for the clustering result since we can see the visible groupings of accessions as per the clusters (Figure 3).
Correlation between traits
The Pearson’s correlation coefficients between traits are presented in Table 5. A total of 136 trait associations were estimated among the 17 quantitative traits. Out of these, associations between days to 50% flowering and days to 80% maturity (0.93) as well as between ear length and length of the longest finger (0.63) had high estimates. This indicates that only one trait from each of these pairs could be recorded and assessed during future characterization work. Grain yield was positively correlated with plant height, productive tillers per plant, flag leaf length, leaf sheath length, ear exsertion, ear length, finger length, ear weight and 1,000-grain weight but negatively correlated with days to flowering and maturity. When selecting for grain yield, we should consider these traits strongly associated with grain yield while when selecting for straw yield, our focus should be on taller plant height and late maturity since straw yield had strong positive association with days to flowering, maturity and plant height.
|
Trait |
FD |
MD |
PH |
T/P |
LL |
LW |
SL |
EE |
EL |
EW |
F/H |
FL |
FW |
W/H |
TW |
GY |
|
MD |
0.93** |
|
|
|
|
|
|
|
|
|
|
|
|
|
|
|
|
PH |
0.21** |
0.26** |
|
|
|
|
|
|
|
|
|
|
|
|
|
|
|
T/P |
–0.06 |
–0.06 |
0.11 |
|
|
|
|
|
|
|
|
|
|
|
|
|
|
LL |
0.27** |
0.32** |
0.33** |
0.01 |
|
|
|
|
|
|
|
|
|
|
|
|
|
LW |
–0.03 |
0.04 |
0.02 |
0.02 |
0.07 |
|
|
|
|
|
|
|
|
|
|
|
|
SL |
–0.26** |
–0.25** |
0.33** |
0.05 |
0.16** |
–0.01 |
|
|
|
|
|
|
|
|
|
|
|
EE |
–0.04 |
–0.06 |
0.33** |
0.04 |
0.20** |
–0.05 |
0.21** |
|
|
|
|
|
|
|
|
|
|
EL |
0.24** |
0.29** |
0.30** |
0.10 |
0.13* |
0.00 |
–0.03 |
0.10 |
|
|
|
|
|
|
|
|
|
EW |
0.25** |
0.26** |
0.10 |
0.05 |
0.22** |
0.00 |
–0.14* |
0.09 |
0.37** |
|
|
|
|
|
|
|
|
F/H |
0.53** |
0.50** |
0.31** |
0.00 |
0.28** |
0.02 |
0.03 |
0.02 |
0.14* |
0.17** |
|
|
|
|
|
|
|
FL |
0.34** |
0.38** |
0.29** |
0.10 |
0.11 |
0.01 |
–0.04 |
0.06 |
0.63** |
0.27** |
0.11 |
|
|
|
|
|
|
FW |
–0.08 |
–0.09 |
0.01 |
–0.01 |
0.05 |
–0.10 |
0.01 |
0.06 |
0.07 |
0.06 |
–0.10 |
0.00 |
|
|
|
|
|
W/H |
0.20** |
0.23** |
0.39** |
0.17** |
0.22** |
0.05 |
0.07 |
0.12* |
0.32** |
0.12* |
0.27** |
0.24** |
0.02 |
|
|
|
|
TW |
–0.08 |
–0.06 |
0.10 |
0.20 |
0.04 |
0.08 |
0.12* |
0.02 |
0.12* |
0.04 |
–0.18** |
0.15* |
0.04 |
0.16* |
|
|
|
GY |
–0.26** |
–0.13* |
0.46** |
0.33** |
0.23** |
0.09 |
0.35** |
0.23** |
0.19** |
0.02 |
–0.03 |
0.16* |
0.10 |
0.30** |
0.36** |
|
|
SY |
0.59** |
0.58** |
0.25** |
–0.03 |
0.30** |
–0.03 |
–0.13* |
0.13* |
0.21** |
0.15* |
0.26** |
0.28** |
0.00 |
0.21** |
0.04 |
–0.01 |
|
|
||||||||||||||||
Promising landraces
Promising trait-specific donors were identified (Table 6) based on combined mean data of six environments (Supplemental Table 2). Some landraces were good for multiple traits (highlighted in Table 6) and some others for particular traits. For instance, NGRC06490 was high yielding with higher number of tillers; NGRC04849 was high yielding with higher 1,000-grain weight; NGRC04871 was high yielding with taller plant, longer ears and higher 1,000-grains weight; Kabre kodo-2 was high yielding with higher 1,000-grain weight and higher number of tillers; and NGRC04818 was high yielding with taller plant, higher 1,000-grain weight and higher weight per head. Landraces NGRC04849 and NGRC06490 produced 121.6% and 120.1% higher grain yield respectively, than the overall mean (1,577kg/ha) and 10.4% and 9.7% higher yield respectively, compared to Kabre kodo-2, a newest and best among the five released varieties. Mean days to flowering was 112 but 11 accessions flowered before 90 days after seeding. Early flowering genotypes may be selected for drought-prone lowlands as well as higher altitudes since they can escape both drought and cold stress during reproductive stage. These landraces showed potential to be efficiently utilized in breeding programmes for the improvement of finger millet.
|
Trait |
Promising accessions |
|
Days to flowering (< 90 d) |
NGRC03581, NGRC03540, NGRC03502, NGRC01516, NGRC01489, NGRC03635, NGRC03636, NGRC03539, NGRC06503, NGRC06485, NGRC03650 |
|
Days to maturity (> 130 d) |
NGRC03502, NGRC03540, NGRC01489, NGRC03581, NGRC03636, NGRC03539, NGRC06503 |
|
Plant height (< 70cm) |
NGRC06503, NGRC03502, NGRC03639, NGRC04814 |
|
Plant height (> 110cm) |
Dalle-1, NGRC04871, NGRC03511, NGRC04818, NGRC05764 |
|
Number of tillers/plant (> 5.4) |
NGRC06490, Kabre kodo-2, NGRC04852, NGRC01609, NGRC03579, NGRC05739 |
|
Flag leaf length (> 30cm) |
NGRC05109, NGRC01490, NGRC03605, NGRC04852, NGRC06493, Kabre kodo-1, NGRC03678, NGRC03690, NGRC04746, NGRC01401 |
|
Flag leaf sheath length (> 17.5cm) |
NGRC01655, NGRC04871, NGRC04724, NGRC06498, NGRC04818, NGRC03528, NGRC06504, NGRC04863 |
|
Ear exsertion (> 14cm) |
NGRC06493, NGRC01527, NGRC01610, NGRC03693 |
|
Ear length (> 7.5cm) |
NGRC04871, NGRC01406, NGRC04821, NGRC01447, NGRC04817, NGRC01458, NGRC01609, NGRC01451 |
|
Weight per head (> 8g) |
NGRC04818, Dalle-1, NGRC04804, NGRC01446, NGRC04806, NGRC01401, NGRC01639, NGRC01487 |
|
1000-grain weight (> 2.8g) |
Kabre kodo-2, NGRC04816, NGRC04849, NGRC01418, NGRC04873, NGRC04850, NGRC04824, NGRC04871, NGRC04818 |
|
Grain yield (> 2,769kg/ha) |
NGRC04849, NGRC06490, NGRC04871, Kabre kodo-2, NGRC06487, NGRC04727, NGRC04836, NGRC04806, NGRC04818 |
|
Straw yield (> 13t/ha) |
Kabre kodo-1, NGRC01456, NGRC01452, Okhle-1, NGRC01455, NGRC01539, NGRC05758 |
Discussion
Genetically diverse accessions conserved in ex situ genebanks are tremendous genetic resources for breeding high-yielding and stable crop varieties to ensure global food security. Enormous morphological and genetic diversity exists among finger millet accessions but their utilization in breeding programmes is very weak in most countries including Nepal because this crop has received very little attention for characterization, evaluation and pre-breeding activities. Only about 10% of genetic resources including finger millet stored in genebanks have been utilized in crop improvement programmes, which is mainly due to a lack of information about the desirable accessions resulting from the poor characterization and evaluation data (Hodgkin, Rao, Cibrian-Jaramillo, & Gaiji, 2003; Nguyen & Norton, 2020).
Although NAGRC holds nearly 1,000 finger millet accessions, we characterized only 300 accessions which might not represent the total genetic diversity of the country. Shannon-Weaver diversity index (H') considers both richness and evenness of the phenotypic classes of the qualitative traits but emphasizes the normality in observation of quantitative traits (Ghimire et al., 2018; Upadhyaya et al., 2010). We estimated as low, medium and high diversity if the values of H' were ≤ 0.400, 0.401–0.600 and ≥ 0.601, respectively (Eticha, Bekele, Belay, & Borner, 2005). Very low H' for grain shattering and finger branching was observed since > 98% of the accessions didn't have shattering type of grains and branching type of fingers. According to the findings of Dasanayaka and Kaluthanthri (2017), a very small proportion of Sri Lankan finger millet accessions exhibited shattering and finger branching traits. The rest of the qualitative traits (H' = 0.645–0.908) as well as all 17 quantitative traits (H' = 0.864–0.907) showed very high polymorphism. Similar diversity indices were reported in the entire global collections of 5,940 accessions (3,567 from 14 African countries, 2,163 from five South-Asian countries, seven from the USA, 22 from three European countries and 181 from unknown origin), a core collection of 622 accessions and a mini-core collection of 80 accessions (Upadhyaya et al., 2010; Upadhyaya et al., 2006) as well as in an East African collection of 1,993 accessions (Reddy, Upadhyaya, Gowda, & Singh, 2009). Phenotypic proportions of qualitative traits were calculated as the frequencies of each descriptor state for the traits. Observations on ear shape with droopy, open, compact and semi-compact suggested the presence of all cultivated races (elongata, plana, compacta and vulgaris) of E. coracana ssp. coracana (Backiyalakshmi et al., 2021; Bharathi, 2011; Sood et al., 2019; Upadhyaya et al., 2006). Our observations for other qualitative traits were similar as in core and mini-core collections of global accessions (Upadhyaya et al., 2010), in Sri Lankan accessions (Dasanayaka & Kaluthanthri, 2017; Kumari, Pushpakumara, Weerakoon, Senanayake, & Upadhyaya, 2018), in north-west Indian accessions (Kumar, Chawla, Jeena, & Rohit, 2019) and in global collections from ICRISAT (Malambane & Jaisil, 2015). Descriptive statistics such as range, mean and CV of various quantitative variables suggested wide variability within 300 accessions of the Nepalese collection. Mean flowering data ranged from 75 to 140 days which was narrower than in the global collections which included wild species (41–164 days) (Bharathi, 2011) but wider than in the core collection (51–96 days), the mini-core subsets (51–93 days) (Upadhyaya et al., 2010) and in a global collection of 314 accessions (51–97 days) (Backiyalakshmi et al., 2021). Since our research was conducted at higher altitudes, we observed mean flowering time of 112 days (pooled mean of three sites) which is higher than in studies conducted at lower elevations, which reported 79 days (Bhattarai et al., 2014), 89 days (Bastola et al., 2015) and 74 days (Backiyalakshmi et al., 2021). Our range for average plant height (61–119cm) was narrower compared to the range of 23–155cm observed in a much larger sample (537) of Nepalese accessions (Bhattarai et al., 2014), 55–240cm in east African accessions (Reddy et al., 2009), 84–143cm in a global collection (Backiyalakshmi et al., 2021) and 45–180cm in a global composite collection of 1,000 accessions (Bharathi, 2011), but wider than the range of 73–113cm in the mini-core collection (Upadhyaya et al., 2010).
Principal component analysis partitions the total variation into components and measures how each component contributes to the total phenotypic variation. The important traits in the evaluation of our landraces are days to maturity and flowering, straw yield, fingers per head, finger length, plant height, grain yield and 1,000-grain weight. The scatter plot (Figure 5) suggested that PC-2 has efficiently divided the accessions based on grain yield. High-yielding landraces and all released varieties (Shailung kodo-1, Dalle-1, Kabre kodo-1, Kabre kodo-1 and Okhle-1) were in the upper half of the scatter plot. Clustering of observations gives the average of a variable in the cluster, the average of the variable for the whole data set, the associated standard deviations and the p-value to test the hypothesis: the cluster mean is equal to the overall mean. Rejection of this hypothesis (p < 0.05) means there is significant difference between the clusters for multiple quantitative traits. The representative genotypes of each cluster illustrate the overall characters of that cluster. Pearson's correlation coefficient suggested that grain yield is positively correlated with plant height, tillers, leaf length, ear exsertion, ear and finger length, ear weight and 1,000-grain weight. This suggests that our focus when selecting landraces for grain yield should be on accessions with early flowering, taller height, high tillering, big ears and bold grains. Previous findings suggested a positive correlation between grain yield vs. days to flowering and maturity (Bastola et al., 2015; Bharathi, 2011; Lule, Tesfaye, Fetene, & Villiers, 2012; Patel, Patil, & Popat, 2017), but we observed contrasting results i.e. negative correlation of grain yield with flowering and maturity days. This can be explained because the early flowering genotypes escaped cold stress in higher altitudes like Jumla where many late maturing accessions yielded zero due to susceptibility to low temperatures. Early maturity is, therefore, a very important trait for mountain farmers cultivating millets in dry and rainfed conditions to escape drought as well as cold stress during the grain-filling stage. Straw yield had a strong positive association with days to flowering, maturity, plant height, leaf length, ear length, finger length, ear weight and number of fingers which is in support of the findings of Backiyalakshmi et al. (2021); Bastola et al. (2015); Bharathi (2011); Patel et al. (2017). This means the accessions with taller plant height and late maturity produced higher straw yield which is a very important trait for farmers who are growing livestock in their farm and use millet straw for feed.
Although finger millet is the fourth most important cereal in Nepal, its cultivation area has been shrinking over the last decade (MOALD, 2022). One of the reasons behind this is the limited options of high-yielding varieties accessible to farmers. Average grain yield in our research ranged from 230–3,494kg/ha but 15 accessions produced an average grain yield of more than 2,500kg/ha, which is comparable to commercial varieties. Research conducted byAnuradha et al. (2022) on Indian genotypes and byWolie and Belete (2012) on Ethiopian genotypes also reported some promising genotypes with more than 3,000kg/ha grain yield. Since Nepal is a member of the International Treaty on Plant Genetic Resources for Food and Agriculture (ITPGRFA), exotic high-yielding genetic resources through the Multilateral System could be introduced and used in crossings between Asian and African genotypes to develop high-yielding lines exploiting the wide genetic variability to improve finger millet productivity of the country.
Conclusion
We observed wide phenotypic variation within Nepalese finger millet landraces conserved at NAGRC for various qualitative and quantitative traits. We identified landraces with high potential for functional agronomic traits such as higher grain and straw yield, early maturity, bold grains, which could be utilized as trait-specific donors in paving the breeding pathway of finger millet. These selected landraces are currently being tested under national coordinated varietal trials by HCRP throughout the country. Furthermore, these landraces could be deployed to similar hilly environments without further delay to enrich the varietal options for finger millet-growing farmers of Nepal.
Acknowledgements
This research was funded by UNEP/GEF and technically coordinated by the Alliance of Bioversity International and CIAT. We acknowledge the logistic support received from NAGRC Lalitpur, HCRP Dolakha and ARS Jumla for the field experiments.
Authors' contribution
KHG conceived the idea, conducted the field experiments, analyzed the data and drafted the manuscript. All co-authors guided in the field experiment and contributed to writing and revising the manuscript.
Conflict of interest
We declare that there is no conflict of interest among authors regarding this work.
Supplemental data
Supplemental Table 1. List of the 300 finger millet accessions used in the study with their local names and collection sites. The accessions with asterisk (*) are released varieties whereas others are landraces.
Supplemental Table 2. Entry means of 300 finger millet accessions for 17 quantitative traits (combined over 6 environments). The accessions with asterisk (*) are released varieties whereas others are landraces. FD, days to flowering; MD, days to maturity; PHT, plant height; T/P, tillers per plant; LL, flag leaf length; LW, flag leaf width; SL, flag leaf sheath length; EE, ear exsertion; EL, ear head length; EW, ear head width; F/H, fingers per head; FL, length of the longest finger; FW, width of the longest finger; W/H, weight per head; TW, weight of 1000 grains; GY, grain yield; SY, straw yield.