Assessment of phenotypic and genetic variability in Nepalese cucumber (Cucumis sativus L.) accessions
Pradip Thapaa,*, Sandip Boharab, Subbechha Giric, Naturally KCc, Basanta Kumar Rimalc, Bal Krishna Joshia
a National Agriculture Genetic Resources Centre, Khumaltar, Lalitpur, Nepal
b Far Western University, Tikapur, Nepal
c Agriculture and Forestry University, Chitwan, Nepal
* Corresponding author: Pradip Thapa (pradip.thapa876@gmail.com)
Abstract: Nepal harbours a rich diversity of cucumber landraces adapted to diverse agroecological conditions, but their phenotypic diversity remains largely unexplored. Eleven cucumber accessions collected from ten districts of Nepal were characterized and evaluated at the research field of the National Agriculture Genetic Resources Centre. Twelve quantitative and 16 qualitative agromorphological traits were measured following the International Union for the Protection of New Varieties of Plants (UPOV) guidelines. Diversity was assessed using descriptive statistics, Shannon-Weaver diversity index, principal component analysis, clustering, heritability analysis and phenotypic path analysis. Qualitative traits exhibited low to very high diversity (H′ = 0.44–0.99), while quantitative traits showed low to high diversity (H′ = 0.21–0.71). The first three principal components explained nearly 70% of the total variation, with leaf length, days to first female flowering, days to first male flowering, fruit breadth, length of peduncle, fruit length, and total yield as major contributors. UPGMA clustering grouped the accessions into four clusters with 80% similarity level. Phenotypic path analysis indicated that fruit size, fruit breadth, fruit length, leaf width, distance between the nodes and peduncle thickness were key determinants of yield. High heritability was observed for days to first male flowering, peduncle length, and stem diameter. Accessions CO14392 and CO13634, characterized by high yield potential (14.98t/ha) and superior fruit dimensions, were identified as the most promising for breeding programmes. These findings provide a foundation for utilizing Nepalese cucumber landraces, with multi-location and multi-year evaluations, complemented by molecular characterization to fully exploit their potential.
Keywords: Agromorphological traits, Cluster dendrogram, Cucumber diversity, Landraces, PCA
Introduction
Cucumber (Cucumis sativus L. 2n = 2x = 14), a member of the most genetically diverse family Cucurbitaceae, is an annual trailing vegetable grown in both outdoor fields and protected conditions (Cebeci et al, 2020; Raza et al, 2020; Sharma et al, 2020). The primary centre of origin of cucumber is India, where its domestication occurred about 3,000 years ago (Whitaker and Davis, 1962; Renner et al, 2007; Sebastian et al, 2010). Cucumber farming spread from India to secondary diversity centers, including China (Sebastian et al, 2010), Western Asia, Northern Africa and Southern Europe (Bisht et al, 2004; Lv et al, 2012). Although the genus Cucumis includes more than 50 species, based on geographical origin and chromosome number, the genus is broadly represented by two major cultivated lineages into African (C. melo L., 2n = 2x = 24) and Asian (C. sativus L., 2n = 2x = 14) types (Kirkbride, 1993; Sebastian et al, 2010; Ahmed et al, 2022). Cucumber is classified into four types according to the domestication process: C. sativus var. hardwickii (wild cucumber), C. sativus var. xishuangbannanesis (semi-wild cucumber), C. sativus var. sikkimensis (Sikkim cucumber), and C. sativus var. sativus (cultivated cucumber) (Yang et al, 2012; Weng, 2021). C. hystrix is the sister species to C. sativus (Sebastian et al, 2010), whereas C. sativus var. hardwickii (Royle) Alef. is a progenitor and wild relative of cultivated cucumber (Staub et al, 1997; Bisht et al, 2004), and shows variation in qualitative and quantitative parameters (Naegele and Wehner, 2016).
Globally, it is cultivated in 3.5 million hectares with a production of 178.03 million tonnes in 2023 (FAOSTAT, 2024). The diverse agroclimatic conditions found in Nepal offer peculiar opportunities for cucumber cultivation. The crop has tremendous economic significance in Nepal, with 9,463 hectares of land under its cultivation, yielding 150,213 tonnes, with a productivity of 15.58 t/ha annually (MoALD, 2025). Cucumber is used in various forms, including salads, pickles, fresh snacks, sauces, juices, and as an ingredient in cooked meals (Khulakpam et al, 2015; Shah et al, 2016). Nutritionally, cucumber pulp (100g) contains 11.6g ash, 15.9g protein, 0.13g fat, 6.77g crude fibre, 52.7g carbohydrates, 0.6g protein, 13.9g calcium, 7.8mg iron, 15.1g sodium, 43.7g potassium, 2.49mg copper, 5.27mg zinc, 0.79mg manganese, 7.08g magnesium (Niyi et al, 2019). Despite its low-calorie content, it contains essential vitamins, minerals, phytochemicals and antioxidants (Chakraborty and Rayalu, 2021). A natural compound found in large amounts in cucumbers, called Cucurbitacin B (CuB), mainly functions as an apoptosis inducer in a variety of human cancer cells (Gao et al, 2014).
Genetic variation is a prerequisite for the improvement of any crop (Gaikwad et al, 2011; Chalbi et al, 2023). Diversity assessment assists plant breeders in recognizing and selecting the desirable traits, minimizing the challenges associated with parental selection, thereby facilitating the progression of generations (Chikh-Rouhou et al, 2023; Azam et al, 2024). A landrace is a dynamic population of cultivated crops with historical existence, unique identity, genetic diversity, and often lacking systematic crop enhancement (Villa et al, 2005). It is regionally adapted to tolerate both biological and environmental stresses, leading to stable yield, and is connected to traditional agriculture practices (Zeven, 1998). A diverse range of cucumber landraces, along with their wild relatives, exists in Nepal (Mainali and Jyakhwa, 2023), and it is critical to gather and conserve the existing landraces to prevent genetic erosion.
The extensive cultivation of exotic hybrid cucumber varieties is a serious threat to landraces, which harbour crucial genes tolerant to both abiotic and biotic stresses (Ahmed et al, 2022). The National Genebank of Nepal preserves 69 local landraces (Genebank, 2023) and the National Seed Board (NSB), Nepal, has released one open-pollinated variety (Kusle) and registered 24 cucumber varieties (SQCC, 2024). The released variety Kusle is characterized by a high male-to-female ratio, extended growth cycle, and higher disease susceptibility, resulting in lower yield (Gautam et al, 2021).
Only a limited number of studies have focused on the characterization and evaluation of cucumber landraces in Nepal (Shakya et al, 2006; Mainali and Jyakhwa, 2023). Therefore, the primary purpose of conducting this study was the characterization and evaluation of Nepalese cucumber landraces. Through the use of multivariate data analysis (principal component analysis (PCA), cluster dendrogram, phenotypic and genetic variability and heritability analysis), this study aims to provide valuable insights into the phenotypic diversity and agricultural potential of these landraces to be valorized in breeding programmes.
Materials and methods
Plant materials and experimental site
Ten cucumber accessions, collected from ten districts of Nepal (Table 1), along with one check variety, Bhaktapur Local, were characterized and evaluated at the research field of the National Agriculture Genetic Resources Center (NAGRC) in Khumaltar, Lalitpur, in 2024. The experimental site is located at an altitude of 1,368m a.s.l., with coordinates 27°40'N latitude and 85°20'E longitude. The check variety Bhaktapur Local is the best commercial variety registered in 2018 (MoALD, 2024). The experiment region receives 4.4 to 105.7mm of rainfall and experiences average temperatures of 15.2ºC (min) and 28.2ºC (max) (Genebank, 2023)(Figure 1). The soil type at the research site was black loamy (Ghimire and Magar, 2017).
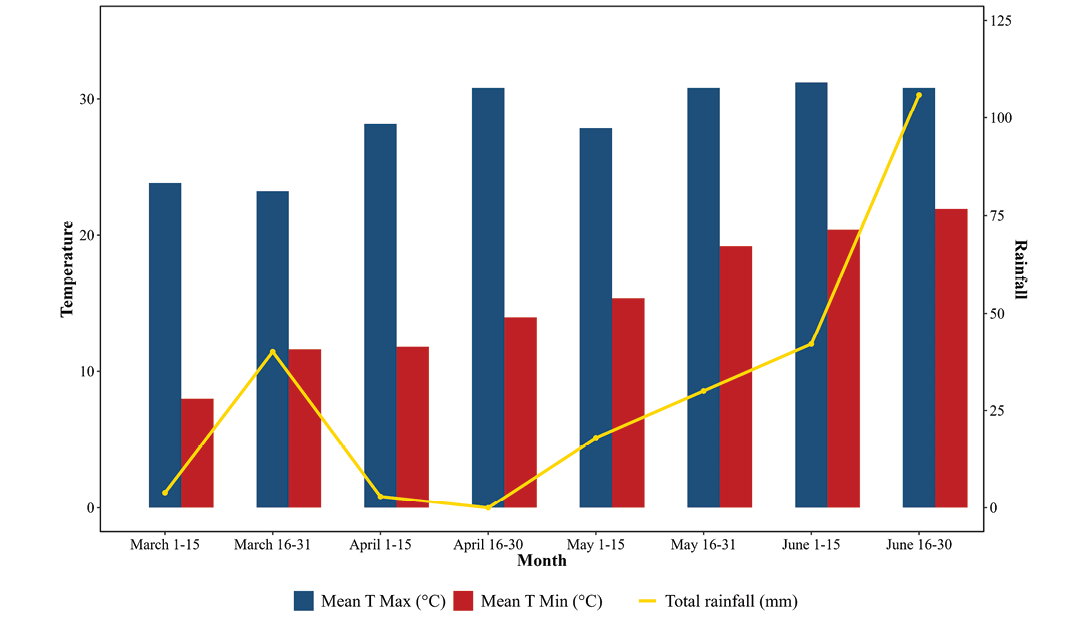
Table 1. Details of the accessions used in the experiment
|
Accession |
Type |
Collection district |
Collection location |
||
|
Altitude (m) |
Latitude |
Longitude |
|||
|
CO10293 |
Landrace |
Gulmi |
997 |
28.02 |
83.18 |
|
CO13538 |
Landrace |
Panchthar |
1,606 |
27.06 |
87.45 |
|
CO13634 |
Landrace |
Baitadi |
1,526 |
29.21 |
80.42 |
|
CO14242 |
Landrace |
Jajarkot |
1,706 |
28.41 |
82.13 |
|
CO14365 |
Landrace |
Gorkha |
1,101 |
27.59 |
84.39 |
|
CO14392 |
Landrace |
Gorkha |
1,063 |
27.58 |
84.40 |
|
CO14439 |
Landrace |
Jumla |
1,349 |
28.57 |
81.36 |
|
CO14589 |
Landrace |
Sindhupalchowk |
1,682 |
27.35 |
85.55 |
|
CO14765 |
Landrace |
Nuwakot |
1,005 |
27.54 |
85.05 |
|
SIRG-024 10CU |
Landrace |
Rasuwa |
1,385 |
28.00 |
85.12 |
|
Bhaktapur Local |
Commercial |
Lalitpur |
1,341 |
27.38 |
85.19 |
Seedling raising and transplanting
Seedlings were raised in polybags filled with farmyard manure (FYM) and soil mixture. Ten polybags were prepared, with three seeds sown per polybag. A total of 20 healthy seedlings were ultimately transplanted per accession per replication. The polybags were lightly irrigated and maintained under a low tunnel covered with a white polythene sheet for one month to ensure optimal temperature and rapid germination. After the emergence of true leaves (3–4 leaf stage), one-month-old seedlings were transplanted to the open field during late March to early April.
Experimental design
The accessions were planted in a randomized complete block design with three replications for agromorphological characterization and evaluation. An experiment was conducted from March to June 2024, using fertilizer at the rate of 140:40:100 NPK kg/ha along with 1.5t/ha FYM and recommended management practices (MoALD, 2024). The experimental plot measured 3m² (3m × 1m) with a spacing of 1.0m × 0.6m (RR × PP). Two seedlings were transplanted per hill. From each block, ten plants per accession were randomly selected for the measurement of quantitative traits.
Data collection
Morphological data of 16 qualitative (Supplemental Table 1) and 12 quantitative traits (Supplemental Table 2) were recorded using the standard descriptors for cucumber (UPOV, 2007). The qualitative traits were recorded based on the observation of descriptor states, whereas the quantitative traits were measured from selected sample plants.
Data analysis
The qualitative and quantitative data were recorded and entered into Microsoft Excel (2016). The quantitative data (Supplemental Table 3) were analyzed for descriptive statistics by using the pastecs package (Grosjean and Ibanez, 2002) in R Studio (4.4.3) (R Core Team, 2025). The qualitative data were analyzed by using the package summary tools (Comtois, 2014). Shannon’s Weaver diversity index (H’) (Shannon, 1948) was calculated by using the formula in Microsoft Excel. For both quantitative and qualitative traits, the data were classified into nine intervals, and the resulting diversity indices were categorized into four classes: low (0.1–0.4), intermediate (0.4–0.6), high (0.6–0.8), and very high (>0.8), as described by Eticha et al (2006). PCA was prepared by using the package factoextra (Kassambara and Mundt, 2016), factominor (Husson et al, 2006) and gridextra (Auguie, 2010). The estimates of genetic parameters – genotypic variance (GV), phenotypic variance (PV), genotypic coefficient of variance (GCV), phenotypic coefficient of variance (PCV), heritability (H2bs), genetic advance as a percentage of mean (GAM) – were calculated by using the variability package (Popat et al, 2020), whereas phenotypic path analysis was done using metan package (Olivoto and Lúcio, 2020) in R Studio. The optimum number of clusters was determined by using the factoextra (Kassambara and Mundt, 2016) package. The hierarchical cluster dendrogram was created by using denextend (Galili and Jefferis, 2014) and the circilize (Zuguang Gu, 2024) package.
Results
Quantitative data analysis
Descriptive statistics and Shannon-Weaver diversity indices for 12 quantitative traits are presented in Table 2. Considering the entire group of accessions, the coefficient of variation ranged from 6.24% to 22.92%, indicating a very low to high variability among quantitative traits (> 20%). Shannon–Weaver’s diversity index ranges from 0.21–0.71, showing a very low to moderate level of diversity among the accessions for quantitative traits. Intra-accession variability was also observed, indicating that some accessions contained noticeable heterogeneity within the same accession.
Among the evaluated traits, days to first male flowering ranged from 72 to 91 days, with a mean of 78.64 days, with a very low coefficient of variation (CV) of 7.91% and a moderate Shannon-Weaver diversity index (H’) of 0.57. Similarly, days to first female flowering spanned from 81 to 100 days, with an average of 89.09 days, and showed relatively very lower variability (CV = 6.24%) but had the highest diversity index among other variables (H’ = 0.71). Regarding fruit characteristics, fruit length varied between 28.20cm and 34.50cm, averaging 31.50cm. The trait displayed very low variation (CV = 7.33%) and Shannon Weaver index (H’ = 0.43). In contrast, fruit breadth ranged from 13.05cm to 18.37cm, with a mean value of 15.67cm. The CV for fruit breadth was 8.92%, accompanied by an H’ value of 0.57. Total yield per hectare exhibited a wide range from 9.40t/ha to 16.07t/ha, with a mean yield of 11.43t/ha. Notably, this trait had a moderate (CV = 17.95%), reflecting considerable moderate yield variability among the accessions. However, the Shannon-Weaver index was the lowest (H’ = 0.21) among traits.
Table 2. Descriptive statistics of the cucumber accessions. Min, minimum; Max, maximum; SEm, standard error of mean; SD, standard deviation; CV, coefficient of variation; H’, notation for Shannon-Weaver diversity index.
|
Variables |
Min |
Max |
Mean± SEm |
SD |
CV (%) |
H' |
|
Days to first male flowering |
72 |
91 |
78.64±1.87 |
6.22 |
7.91 |
0.57 |
|
Days to first female flowering |
81 |
100 |
89.09±1.68 |
5.56 |
6.24 |
0.71 |
|
Length of petiole (cm) |
9.03 |
16.63 |
12.85±0.76 |
2.52 |
19.64 |
0.67 |
|
Leaf length (cm) |
12.20 |
17.87 |
14.48±0.50 |
1.66 |
11.44 |
0.50 |
|
Leaf width (cm) |
14.17 |
23.60 |
17.50±0.77 |
2.55 |
14.59 |
0.29 |
|
Stem diameter (mm) |
4.70 |
6.56 |
5.64±0.19 |
0.63 |
11.10 |
0.67 |
|
Distance between nodes (cm) |
9.80 |
14.70 |
11.39±0.45 |
1.48 |
13.02 |
0.58 |
|
Length of peduncle (cm) |
2.20 |
4.90 |
3.30±0.23 |
0.76 |
22.92 |
0.57 |
|
Peduncle thickness (mm) |
1.88 |
3.98 |
2.87±0.18 |
0.60 |
20.95 |
0.61 |
|
Fruit length (cm) |
28.20 |
34.50 |
31.50±0.70 |
2.31 |
7.33 |
0.43 |
|
Fruit breadth (cm) |
13.05 |
18.37 |
15.67±0.42 |
1.40 |
8.92 |
0.57 |
|
Total yield (t/ha) |
9.40 |
16.07 |
11.43±0.62 |
2.05 |
17.95 |
0.21 |
Qualitative data analysis
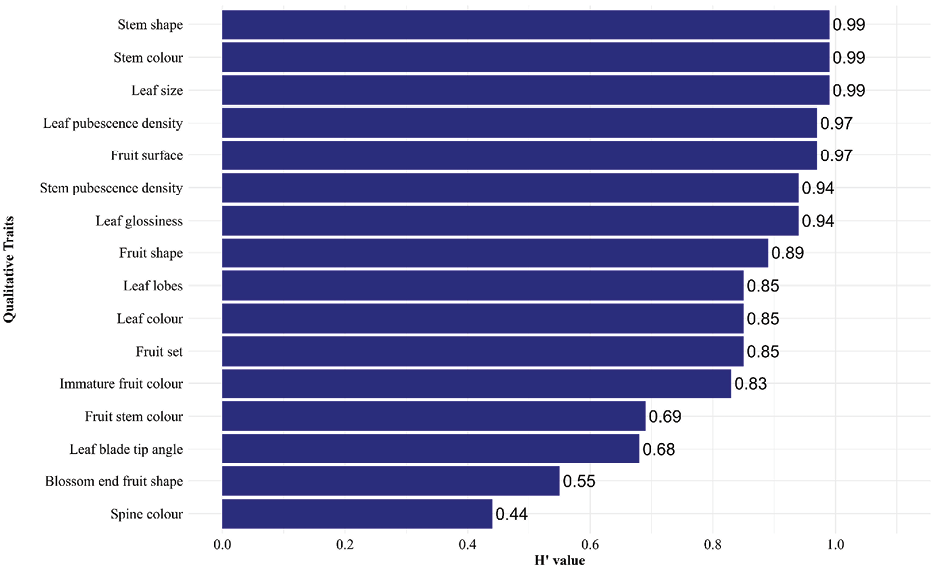
The Shannon–Weaver diversity index (H′) among the cucumber accessions ranged from 0.44 to 0.99 (Figure 2), indicating low to very high diversity. Very high diversity (>0.80) was recorded for stem shape, stem colour, leaf size, leaf pubescence density, fruit surface, stem pubescence density, leaf glossiness, fruit shape, leaf lobes, leaf colour, fruit set, and immature fruit colour. Traits such as; fruit stem colour, leaf blade tip angle and blossom end fruit surface show the medium diversity (0.40-0.60). Only a single trait, spine colour showed low (0.10-0.40) diversity among the accessions.
Leaf brightness was mainly intermediate (45.45%), with fewer accessions showing dull or acute leaves. The leaf blade angle was largely acute (81.82%) while obtuse blades occurred less frequently. Leaf lobing was mostly intermediate (72.73%) and strongly lobed forms were comparatively rare. Leaf colour was predominantly light green (72.73%), with green types accounting for 27.27% (Figure 3a). Leaf pubescence density was generally intermediate (45.45%), while sparse and dense pubescence occurred less commonly. Leaf size was mainly large, followed by intermediate-sized leaves. Stem colour was largely uniform, being dominated by intermediate shades, with lighter colours also present. Stem pubescence density was most often intermediate, though dense pubescence was also common, and sparse pubescence occurred infrequently (Figure 3b). Stem shape was primarily angular (54.55%), though round stems were also well represented. Immature fruit colour was mainly green (63.64%), while light green and whitish green types each constituted 18.18%. Fruit surface texture was largely smooth, followed by ridged and rough surfaces. Spine colour was highly uniform, being dominated by whitish green spines, while other colours were rare (Figure 3c). Fruit size was mostly medium, with smaller fruits occurring less frequently.
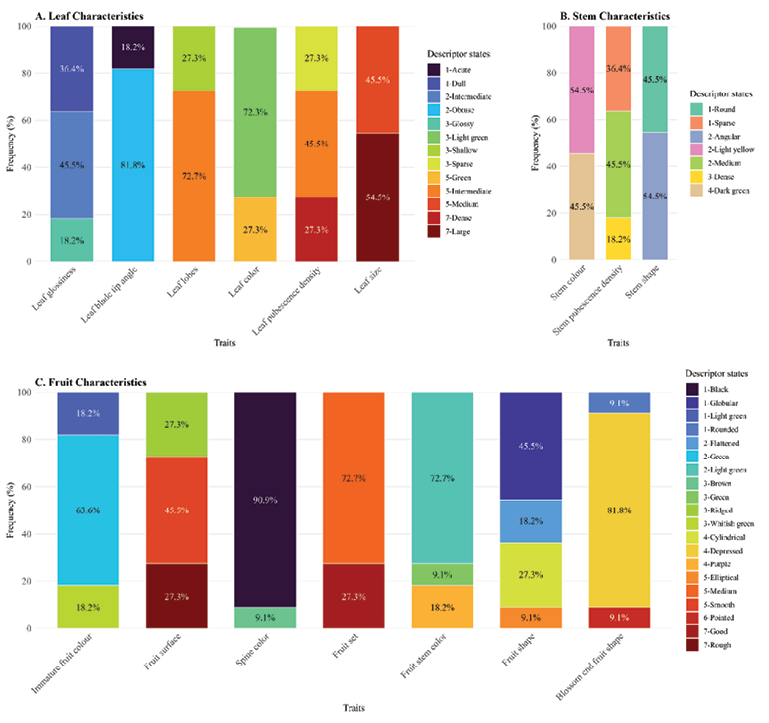
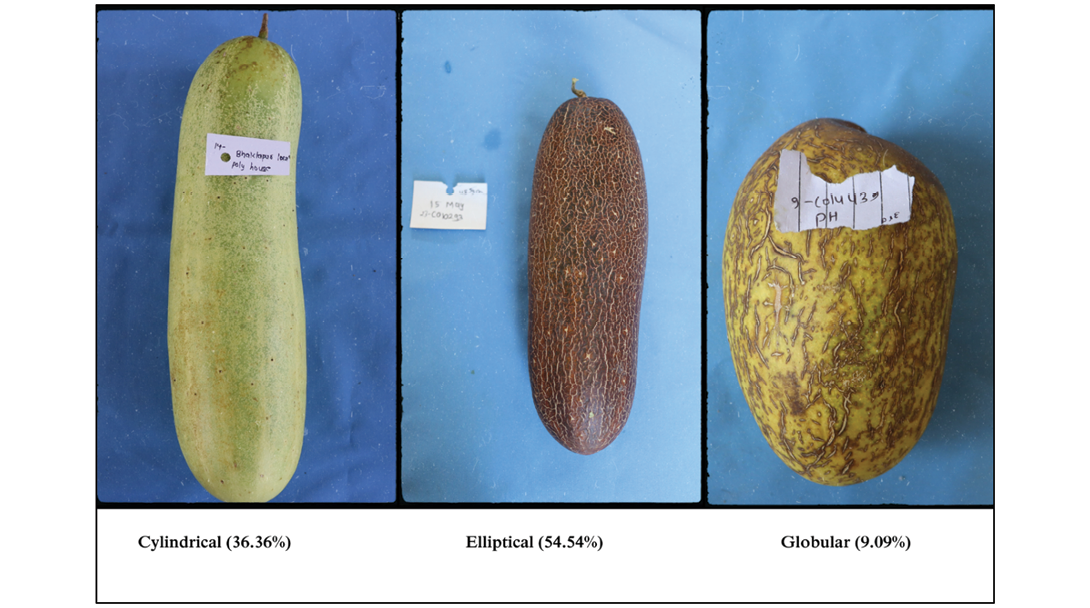
Fruit stem colour was predominantly light green, with green and intermediate shades observed in fewer accessions. Blossom-end fruit shape was largely depressed, with pointed and medium forms occurring only rarely (Figure 3c). Fruit shape was mainly elliptical (54.54%), followed by cylindrical (36.36%) and globular (9.09%) (Figure 4).
Principal component analysis
PCA identifies key traits contributing most to genetic variation and assists breeders in improving traits with low heritability, particularly in early generations (Golparvar et al, 2006; Ahmadizadeh and Felenji, 2011). Dimension-1 contributed 37.9% of the total variance, followed by dimension-2 with 17.5% variance, and cumulatively explained 55.48% of the total phenotypic variation (Figure 5). Traits such as leaf length (LW), leaf width (LW), length of petiole (LOP), distance between nodes (DBN), fruit length (FL), total yield (TY), fruit breadth (FB), stem diameter (SD), and peduncle thickness (PT) are positively associated with PC1, indicating that these traits contribute strongly to variation along this axis. Days to first male flowering (DTFMF) and days to first female flowering (DTFFF) load negatively on PC1, showing an inverse relationship with yield and growth-related traits. Length of peduncle (LPD) shows a strong negative loading on PC2, suggesting it contributes mainly to variation along the second axis. Accessions such as CO10293, CO13634 and CO14392 are positioned in the direction of yield and growth-related traits, indicating superior performance for these traits. CO14765 and CO13538 are associated with delayed flowering traits (DTFFF, DTFMF). Bhaktapur Local is closely associated with LPD, suggesting higher expression of this trait. SIRG-024-10CU lies far from most trait vectors, indicating distinct performance or divergence from other landraces.
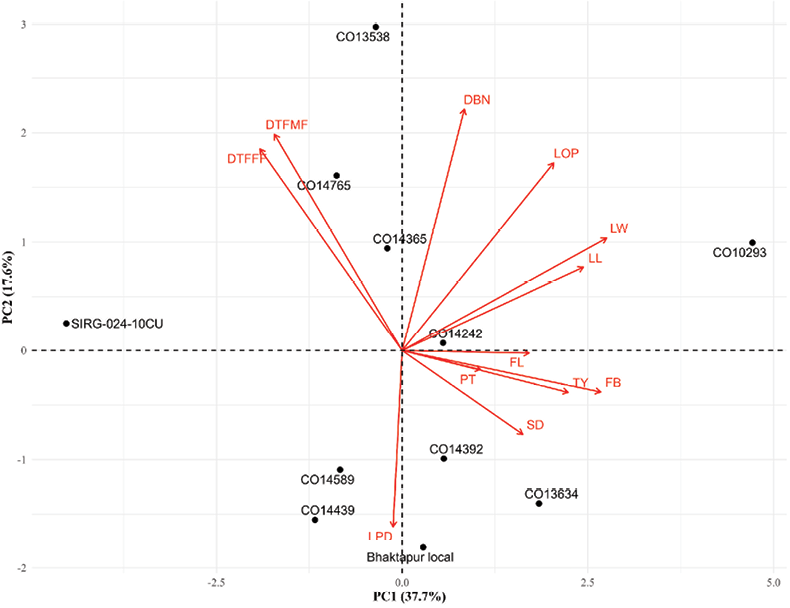
Figure 5. PCA-Biplot of Nepalese cucumber accessions. Red arrows represent trait vectors, and black points indicate specific accessions. The direction and length of each arrow reflect the correlation and relative contribution of each trait to the principal components, respectively. DTFMF: Days to first male flowering; DTFFF: Days to first female flowering; LOP: Length of petiole (cm); LL: Leaf length (cm); LW: Leaf width (cm); SD: Stem diameter (mm); DBN: Distance between nodes (cm); LPD: Length of peduncle (cm); PT: Peduncle thickness (mm); FL: Fruit length (cm); FB: Fruit breadth (cm), and TY: Total yield (t/ha).
Table 3 presents the eigenvalues, percentage of variance explained, cumulative variance and the coefficient (loading) vectors of each variable for the first three principal components (PCs). The first three PCs, cumulatively explaining ~70% of the total variation (PC1, 37.9%; PC2, 17.6%; PC3, 14.5%). PC1 was mainly shaped by traits related to plant size and productivity. Leaf width (0.41) and fruit breadth (0.41) contributed the most, along with leaf length (0.36), total yield (0.36) and petiole length (0.30). Overall, this component captured differences in leaf morphology and fruit size among the accessions. PC2 reflected variation more closely linked to flowering behaviour and plant structure. The distance between nodes (0.50) had the strongest influence, followed by days to first male flowering (0.43), days to first female flowering (0.39), petiole length (0.39) and peduncle length (0.35). These traits together highlight differences in how plants grow and transition to flowering. PC3 was strongly shaped by fruit length (0.48) and peduncle length (0.47). Total yield (0.32) also contributed to this component. This suggests that PC3 mainly differentiated accessions based on fruit elongation and key reproductive phenological traits. PCA indicated that traits such as leaf length, days to first female flowering, days to male first flowering, fruit breadth, length of peduncle, fruit length, total yield and leaf length had the highest loadings across the first three components, demonstrating their major contribution to the phenotypic variation observed among the Nepalese cucumber accessions.
Table 3. Contribution percentage and major characters associated with the first three principal components (PCs), of cucumber accessions, along with their eigenvectors.
|
Dimensions |
PC-1 |
PC-2 |
PC-3 |
|
Eigenvalue |
4.55 |
2.11 |
1.74 |
|
Variance (%) |
37.93 |
17.55 |
14.49 |
|
Cumulative variance (%) |
37.93 |
55.48 |
69.97 |
|
Variables |
Coefficient vectors |
||
|
Days to first male flowering |
-0.266 |
0.434 |
0.326 |
|
Days to first female flowering |
-0.293 |
0.395 |
0.276 |
|
Length of petiole (cm) |
0.306 |
0.392 |
-0.114 |
|
Leaf length (cm) |
0.369 |
0.16 |
0.113 |
|
Leaf width (cm) |
0.414 |
0.229 |
0.105 |
|
Stem diameter (mm) |
0.244 |
-0.158 |
-0.262 |
|
Distance between nodes (cm) |
0.122 |
0.508 |
-0.174 |
|
Length of peduncle (cm) |
-0.019 |
-0.352 |
0.471 |
|
Peduncle thickness (mm) |
0.16 |
-0.055 |
0.301 |
|
Fruit length (cm) |
0.258 |
-0.015 |
0. 482 |
|
Fruit breadth (cm) |
0.404 |
-0.084 |
-0.175 |
|
Total yield (t/ha) |
0.335 |
-0.078 |
0.327 |
A dendrogram was constructed by using the unweighted pair group method with arithmetic mean (UPGMA) or average clustering method based on Euclidean distance across the 11 cucumber accessions (Figure 6). The average silhouette method identified a total of 4 clusters at 80% level of similarity. The cophenetic correlation approach identifies the best clustering, with higher values indicating a more accurate representation of original distances (Saraçli et al, 2013). The average method with a maximum cophenetic correlation (0.82) suggests an accurate depiction of the cluster. Cluster analysis grouped the accessions into 4 clusters based on 12 quantitative traits. Cluster I is represented by red colour, Cluster II by green, Cluster III by blue, whereas Cluster IV is represented by purple. Clusters I, II, III and IV consist of two, four, four and one accessions, respectively (Figure 6 and Table 4).
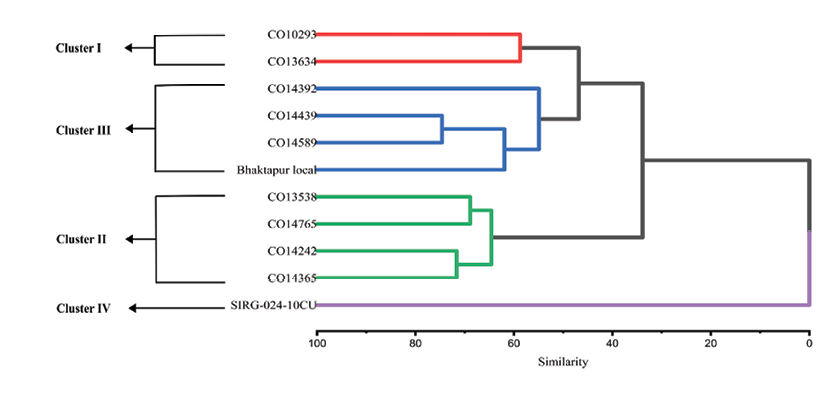
Table 4. Cluster characteristics of cucumber accessions evaluated for 12 quantitative traits. *, significant (p ≤ 0.05); **, highly significant (p ≤ 0.01); ***, very highly significant (p ≤ 0.001); ns, not significant (p > 0.05).
|
Cluster |
I |
II |
III |
IV |
Significance |
|
Number of Accessions |
2 |
4 |
4 |
1 |
|
|
Days to first male flowering |
75.50 |
82.67 |
72.83 |
91.33 |
** |
|
Days to first female flowering |
84.67 |
92.33 |
85.75 |
99.67 |
* |
|
Length of petiole(cm) |
15.49 |
14.05 |
11.27 |
9.03 |
** |
|
Leaf length (cm) |
15.80 |
14.94 |
13.94 |
12.20 |
ns |
|
Leaf width (cm) |
20.99 |
18.08 |
16.01 |
14.17 |
** |
|
Stem diameter (mm) |
6.54 |
5.23 |
5.67 |
5.38 |
ns |
|
Distance between nodes (cm) |
11.98 |
12.31 |
10.58 |
9.80 |
* |
|
Length of peduncle (cm) |
3.69 |
3.15 |
3.19 |
3.60 |
*** |
|
Peduncle thickness (mm) |
3.09 |
2.84 |
2.87 |
2.53 |
ns |
|
Fruit length (cm) |
32.52 |
32.01 |
31.12 |
28.93 |
* |
|
Fruit breadth (cm) |
17.13 |
15.28 |
15.96 |
13.05 |
* |
|
Total yield (t/ha) |
14.98 |
10.97 |
10.64 |
9.40 |
* |
Cluster analysis revealed clear and structured phenotypic differentiation among the cucumber accessions. Cluster I comprised two accessions (CO10293 and CO13634) and was distinguished by superior yield potential (14.98 t/ha; TY) coupled with vigorous vegetative growth, as reflected by significantly larger leaf width (LW). In contrast, Cluster II grouped four accessions (CO13538, CO14242, CO14365 and CO14765) and was characterized by significantly delayed flowering (DTFMF, DTFFF), moderate petiole length (LOP), intermediate stem diameter (SD ns), fruit length comparable to Cluster I (FL), and moderate yield performance (TY). Cluster III also consisted of four accessions (CO14439, CO14589, Bhaktapur Local and CO14392) and exhibited relatively earlier flowering behavior (DTFMF, DTFFF), moderate stem diameter (SD ns), and reduced fruit size (FL, FB), which was associated with a comparatively lower yield (TY) than Clusters I and II. Cluster IV contained a single accession (SIRG-024-10CU), which remained isolated and merged with other clusters at a very low similarity coefficient, indicating maximum phenotypic divergence (Table 5). This accession was characterized by markedly late flowering (DTFMF, DTFFF), significantly reduced vegetative traits (LOP, LW), and the lowest yield performance (TY).
Table 5. Cluster centroid distance
|
Cluster1 |
Cluster2 |
Cluster3 |
Cluster4 |
|
|
Cluster1 |
0 |
8.918 |
11.974 |
25.377 |
|
Cluster2 |
8.918 |
0 |
12.555 |
23.731 |
|
Cluster3 |
11.974 |
12.555 |
0 |
14.158 |
|
Cluster4 |
25.377 |
23.7308 |
14.158 |
0 |
Phenotypic path analysis
Phenotypic path coefficient analysis was conducted to decompose the correlation coefficients into direct and indirect effects, aiming to determine the key traits influencing total yield. Total yield (TY) was used as the dependent variable to assess the direct and indirect contributions of the 11 associated traits, as illustrated in Figure 7. The peduncle thickness (0.522), leaf width (0.414), length of peduncle (0.408), length of petiole and stem diameter showed a high positive direct effect, suggesting that larger vegetative and fruit traits favour yield (Lenka and Misra, 1973). The fruit length (FL) exhibited a moderate positive direct effect (0.260) on yield, indicating that longer fruits contribute significantly to higher total yield. In contrast, fruit breadth (FB) and leaf length (LL) had negative direct effects (-0.275 and -0.365 respectively), implying that early flowering increases yield by extending the total duration of the reproductive phase. Interestingly, although fruit breadth (FB) and leaf length (LL) showed negative direct effects, their total phenotypic correlations with yield were positive, indicating that their overall positive influence is mediated through positive indirect effects on other yield components.
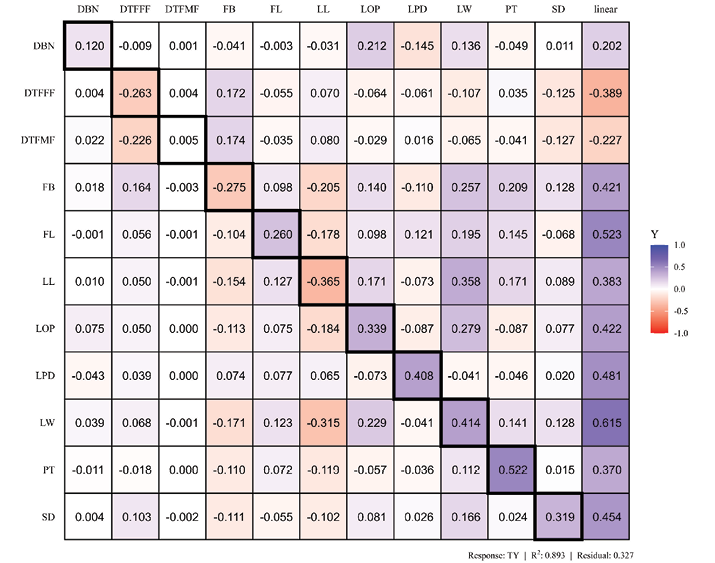
Figure 7. Heatmap showing the phenotypic path analysis of 11 quantitative traits on total yield. Diagonal values (bold boxes) represent direct effects and off-diagonal values represent indirect effects on total yield (TY). The linear column indicates total Pearson correlation. The color-coded scale indicates the nature of these relationships, with blue representing a positive effect and red representing a negative effect, while the color intensity reflects the magnitude of the impact. DTFMF, days to first male flowering; DTFFF, days to first female flowering; LOP, length of petiole (cm); LL, leaf length (cm); LW, leaf width (cm); SD, stem diameter (mm); DBN, distance between nodes (cm); LPD, length of peduncle (cm); PT, peduncle thickness (mm); FL, fruit length (cm); FB, fruit breadth (cm); TY, total yield (t/ha).
The model showed a high coefficient of determination (R2 = 0.893) and a residual effect of 0.327, indicating that 89.3% of the variation in cucumber yield is explained by the traits included in the study. Overall, traits related to fruit size, fruit breadth, fruit length, leaf width, stem diameter, peduncle thickness, length of petiole, length of peduncle and distance between the nodes were key contributors to yield enhancement, whereas early flowering traits exerted minor negative influences.
Genetic variability and heritability
GCV and PCV are considered ideal criteria for measuring variability (Yadav et al, 2021). The estimates of genetic variability parameters for 12 quantitative traits of cucumber revealed that phenotypic variance was higher than genotypic variance for all traits, indicating the influence of environmental factors on trait expression (Table 6). Moderate to high GCV and PCV were observed for length of peduncle, length of petiole, total yield, stem diameter and days to first male flowering, suggesting the presence of substantial variability among the accessions. Days to first male flowering, stem diameter and length of peduncle exhibited relatively high heritability (0.84, 0.70, and 0.73, respectively) along with moderate to high genetic advance as a percentage of mean, indicating the predominance of additive gene action and good prospects for improvement through direct selection. In contrast, traits such as leaf length, peduncle thickness, fruit length and fruit breadth showed low heritability and low genetic advance, reflecting strong environmental influence and limited response to selection. Total yield per hectare showed moderate genetic variability but low heritability, suggesting that yield is a complex trait influenced by multiple components and environmental conditions; therefore, indirect selection through yield-related traits with higher heritability would be more effective for genetic improvement in cucumber.
Table 6. Estimates of genetic parameters of cucumber accessions. GV, genotypic variance; PV, phenotypic variance; GCV, genotypic coefficient of variance; PCV, phenotypic coefficient of variance; H2bs, heritability; GAM, genetic advance as a percentage of mean.
|
Traits |
GV |
PV |
GCV (%) |
PCV (%) |
H2bs |
GAM (%) |
|
Days to first male flowering |
37.48 |
44.49 |
7.79 |
8.49 |
0.84 |
14.73 |
|
Days to first female flowering |
24.92 |
38.56 |
5.59 |
6.96 |
0.64 |
9.26 |
|
Length of petiole (cm) |
4.66 |
9.76 |
16.80 |
24.32 |
0.47 |
23.92 |
|
Leaf length (cm) |
0.92 |
6.38 |
6.62 |
17.44 |
0.14 |
5.18 |
|
Leaf width (cm) |
4.15 |
11.27 |
11.63 |
19.18 |
0.36 |
14.54 |
|
Stem diameter (mm) |
0.34 |
0.48 |
10.44 |
12.31 |
0.70 |
18.25 |
|
Distance between nodes (cm) |
1.43 |
3.74 |
10.50 |
16.97 |
0.38 |
13.38 |
|
Length of peduncle (cm) |
0.52 |
0.69 |
21.65 |
25.25 |
0.73 |
38.25 |
|
Peduncle thickness (mm) |
0.10 |
0.86 |
11.54 |
32.39 |
0.12 |
8.47 |
|
Fruit length (cm) |
3.34 |
9.30 |
5.80 |
9.68 |
0.35 |
7.16 |
|
Fruit breadth (cm) |
1.21 |
3.43 |
7.02 |
11.83 |
0.35 |
8.59 |
|
Total yield (t/ha) |
2.48 |
7.83 |
13.55 |
24.48 |
0.30 |
15.46 |
Discussion
The present study revealed a wide range of diversity in both qualitative and quantitative traits as evidenced by Shannon-Weaver diversity index (Eticha et al, 2006). Very high diversity indices of economically important qualitative parameters, such as fruit shape and fruit set, indicate the opportunities for selection during crop improvement (Perry and McIntosh, 1991). Immature fruit colour is an important marketing trait in Nepalese cucumber. In our study, most of the accessions (63.64%) had green fruit colour. Ahmed et al (2022) have also found a similar variation in fruit colour, with green dominating (65.05%) among seven different colours. The intermediate leaf glossiness (45.45%) and medium pubescence density (45.45%) were predominant among the accessions. Both traits function as defensive features that reduce insect pest incidence through lowered palatability and mechanical deterrence (War et al, 2012; Zhang et al, 2012). In our study, most accessions exhibited elliptical fruit shape, followed by cylindrical shape. A similar result was reported by Suma et al (2021) with predominantly elongate fruit shapes among Indian landraces, with only a few globular types. The elliptical–elongate form is highly preferred by consumers as it yields a greater number of slices per fruit, making it particularly suitable for salad preparation.
The evaluated accessions also showed wide variation in leaf traits. In this study, CO10293 exhibited the largest leaf dimensions. A larger leaf area generally enhances light interception and photosynthate production, contributing to higher yields (Verma et al, 2020; Mainali and Jyakhwa, 2023). Yield performance may also be influenced by other traits such as source–sink dynamics, fruiting efficiency and genetic potential of the genotype (Wang et al, 2018). A considerable variation was observed for days to female flowering (81–100 days), which is an important indicator of earliness in cucumber production (Shah et al, 2016). Bhaktapur Local (control variety) exhibited the earliest anthesis, which was followed by accession CO14439, consistent with male flowers emerging earlier than female to ensure pollen availability (Gaikwad et al, 2011; Pusphalatha et al, 2016; Valcárcel et al, 2018). In contrast, flowering was late in the SIRG-024-10CU accession. Such accession is useful for extending harvest periods and season-long market supply (Ranjan et al, 2019). Differences in flowering onset may reflect genetic factors (Pusphalatha et al, 2016; Ahirwar et al, 2017; Owino et al, 2020), hormonal balance, seed vigour and soil fertility (Shah et al, 2016). Environmental factors such as temperature, light intensity and photoperiod are also known to influence flowering in cucumber (Thiruvengadam and Chung, 2014; Lewandowska-Sabat et al, 2017). Fruit length was notably superior in accessions CO14392 and CO14365, whereas CO10293 exhibited the greatest fruit breadth. Fruit width is a key trait influencing both yield potential and fruit quality. The wide variation observed in fruit diameter among accessions likely reflects underlying genetic differences, variations in hormonal regulation, and overall plant vigour. Fruit size is a critical determinant of marketability, consumer preference and overall crop value (Chikh-Rouhou et al, 2019; Ilahy et al, 2020; Ni et al, 2024). Farmers commonly favour long-fruited accession due to their association with higher yield potential (Baniya et al, 2006). Excessively large fruits are prone to carpel separation, which adversely affects fruit quality and reduces consumer acceptance (Subedi et al, 2024). Variations in cucumber fruit size and shape are primarily influenced by fruit cell number and hormonal regulation during ovary and fruit development (Gillaspy et al, 1993; Tanksley, 2004; Liu et al, 2020). A strong positive relationship between fruit traits (length and breadth) and yield per plant has also been reported (Diouf et al, 2023; Mainali et al, 2023). Breeders should prioritize these key traits, along with increased fruit count and larger fruit diameter, to enhance yield potential (Arunkumar et al, 2011; Chikh-Rouhou et al, 2024).
PCA is a multivariate method that simplifies complex, interrelated quantitative data by converting it into a reduced set of uncorrelated principal components, thereby revealing patterns and relationships among variables and observations (Abdi and Williams, 2010). PCA revealed that the Nepalese cucumber landraces exhibited substantial phenotypic variation. Traits such as leaf length, leaf width, fruit breadth, fruit length, peduncle length, days to first male and female flowering, and total yield were the most contributing traits for developing variation. A cluster dendrogram displays how closely related different genotypes are, helping breeders identify genetically diverse groups for selection and hybridization (Mohammadi and Prasanna, 2003). Cluster analysis revealed distinct phenotypic diversity among cucumber landraces: Cluster I was characterized by high yield; Cluster II by late maturity, longer petioles and greater internode length; Cluster III by earliness, early flowering, smaller leaves and shorter petioles; and Cluster IV by very late flowering. These distinct traits highlight potential sources for breeding programmes targeting high yield, early maturity, or compact plant architecture.
Phenotypic path analysis identified leaf width, peduncle length and fruit length as major contributors to total yield, exhibiting strong positive effects. These results indicate that selection for wider and longer fruits, larger leaves, optimal internode spacing and thicker peduncles can effectively enhance yield. Consequently, breeding programmes should prioritize these traits when selecting parent lines for the development of high-yielding cucumber varieties. In our study, PCV exceeded GCV for all traits, suggesting the strong influence of environmental factors (Gaikwad et al, 2011; Chalbi et al, 2023), whereas the small differences between GCV and PCV indicate a greater influence of genotype on the expression of a particular trait. High heritability was found for traits like days to first male flowering, length of peduncle and stem diameter, which is due to the additive genetic effects (Gaikwad et al, 2011; Johnson et al, 1955). High broad-sense heritability (H2bs) and genetic advance (GAM) found for the days to first male flowering, stem diameter and peduncle length suggested being more effective for selection. Traits expressing both high heritability and GAM, along with yield-contributing traits such as total yield, plant height and leaf length, should be emphasized in cucumber improvement programmes (Veena et al, 2012; Pushpalatha et al, 2016).
Conclusion
The Nepalese cucumber accessions exhibited substantial agromorphological variation, underscoring their potential for genetic improvement. Subsistence and commercial farmers in Nepal place greater emphasis on traits such as early flowering, higher fruit number and longer and wider fruits for market acceptance. Accordingly, breeders should prioritize accessions such as CO10293, CO14392 and CO13634 for their superior fruit dimensions and yield potential. Multivariate analysis highlighted key traits and superior parents for hybridization, with the observed phenotypic diversity providing valuable opportunities for yield improvement, selection and conservation. To fully exploit this variability, multi-location and multi-year evaluations, complemented by molecular characterization, are recommended.
Supplemental Table 1. Morphological qualitative traits observed and their descriptive states
Supplemental Table 2. Morphological quantitative traits observed with descriptive states
Supplemental Table 3. Raw data of 12 quantitative traits recorded across replications of cucumber landraces
Acknowledgements
We would like to thank the National Agriculture Genetic Resources Centre, Genebank, Khumaltar, Lalitpur, for providing all the support for conducting the research.
Author contributions
Pradip Thapa was responsible for conceptualization, investigation, methodology and writing the original draft. Sandip Bohara contributed to data curation, formal analysis, software development and reviewing and editing the manuscript. Subechha Giri, Naturally K.C., and Basanta Kumar Rimal were involved in methodology and writing the original draft. Dr Bal Krishna Joshi oversaw project administration, supervision and validation.
Conflict of interest statement
We declare that there is no conflict of interest among the authors regarding this research work.
This research did not receive any specific grant from funding agencies in the public, commercial, or not-for-profit sectors.
References
Abdi, H. and Williams, L. J. (2010). Principal component analysis. Wiley interdisciplinary reviews: computational statistics 2(4), 433-459. https://doi.org/10.1002/wics.101
Ahirwar, C. S., Singh, D. K., and Kushwaha, M. L. (2017). Assessment of genetic divergence in cucumber (Cucumis sativus L.) germplasm through clustering and principal component analysis. Journal of Pharmacognosy and Phytochemistry, 6(5), 804-807.
Ahmadizadeh, M., and Felenji, H. (2011). Evaluating diversity among potato cultivars using agro-morphological and yield components in fall cultivation of Jiroft area. American-Eurasian Journal of Agricultural & Environmental Sciences 11(5), 655-662.
Ahmed, I., Rohman, M. M., Hossain, M. A., Molla, M. R., Azam, M. G., Hasan, M. M., ... and Hossain, A. (2022). A study on the phenotypic variation of 103 cucumber (Cucumis sativus L.) landraces for the development of desirable cultivars suitable for the changing climate. Life 12(8), 1235. https://doi.org/10.3390/life12081235
Arunkumar, K. H., Ramanjinappa, V., and Hugar, A. (2011). Association of yield and yield components in F2 population of cucumber (Cucumis sativus L.). Plant Archives 11(1), 457-459.
Auguie, B., Antonov, A., and Auguie, M. B. (2017). Package ‘gridExtra’. Miscellaneous functions for “grid” graphics, 9. https://doi.org/10.32614/CRAN.package.gridExtra
Azam, M. G., Sarker, U., Hossain, M. A., Mahabubul Alam, A. K. M., Islam, M. R., Hossain, N., and Alamri, S. (2024). Phenotypic diversity in qualitative and quantitative traits for selection of high yield potential field pea genotypes. Scientific Reports, 14(1), 18561. https://doi.org/10.1038/s41598-024-69448-7
Baniya, B., Joshi, B., Barjracharya, J., Yadav, R., Tiwari, R., Shrestha, P., Gauchan, D., and Shrestha, P. (2006). On-farm diversity management of sponge gourd, cucumber and buckwheat in Nepal. In On-farm Management of agricultural biodiversity in Nepal: Lessons learned, eds. B. Sthapit and D. Gauchan (Proceedings of national symposium), 64-73. http://www.plantarchives.org/
Bisht, I. S., Bhat, K. V., Tanwar, S. P. S., Bhandari, D. C., Joshi, K., & Sharma, A. K. (2004). Distribution and genetic diversity of Cucumis sativus var. hardwickii (Royle) Alef in India. The Journal of Horticultural Science and Biotechnology 79(5), 783-791. https://dx.doi.org/10.1080/14620316.2004.11511843
Cebeci, E., Gozen, V., Keskin, L., and Yildirim, A. (2020). Morphologic and molecular assessments of cucumber (Cucumis sativus L.) landraces. Notulae Botanicae Horti Agrobotanici Cluj-Napoca, 48(2), 604-614. https://doi.org/10.15835/nbha48211932
Chakraborty, S., and Rayalu, S. (2021). Health beneficial effects of cucumber. In Cucumber Economic Values and its Cultivation and Breeding, ed. H. Wang (Intech Open), 99-107. https://doi.org/10.5772/intechopen.87508
Chalbi, A., Chikh-Rouhou, H., Mezghani, N., Slim, A., Fayos, O., Bel-Kadhi, M. S., Garcés-Claver, A. (2023). Genetic Diversity Analysis of Onion (Allium cepa L.) from the Arid Region of Tunisia Using Phenotypic Traits and SSR Markers. Horticulturae 9, 1098. doi: https://doi.org/10.3390/horticulturae9101098
Cheng, J., Wen, S., and Bie, Z. (2019). Overexpression of hexose transporter CsHT3 increases cellulose content in cucumber fruit peduncle. Plant Physiology and Biochemistry 145, 107-113. https://doi.org/10.1016/j.plaphy.2019.10.034
Chikh-Rouhou, H., Abdedayem, W., Solmaz, I., Sari, N., Garcés-Claver, A. (2023). Melon (Cucumis melo L.): Genomics and Breeding. In: Singh, S., Sharma, D., Sharma, S.K., Singh, R. (eds.) Smart Plant Breeding for Vegetable Crops in Post-Genomics Era. pp 25-52. Springer, Singapore. https://doi.org/10.1007/978-981-19-5367-5_2
Chikh-Rouhou, H., Tlili, I., Ilahy, R., R’Him, T., Sta-Baba, R. (2019). Fruit quality assessment and characterization of melon genotypes. Int. J. Veg. Sci. 27, 3–19. doi: https://doi.org/10.1080/19315260.2019.1692268
Chikh-Rouhou, H., Kienbaum, L., Gharib, A., Fayos, O., Garcés-Claver, A. (2024). Combining ability and hybrid breeding in Tunisian melon (Cucumis melo L.) for fruit traits. Horticulturae, 10 (7), 724. https://doi.org/10.3390/horticulturae10070724
Comtois, D. and Comtois, M.D. (2016). Packages ‘summary tools’. https://doi.org/10.32614/CRAN.package.summarytools
Diouf, S., & Sambou, A. (2023). Agro-morphological characterization of four varieties of cucumber from Cucumis sativus L. and Cucumis metuliferus E. Mey. Ex Naudin in Senegal. Journal of Horticulture and Postharvest Research 6(2), 131-144.
Eticha, F., Belay, G., & Bekele, E. (2006). Species Diversity in Wheat Landrace Populations from two Regions of Ethiopia. Genetic Resources and Crop Evolution, 53(2), 387–393. https://doi.org/10.1007/s10722-004-6095-z
FAOSTAT. (2024). Food and Agriculture Organization of the United Nations. Crop. Prod. Data 2023. Available online: http://www.fao.org/faostat/en/#data (accessed on 8 March 2025).
Friedman, J. M., Hunt Jr, E. R., and Mutters, R. G. (2016). Assessment of leaf color chart observations for estimating maize chlorophyll content by analysis of digital photographs. Agronomy Journal 108(2), 822-829. DOI: https://doi.org/10.2134/agronj2015.0258
Fu, X., Zhou, L., Huang, J., Mo, W., Zhang, J., Li, J., ... and Huang, X. (2013). Relating photosynthetic performance to leaf greenness in litchi: A comparison among genotypes. Scientia Horticulturae 152, 16-25. https://doi.org/10.1016/j.scienta.2013.01.001
Gaikwad, A. G., Musmade, A. M., Dhumal, S. S., and Sonawane, H. G. (2011). Variability studies in cucumber (Cucumis sativus L.). Ecology, Environment and Conservation 17(4), 799-802.
Galili, T., and Jefferis, G. (2014). dendextend: Extending “dendrogram” Functionality in R (p. 1.19.0) [Dataset]. https://doi.org/10.32614/CRAN.package.dendextend
Gao, Y., Islam, M. S., Tian, J., Lui, V. W. Y., and Xiao, D. (2014). Inactivation of ATP citrate lyase by Cucurbitacin B: A bioactive compound from cucumber, inhibits prostate cancer growth. Cancer Letters 349(1), 15-25. https://doi.org/10.1016/j.canlet.2014.03.015
Gautam, I. P., Pradhan, N. G., Subedi, S., and Thakur, M. K. (2021). Evaluation of cucumber hybrids for yield and quality under plastic house and open field conditions. Nepalese Horticulture 15, 52-63. https://doi.org/10.3126/nh.v15i0.36649
Genebank. (2023). Annual Report 2079/80 (2022/23). National Agriculture Genetic Resources Centre, NARC, Khumaltar, Lalitpur, Nepal.
Genebank. (2024). Annual Report 2080/81 (2023/24). National Agriculture Genetic Resources Centre, NARC, Khumaltar, Lalitpur, Nepal.
Ghimire, K. H., and Magar, R. T. (2017). Diversity in Nepalese wheat genetic resources as revealed by agro-morphological markers. International Journal of Scientific and Engineering Research 8(7), 1646-1651.
Gillaspy, G., Ben-David, H., and Gruissem, W. (1993). Fruits: A developmental perspective. The Plant Cell 5(10), 1439.
Golparvar, A.R., Pirbalouti, A.G., and Madani, H. (2006): Genetic control of some physiological attributes in wheat under drought stress conditions. Pak. J. Bio. Sci., 9(8): 1442-1446.
Grosjean, P., Ibanez, F., Etienne, M., and Grosjean, M. P. (2018). Package ‘pastecs’. Pastecs: Package for Analysis of Space-Time Ecological Series. Url: https://cran. r-project.org/web/packages/pastecs/pastecs. doi: https://doi.org/10.32614/CRAN.package.pastecs
Husson, F., Josse, J., Le, S., Mazet, J., & Husson, M. F. (2016). Package ‘factominer’. An R package, 96(96), 698. http://factominer.free.fr
Ilahy, R., Tlili, I., Rouhou, H., Siddiqui, M., Mishra, P., Kuchi, V., Homa, F., Hdider, C., Jebari, H., Lenucci, M. S. (2020). Determining the main agronomic traits of snake melon (Cucumis melo var. flexuosus L.) fruits as affected by genotypic differences. Acta Hortic. Solis Culin. 34, 113–119. doi: https://doi.org/10.13128/ahsc-8254
Johnson, H. W., Robinson, H. F., and Comstock, R. E. (1955). Estimates of genetic and environmental variability in soybeans. Agronomy Journal 47, 314-318.
Kassambara, A. and Mundt, F. (2017). Package ‘factoextra’. Extract and visualize the results of multivariate data analyses,76(2). https://doi.org/10.32614/CRAN.package.factoextra
Khulakpam, N. S., Singh, V., and Rana, D. K. (2015). Medicinal importance of cucurbitaceous crops. International Research Journal of Biological Sciences 4(6), 1-3.
Kirkbride, J. H. (1993). Biosystematic monograph of the genus Cucumis (Cucurbitaceae). Parkway Publishers, Boone, North Carolina.
Lenka, D. and Misra, B. (1973) Path Coefficient Analysis of Yield in Rice Varieties. Indian Journal of Agricultural Science, 43, 376-379.
Lewandowska-Sabat, A. M., Fjellheim, S., Olsen, J. E., and Rognli, O. A. (2017). Local populations of Arabidopsis thaliana show clear relationship between photoperiodic sensitivity of flowering time and altitude. Frontiers in Plant Science 8, 1046. https://doi.org/:10.3389/fpls.2017.01046
Liu, X., Pan, Y., Liu, C., Ding, Y., Wang, X., Cheng, Z., and Meng, H. (2020). Cucumber fruit size and shape variations explored from the aspects of morphology, histology, and endogenous hormones. Plants 9(6), 772. https://doi.org/10.3390/plants9060772
Lv, J., Qi, J., Shi, Q., Shen, D., Zhang, S., Shao, G., ... and Huang, S. (2012). Genetic diversity and population structure of cucumber (Cucumis sativus L.). PLoS ONE 7(10), e46919. https://doi.org/10.1371/journal.pone.0046919
Mainali, R. P., and Jyakhwa, S. (2023). Morpho-agronomic characterization of cucumber (Cucumis sativus) germplasm for yield and yield-associated traits. International Journal of Applied Sciences and Biotechnology 11(1), 30-36. https://doi.org/10.3126/ijasbt.v11i1.53702
MoALD. (2025). Statistical information on Nepalese agriculture. Ministry of Agriculture and Livestock Development (2022/23). Singha Durbar, Kathmandu: MoALD. Retrieved from https://moald.gov.np/
Mohammadi, S. A., and Prasanna, B. M. (2003). Analysis of genetic diversity in crop plants—salient statistical tools and considerations. Crop science 43(4), 1235-1248.
Naegele, R.P., and Wehner, T.C. (2016). Genetic resources of cucumber. In Genetics and genomics of Cucurbitaceae, eds. R. Grumet, N. Katzir, and J. Garcia-Mas (Cham: Springer), 61–86. https://doi.org/10.1007/7397_2016_15
Ni, F., Li, Z., and Huang, J. (2024). Worldwide productivity and research trend on fruit quality: a bibliometric study. Frontiers in Plant Science 14, 1-8. https://doi.org/10.3389/fpls.2023.1294989
Niyi, O. H., Jonathan, A. A., and Ibukun, A. O. (2019). Comparative assessment of the proximate, mineral composition and mineral safety index of peel, pulp and seeds of Cucumber (Cucumis sativus). Open Journal of Applied Sciences 9(9), 691. https://doi.org/10.4236/ojapps.2019.99056
Olivoto, T., Lúcio, A. D. (2020). metan: An R package for multi-environment trial analysis. Methods Ecol. Evol. 11, 783–789. doi: https://doi.org/10.1111/2041-210X.13384
Owino, M. H., Gichimu, B. M., and Muturi, P. W. (2020). Agro-morphological characterization of horned melon ('Cucumis metuliferus') accessions from selected agro-ecological zones in Kenya. Australian Journal of Crop Science 14(9), 1487-1496. https://doi.org/10.21475/ajcs.20.14.09.p2642
Perry, M. C., and McIntosh, M. S. (1991). Geographical patterns of variation in the USDA soybean germplasm collection: I. Morphological traits. Crop Science 31(5), 1350-1355. https://doi.org/10.2135/cropsci1991.0011183X003100050054x
Popat, R., Patel, R., and Parmer, D. (2020). Variability: genetic variability analysis for plant breeding research https://CRAN.R-project.org/package=variability.
Pushpalatha, N., Anjanappa, M., Devappa, V., and Pitchaimuthu, M. (2016). Genetic variability and heritability for growth and yield in cucumber (Cucumis sativus L.). Journal of Horticultural Sciences 11(1), 33-36. https://doi.org/10.24154/jhs.v11i1.100
R Core Team (2025). R: A language and environment for statistical computing. R Foundation for Statistical Computing, Vienna, Austria. https://www.R-project.org/
Ranjan, P., Gangopadhyay, K. K., Bag, M. K., Roy, A., Srivastava, R., Bhardwaj, R., and Dutta, M. (2015). Evaluation of cucumber (Cucumis sativus L.) germplasm for agronomic traits and disease resistance and estimation of genetic variability. Indian Journal of Agricultural Sciences 85(2), 234-239. http://epubs.icar.org.in/ejournal/index.php/IJAgS/article/view/46516/20091
Ranjan, P., Pandey, A., Munshi, A. D., Bhardwaj, R., Gangopadhyay, K. K., Malav, P. K., ... and Kumar, A. (2019). Orange-fleshed cucumber (Cucumis sativus var. sativus L.) germplasm from North-East India: agro-morphological, biochemical and evolutionary studies. Genetic Resources and Crop Evolution ٦٦(٦), ١٢١٧-١٢٣٠. https://doi.org/10.1007/s10722-019-00778-6
Raza, A., Ayyub, C. M., Ghani, M. A., and Ahmed, N. (2020). Assessment of morphological diversity among indigenous cucumber germplasm of Pakistan. Pakistan Journal of Agricultural Sciences 57(6), 1573-1580. https://doi.org/10.21162/PAKJAS/20.9956
Renner, S. S., Schaefer, H., and Kocyan, A. (2007). Phylogenetics of Cucumis (Cucurbitaceae): Cucumber (C. sativus) belongs in an Asian/Australian clade far from melon (C. melo). BMC Evolutionary Biology 7, 1-11. https://doi.org/10.1186/1471-2148-7-58
Saracli, S., Dogan, N., and Dogan, I. (2013). Comparison of hierarchical cluster analysis methods by cophenetic correlation. Journal of Inequalities and Applications 2013:203. https://doi.org/10.1186/1029-242X-2013-203
Sebastian, P., Schaefer, H., Telford, I. R., and Renner, S. S. (2010). Cucumber (Cucumis sativus) and melon (C. melo) have numerous wild relatives in Asia and Australia, and the sister species of melon is from Australia. Proceedings of the National Academy of Sciences 107(32), 14269-14273. https://doi.org/10.1073/pnas.1005338107
Seed Quality Control Centre (SQCC). (2024). Notified or denotified varieties updated 2081-07-23. Government of Nepal, Ministry of Agriculture and Livestock Development. Retrieved from https://www.sqcc.gov.np/storage/listies/November2024/notified%20and%20denotified%20varieties%20updated%202081-7-23.pdf
Shah, K. N., Rana, D. K., & Singh, V. (2016). Evaluation of different cucumber strain for various horticultural traits under valley condition of Garhwal Himalaya. J. Plant Dev. Sci, 8(12), 599-603. url: https://jpds.co.in/wp-content/uploads/2025/11/05.-Naseer-Ahmed-Correct-Paper-1025.pdf
Shakya, S., Bhattarai, S., Tripathi, K., Sharma, M. (2006). Screening of cucumber germplasms for high temperature and long day photoperiodic tolerance. J. Inst. Agric. Anim. Sci. 27, 45–51. doi: https://doi.org/10.3126/jiaas.v27i0.694
Shannon, C. E. (1948). A mathematical theory of communication. The Bell System Technical Journal 27(3), 379-423.https://doi.org/10.1002/j.1538-7305.1948.tb01338.x
Sharma, V., Sharma, L., and Sandhu, K. S. (2020). Cucumber (Cucumis sativus L.). In Antioxidants in vegetables and nuts-properties and health benefits, eds. G.A. Nayik and A. Gull (Singapore: Springer), 333–340. https://doi.org/10.1007/978-981-15-7470-2_17
Staub, J. E., Serquen, F. C., and McCreight, J. D. (1997). Genetic diversity in cucumber (Cucumis sativus L.): III. An evaluation of Indian germplasm. Genetic Resources and Crop Evolution 44, 315-326. https://doi.org/10.1023/A:1008639103328
Subedi, S., Bhandari, N., Basnet, M., Pradhan, N. G., Gautam, I. P. (2024). Evaluation of cucumber genotypes under plastic house and open field conditions in Lalitpur, Nepal. Cogent Food Agric. 10. doi: https://doi.org/10.1080/23311932.2023.2298531
Suma, A., Elsy, C. R., John, K. J., Pradeepkumar, T., Francies, R., Joseph, J., Santhoshkumar, A.V., Krishnan, S., and Yadav, S. K. (2021). Genetic diversity in Indian landraces of cucumber (Cucumis sativus L.) based on morpho-horticultural traits. Indian Journal of Plant Genetic Resources 34(3), 411-423. https://doi.org/10.5958/0976-1926.2021.00034.6
Tanksley, S. D. (2004). The genetic, developmental, and molecular bases of fruit size and shape variation in tomato. The Plant Cell 16, 181-189. https://doi.org/10.1105/tpc.018119
Thiruvengadam, M., and Chung, I. M. (2014). Optimization of factors influencing in vitro flowering of gherkin (Cucumis anguria L.). Acta Biologica Hungarica 65, 72-84. https://doi.org/10.1556/ABiol.65.2014.1.7
UPOV. (2007). Guidelines for the Conduct of Test for Distinctness, Uniformity and Stability for Cucumber, Gherkin (Cucumis sativus L.); International Union for the Protection of New Varieties of Plants: Geneva, Switzerland
Valcárcel, J. V., Peiró, R. M., Pérez-de-Castro, A., and Díez, M. J. (2018). Morphological characterization of the cucumber (Cucumis sativus L.) collection of the COMAV’s Genebank. Genetic Resources and Crop Evolution 65(4), 1293-1306. https://doi.org/10.1007/s10722-018-0614-9
Venna, R., Sindhu, A.S., Pitchaimuthuverma, M., and Souravi, K. (2012). Genetic evaluation of Cucumber [Cucumis sativus L.] genotypes for some yield and related traits. Electronic Journal of Plant Breeding 3(3), 945-948. https://doi.org/10.37992/2023.1401.038
Verma, N., Kumar, R., Kaur, J., and Singh, D. (2020). Effect of different mode of pollination on fruit and seed characteristics of cucumber (Cucumis sativus L.). Vegetable Science 47(02), 248-253.
Villa, T. C. C., Maxted, N., Scholten, M., and Ford-Lloyd, B. (2005). Defining and identifying crop landraces. Plant Genetic Resources 3(3), 373-384. https://doi.org/10.1079/PGR200591
Wang, X., Bao, K., Reddy, U. K., Bai, Y., Hammar, S. A., Jiao, C., ... and Fei, Z. (2018). The USDA cucumber (Cucumis sativus L.) collection: genetic diversity, population structure, genome-wide association studies, and core collection development. Horticulture research ٥. https://doi.org/10.1038/s41438-018-0080-8
War, A. R., Paulraj, M. G., Ahmad, T., Buhroo, A. A., Hussain, B., Ignacimuthu, S., and Sharma, H. C. (2012). Mechanisms of plant defense against insect herbivores. Plant Signaling & Behavior 7(10), 1306–1320. https://doi.org/10.4161/psb.21663
Weng, Y. (2021). Cucumis sativus chromosome evolution, domestication, and genetic diversity: Implications for cucumber breeding. In Plant Breeding Reviews, ed. I. Goldman (John Wiley & Sons), 9-111. https://doi.org/10.1002/9781119717003.ch4
Whitaker, T. W., and Davis, G. N. (1962). Cucurbits: Botany, Cultivation, and Utilization. Interscience Publishers.
Xiaolei, S., and Zhifeng, W. (2002). The optimal leaf area index for cucumber photosynthesis and production in plastic greenhouse. In XXVI International Horticultural Congress: Protected Cultivation 2002: In Search of Structures, Systems and Plant Materials for 633, ed. A.P. Papadopoulos (Interscience Publishers), 161-165.
Yadav, S., Singh, D. K., Singh, S. S., Bisht, Y. S., and Bhatt, R. (2021). Assessment of genetic variability in cucumber (Cucumis sativus L.). IJCS 9(1), 3347-3349. https://doi.org/10.22271/chemi.2021.v9.i1au.11753
Yang, L., Koo, D. H., Li, Y., Zhang, X., Luan, F., Havey, M. J., ... and Weng, Y. (2012). Chromosome rearrangements during domestication of cucumber as revealed by high‐density genetic mapping and draft genome assembly. The Plant Journal 71(6), 895-906. https://doi.org/10.1111/j.1365-313X.2012.05017.x
Younuskunju, S., Mohamoud, Y. A., Mathew, L. S., Mayer, K. F., Suhre, K., and Malek, J. A. (2025). Genomic analysis of date palm fruit size traits and identification of candidate genes through GWAS. arXiv preprint arXiv:2501.11831. https://doi.org/10.32220/agriRxiv.2025.00299
Zeven, A. C. (1998). Landraces: A review of definitions and classifications. Euphytica 104, 127-139. https://doi.org/10.1023/A:1018683119237
Zhang, C., Pratap, A. S., Natarajan, S., Pugalendhi, L., Kikuchi, S., Sassa, H., ... and Koba, T. (2012). Evaluation of morphological and molecular diversity among South Asian germplasms of Cucumis sativus and Cucumis melo. International Scholarly Research Notices 2012(1), 134134. https://doi.org/10.5402/2012/134134
Zuguang Gu, M. (2024). Package “circlize” Title Circular Visualization. https://doi.org/10.1093/bioinformatics/btu393