Biodiversity assessment of African locust bean (Parkia biglobosa) accessions from Savanna and Forest zones of Nigeria as revealed by seed storage proteins and RAPD markers
Abstract
Understanding the level and distribution of genetic diversity in African locust bean (Parkia biglobosa) would strengthen breeding and conservation programmes towards domestication and sustainable use of this species. Sixteen accessions of P. biglobosa were assessed for variability based on seed morphology, seed protein and DNA profiling. Significant variation in seed characteristics were observed across locations. Seed protein profiling by SDS-PAGE revealed homogeneity as most bands were found common in all accessions, indicating that the protein profiles are highly conserved. Protein profiling separated the 16 accessions into four major clusters at 0.93 similarity coefficient. Most accessions grouping into Cluster 1 had a similarity coefficient of close to 100% and were from the Derived Savanna suggesting the presence of duplicates. Accessions NH/2016/P14, NH/2016/P03 and NH/2016/P04 grouped into clusters II, III and IV; respectively. Sixteen RAPD markers generated a total of 256 bands of which 63.67% were polymorphic. Gene diversity ranged from 0.41 to 0.93 and Polymorphic Information Content (PIC) from 0.39 to 0.93. The RAPD-based dendrogram separated accessions into six groups at 0.68 similarity coefficient. Based on a polymorphic seed storage protein marker a genetically distinct accession NH/2016/P04 could be exploited for breeding purposes. The homogeneity of alleles and narrow genetic base as revealed by RAPD and SDS-PAGE analyses suggests possible loss of intraspecific genetic diversity. Thus, intensification of germplasm collections across the different agroecological zones and characterization using specific markers will give a better understanding of diversity of P. biglobosa in order to enhance selection towards conservation, breeding and sustainable utilization.
Keywords
African locust bean, genetic diversity, agroecological zone, RAPD, Parkia biglobosa, SDS-PAGE
Introduction
In Sub-Saharan Africa several indigenous agroforestry systems exist containing woody species known as multipurpose trees. Africa locust bean [Parkia biglobosa (Jacq.) R. Br. ex G. Don] is a well-known indigenous agroforestry fruit tree species belonging to the sub-family Mimosoideae and family Fabaceae (Amusa et al., 2014; Houndonougbo et al., 2020). The species grows in multiple climatic zones and is widely distributed from Senegal and Guinea in West Africa to Uganda in Central Africa (Lompo, Vinceti, Konrad, Gaisberger, & Geburek, 2018). Parkia biglobosa is maintained in the parklands of Africa for non-timber forest foods (Houndonougbo et al., 2020; Leakey, 2012; Okoye, Uzor, Onyeto, & Okereke, 2014). P. biglobosa is a valuable resource for the livelihoods of local people in Sub-Saharan Africa because of its multipurpose function as a source of food, nutrition, medicine and income (Awodoyin et al., 2015; Matig, Gaoué, & Dossou, 2002; Nikiema, 2005; Sankhon et al., 2014; Shao, 2002; Sina & Traore, 2002; Teklehaimanot, 2004). The fruit pulp and seeds are both suitable for human consumption. The mealy pulp from the species’ fruits is a major source of energy and nutrients including carbohydrates, proteins, lipids, carotenoids, vitamins A, B, C, and oligoelements (Nyadanu et al., 2017). The seeds are an important source of plant protein and essential amino acids among rural communities who often have limited access to animal proteins due to high cost (Akin-Idowu, Egbekunle, Akinyemi, & Orkpeh, 2018; Alabi, Akinsulire, & Sanyaolu, 2005) and are also rich in energy value, saccharose, vitamin C, lipids, carbohydrates (Orwa, Mutua, Kindt, Jamnadass, & Anthony, 2010) and bioactive components such as phenolic compounds which may contribute in health promoting properties (Dedehou, Olounlade, Alowanou, Azando, & Hounzangbe´-Adote, 2016; Okoye et al., 2014). P. biglobosa seeds are fermented to make a food condiment called Dawadawa (Iru) which is rich in dietary protein and serves as an important substitute for animal protein (Lamien, Ekué, Ouedraogo, & Loo, 2011; Nyadanu et al., 2017). The leaves, bark, roots and flowers are also used in the treatment of many diseases such as hypertension, wound healing and malaria (Dedehou et al., 2016; Ouedraogo, 1995).
In spite of the importance of this species in traditional agriculture, regular cultivation of the fruit tree has rarely gone beyond conservation of natural stands in situ (Hopkins, 1983; Oni, Hall, & Ladipo, 1998). Several studies on P. biglobosa population structure have shown low regeneration rates and ageing of the stands which may lead to extinction (Padakale et al., 2015; Ræbild, Hansen, & Kambou, 2012). Overexploitation, late fruitification for most progenies and climate change are some of the factors suggested to explain the phenomenon (Boffa, 1999; Kwon-Ndung, Chup, Binbol, & Ismaila, 2009; Teklehaimanot, 2004). Improved tree management practices for P. biglobosa, such as establishment of new trees or protection of natural regeneration are currently not sufficiently promoted (Ræbild, Hansen, & Kambou, 2012). Thus, African locust bean remains undomesticated despite increasing demand for its use.
The conservation and sustainable use of genetic resources are critical to maintain tree resource availability, especially in the face of significant environmental changes, erosion of cultural heritages and declining cultivation and production activities of neglected indigenous species leading to genetic resources being threatened. The process of plant domestication and conservation requires characterization of genetic resources for identification of cultivars and effective utilization of germplasm.
Genome size variation has been identified as an associate of evolutionary divergence (Dobes, Steccari, Kostenberger, & Lompo, 2019). Variation in genome size and chromosome number becomes taxonomically significant if associated with some degrees of morphological and ecological differentiation (Murray, 2005).Sina (2006) studied genetic diversity among populations of P. biglobosa species in Burkina Faso using enzyme electrophoresis.Dobes et al. (2019) tested for linkage of relative genome size variation with geography, leaf morphology and population genetic variation in 58 individuals from 15 populations covering most of the distribution of P. biglobosa species in Burkina Faso. Most of the variation was found within populations and there was no evidence from the karyological data for structured intraspecific taxonomic heterogeneity (Dobes et al., 2019).
In Nigeria, genetic diversity of P. biglobosa accessions have been evaluated based on morphological characterization of trees (Gbadamosi, Faboye, & Oni, 2005; Okunlola, Adebayo, & Orimogunje, 2011) and seedlings (Adesoye, Ogunremi, & Aina, 2013). However, these characters are known to be more influenced by the environment.Uyoh, Urua, Ntui, and Okpako (2011) reported variation in banding pattern of proteins obtained from leaf samples of three accessions of P. biglobosa collected from locations within Cross River State, Nigeria.Adesoye and Apo (2015) reported low levels of genetic diversity when 34 accessions of P. biglobosa were screened using seed protein electrophoresis. Owing to the limited information on genetic variation and relationship of P. biglobosa accessions in Nigeria, characterization using a combination of morphological, biochemical and molecular markers is essential for species identification and genetic variability establishment. This will facilitate the domestication, conservation and management of its genetic resources towards sustainable use.
Morphological characterization has been used to reveal phylogenetic relationships among crop populations, but this has its limitations as it is influenced by environmental factors (Ferreira, 2006). Selection, according to genetic variability using biochemical and molecular markers, has proved advantageous compared with the use of phenotypic markers (Alghamdi et al., 2019).
Biochemical analysis, particularly electrophoresis of seed proteins has been effective in studying genetic diversity at intraspecific levels in several legumes including soybean and chickpea (Durán et al., 2005; Malik, Qureshi, Ashraf, Khan, & Javed, 2009; Sammour, Mustafa, Badr, & Tahr, 2007; Sammour, Radwan, & El-Kholy, 2007; Signor et al., 2005) and for cultivar identification (Krochko & Bewley, 2000; Mustafa & El-Kholy, 2008).
The use of polyacrylamide gel electrophoresis (PAGE) in fractionating seed proteins and evaluating genetic diversity among accessions of several legume species including groundnut, African yam bean, grass pea, buckwheat, bambara groundnut and underground vetches has also proven effective (Javaid, Ghafoor, & Anwar, 2004; Machuka, 2001; Przybylska, Zimniak-Przybylska, & Krajewski, 2000; Rosa & González, 2010).
Molecular markers are known as one of the best approaches to study genetic material as well as to assess genetic variation in crop gene pools (Badr, 2008; Mondini, Noorani, & Pagnotta, 2009; Wang, Zhang, Liu, Liang, & Li, 2016). A number of PCR based molecular markers such as Random Amplified Polymorphic DNA (RAPD), Inter Simple Sequence Repeats (ISSR) and Amplified Fragment Length Polymporhism (AFLP) have been used to assess genetic variability and cultivar identification in soybean (Barakat, 2004; Baránek, Kadlec, Raddová, Vachůn, & Pidra, 2002; Chowdhury, Srinives, Tongpmnak, & Saksoong, 2001; El-Kholy, 2013) and other plant populations (Hoque & Hasan, 2012; Lin et al., 2009). RAPD is often used successfully to assess genetic diversity among species as it is fast, less technical and expensive and may reveal dominant molecular marker of good potential (Badr, El-Shazly, Helail, & Ghanim, 2012; Prasanthi, Geetha, Ramyajyothi, & Reddy, 2012).
This study aimed to estimate the genetic diversity of P. biglobosa accessions across different agro-ecological zones in Nigeria using SDS-PAGE and RAPD markers.
Materials and Methods
Plant material and morphological description
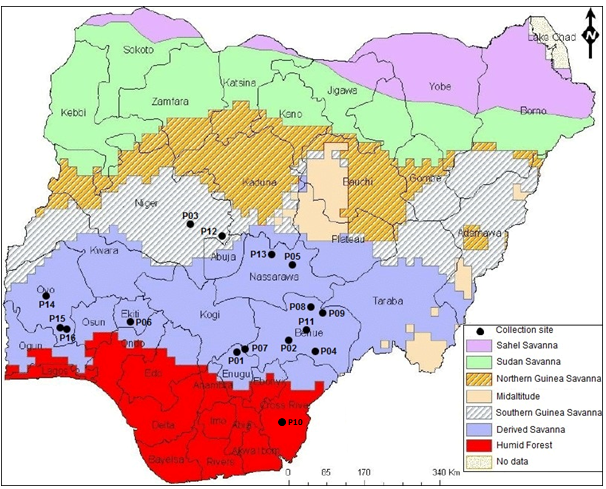
Seeds of P. biglobosa were obtained from 16 locations across seven states in Nigeria (Figure 1). Thirteen of the sixteen accessions studied were collected from locations in the Derived Savanna agroecological zone (AEZ); two were collected from the Guinea Savanna and one from Humid Forest (Figure 1,Table 1). The sampling of P. biglobosa accessions was not conducted systematically across all AEZs because the species is reported to be widely adapted and naturally distributed throughout the varied savannas of Sub-Saharan Africa (Lompo et al., 2016). The seed morphological characteristics of each collected accession, including seed shape, seed coat color and seed coat texture were observed. One hundred (100) seed weight in grams of each accession was also recorded.
|
Accession code |
Collection site |
Agroecological Zone |
Geographical Coordinates (DD) |
|
|
Longitude |
Latitude |
|||
|
NH/2016/P01 |
Obollo-Afor, Enugu State |
Derived Savanna |
6.9153°N |
7.5139°E |
|
NH/2016/P02 |
Oju, Benue State |
Derived Savanna |
7.0383°N |
8.3451°E |
|
NH/2016/P03 |
Minna, Niger State |
Guinea Savanna |
9.5836°N |
6.5463°E |
|
NH/2016/P04 |
Vandeikya, Benue State |
Derived Savanna |
6.7835°N |
9.0695°E |
|
NH/2016/P05 |
Agyaragu, Nasarawa State |
Derived Savanna |
8.3471°N |
8.5679°E |
|
NH/2016/P06 |
Ikere, Ekiti State |
Derived Savanna |
7.5000°N |
5.2333°E |
|
NH/2016/P07 |
Orokam, Benue State |
Derived Savanna |
6.9786°N |
7.5572°E |
|
NH/2016/P08 |
Gbajimba, Benue State |
Derived Savanna |
7.8197°N |
8.8587°E |
|
NH/2016/P09 |
Kwatan-Sule, Benue State |
Derived Savanna |
7.8112°N |
9.2429°E |
|
NH/2016/P10 |
Ogoja, Cross River State |
Humid Forest |
6.6548°N |
8.7977°E |
|
NH/2016/P11 |
Mbatiav, Gboko, Benue State |
Derived Savanna |
7.2788°N |
8.7953°E |
|
NH/2016/P12 |
Suleja, Niger State |
Guinea Savanna |
9.2003°N |
7.1723°E |
|
NH/2016/P13 |
Garaku, Nassarawa State |
Derived Savanna |
8.8444°N |
8.1311°E |
|
NH/2016/P14 |
Iseyin, Oyo State |
Derived Savanna |
7.9765°N |
3.5914°E |
|
NH/2016/P15 |
NIHORT, Ibadan, Oyo State |
Derived Savanna |
7.4052°N |
3.8499°E |
|
NH/2016/P16 |
Oje Market, Ibadan, Oyo State |
Derived Savanna |
7.3891°N |
3.9092°E |
Seed preparation and total protein extraction
Dried seeds were milled into flour and defatted with n-hexane at a flour:hexane ratio of 1:10 (w/v) prior to protein extraction (Rosa, Gueguen, Paredes-Lopez, & Viroben, 1992).
Seed total protein extraction was carried out by suspending defatted flour samples (100 mg) in 2.0 mL of pre-chilled Tris buffer 50mM Tris-HCl, pH 7.6, 1mM DDT, 150 mM NaCl and 1mM EDTA for 2h at room temperature according to the method of Zarkadas et al. (2007). The resulting homogenates were centrifuged at 10,000 g for 20 min and supernatants were stored at -20ºC until used.
One dimensional SDS-PAGE
Sodium dodecyl sulfate-polyacrylamide gel electrophoresis (SDS-PAGE) was performed according to the procedure of Laemmli (1970). Protein extracts were diluted in a sample buffer that contained 60 mM Tris-HCl (pH 6.8), 2% w/v SDS, 3.33% v/v β-mercaptoethanol, 10% glycerol and 0.05% of bromophenol blue. The samples were heated at 98°C for 5 min before loading onto a vertical slab gel (Mini-PROTEAN II Electrophoresis Cell) using a 4% (w/v) stacking and 12% gradient separating (acrylamide/bis acrylamide) gel containing 0.1% SDS. The separating polypeptide bands were calibrated using a protein molecular weight marker which ranged from 11 to 130 kDa. Electrophoresis was done at 125 V for about 2 h. At the end of the run, the gels were stained with Coomassie brilliant blue R-250 (SigmaAldrich) in methanol/water/acetic acid (40:50:10) and destained in a solution containing methanol/water/acetic acid (50:40:10).
Genomic DNA extraction, RAPD amplification and electrophoresis
For the genetic analysis, ten viable seeds of each of the sixteen accessions of P. biglobosa collected from the different locations were grown in a greenhouse. Prior to sowing, the seeds were immersed in concentrated sulphuric acid (H2SO4) for 15 minutes to break seed dormancy, rinsed thoroughly in running water and air dried at room temperature. Total genomic DNA was extracted from young leaves of P. biglobosa accessions. About 0.2g of a composite of 5 samples per accession was ground in extraction buffer following the cetyltrimethyl ammonium bromide (CTAB) method of Dellaporta, Wood, and Hicks (1983).
The DNA quality was evaluated using 1% agarose gel electrophoresis with known concentrations of undigested lambda DNA (Sigma, St Louis, MO, USA). Quantification of DNA was done using a spectrophotometer (Beckman Coulter DU530) at 260 nm. Extracts were diluted to obtain DNA concentrations of 25ng/µl. To generate DNA profiles, 40 decamer oligonucleotide DNA primers were initially screened for polymorphisms and only 16 which were polymorphic were used in the PCR reactions (Table 2).
To ensure reproducibility of RAPD markers, RAPD-PCR amplification was performed in triplicate for each primer and accession. The PCR reaction contained the following reagents with the final concentrations: 1x PCR buffer, dNTPs (0.2 mM), MgCl2 (2.0 mM), primer (25 pmol), template DNA (25ng/µl), Taq polymerase (1.25 U) and nuclease-free water to 50µl. Amplification was carried out in a 2400 Perkin Elmer Gene Amp PCR thermo-cycler as follows: pre-denaturation for 3 min at 94ºC; then 40 cycles each consisting of a denaturation step for 1 min at 94ºC; an annealing step for 1 min at 36ºC; an extension step for 90 sec at 72ºC. Amplification was terminated by a final extension of 7 min at 72ºC. PCR products were electrophoresed on a 1.5% (w/v) agarose gel in 1X Tris/Borate/EDTA (TBE) buffer at 100 volts for 2h and visualized under UV light after staining with ethidium bromide.
|
Primer |
Sequence 5’ to 3’ |
Major allele frequency |
Allele number |
Gene Diversity |
Polymorphic Information content (PIC) |
|---|---|---|---|---|---|
|
OPB10 |
CTGCTGGGAC |
0.13 |
15 |
0.93 |
0.93 |
|
OPT07 |
GGCAGGCTGT |
0.13 |
14 |
0.92 |
0.92 |
|
OPB04 |
GGACTGGAGT |
0.13 |
14 |
0.92 |
0.92 |
|
OPT12 |
GGGTGTGTAG |
0.13 |
14 |
0.92 |
0.92 |
|
OPT08 |
AACGGCGACA |
0.13 |
13 |
0.91 |
0.91 |
|
OPT06 |
CAAGGGCAGA |
0.19 |
13 |
0.91 |
0.90 |
|
OPH07 |
CTGCATCGTG |
0.19 |
12 |
0.90 |
0.89 |
|
OPB08 |
GTCCACACGG |
0.19 |
9 |
0.87 |
0.85 |
|
OPT20 |
GACCAATGCC |
0.25 |
9 |
0.84 |
0.82 |
|
OPH06 |
ACGCATCGCA |
0.38 |
9 |
0.80 |
0.78 |
|
OPT09 |
CACCCCTGAG |
0.38 |
9 |
0.80 |
0.78 |
|
OPT10 |
CCTTCGGAAG |
0.44 |
10 |
0.77 |
0.76 |
|
OPT01 |
GGGCCACTCA |
0.44 |
7 |
0.74 |
0.71 |
|
OPT16 |
GGTGAACGCT |
0.56 |
6 |
0.64 |
0.61 |
|
OPB05 |
TGCGCCCTTC |
0.56 |
5 |
0.63 |
0.59 |
|
OPT05 |
GGGTTTGGCA |
0.75 |
4 |
0.41 |
0.39 |
|
Mean |
|
0.31 |
10 |
0.81 |
0.79 |
|
Total |
|
|
163 |
|
|
Data analysis
Data on 100-seed weight of all accessions were subjected to ANOVA and means were separated using Duncan’s multiple range tests (p≤0.05). Distribution frequencies of the qualitative traits were calculated using Microsoft Excel 2010. The protein bands and RAPD amplified DNA fragments were scored qualitatively, whereby (0) stands for the absence and (1) stands for the presence of bands in the profile of each accession. All values were pooled together to generate a binary data matrix, which was analyzed using the Numerical Taxonomy and Multivariate Analysis System (Rohlf, 2002). Genetic relationship among accessions was evaluated based on Jaccard’s similarity index (Jaccard, 1908). Dendrograms were generated by using the Unweighted Pair Group Method with Arithmetic Mean (UPGMA). Analysis of genetic diversity (GD) was calculated according to the method of Nei (1987). Polymorphic information content (PIC) for each primer was determined from allele frequencies (Nei & Li, 1979).
Results and Discussion
Variation in seed morphology
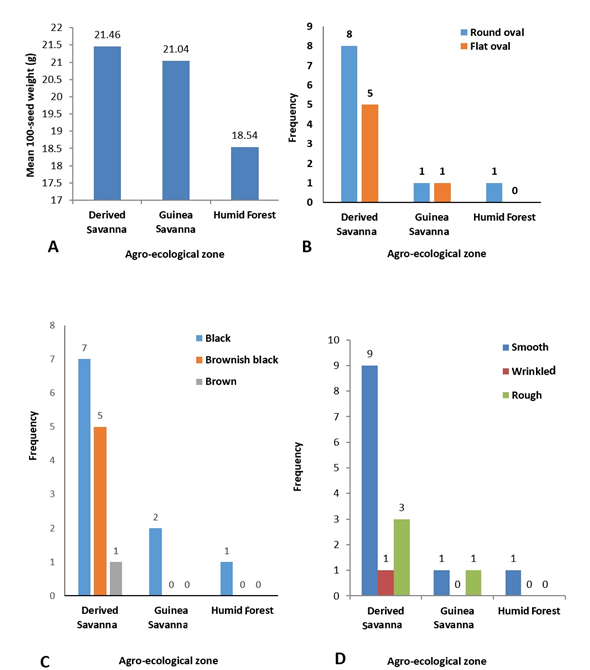
Improvement of the quality of indigenous fruit trees across Sub-Saharan Africa involves assessment of fruit/seed traits; this has shown significant variation both among and within provenances and has enhanced selection in breeding programmes (Ræbild et al., 2012). In this study, significant differences (p≤0.05) were observed in the 100-seed weight of P. biglobosa collected from 16 different locations (Table 3), which ranged from 17.93g (NH/2016/P09) to 26.11g (NH/2016/P05). The highest 100-seed weight was recorded for accession NH/2016/P05 collected from Agyaragu, Nassarawa State; this was significantly (p≤0.05) higher than that of all other accessions. The lowest 100-seed weight was recorded for NH/2016/P09 collected from Kwatan-Sule, Benue State. The mean 100-seed weight (21.46g) of all accessions of P. biglobosa collected from the Derived Savanna zone was higher than the mean 100-seed weight collected from the Guinea Savanna and Humid Forest (Figure 2a). This variation in seed weight can be attributed to a wide range of factors such as environment (soil, climate), anthropogenic activities and phenotypic plasticity, thus promoting the presence of ecotypes.
(Leakey, 2017) reported that fruit and/or kernel size was greater in more humid sites for Adansonia digitata and Vitellaria paradoxa; but greater in drier sites for Balanite aegyptiaca. Also, results from tests of B. aegyptiaca and Prosopis Africana indicated that provenances from drier sites had significantly better aboveground growth than provenances from more humid sites (Leakey, 2017). It is recommended that fruit trees germplasm should be collected in drier sites for future plantings in parklands, especially as this germplasm appears to be better adapted to dry conditions (Leakey, 2017).
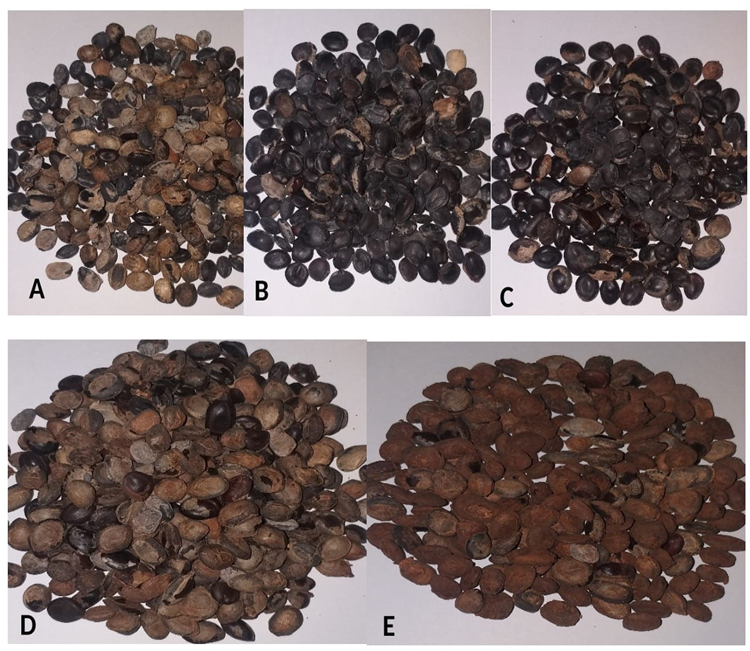
The seeds of P. biglobosa accessions collected from the different locations in this study had distinct morphology and exhibited variation for seed shape, seed coat colour and seed coat texture (Table 3). Seeds of the sixteen P. biglobosa accessions were predominantly round oval in shape, black in colour with smooth seed coat and were mostly obtained from the Derived Savanna zone (Figure 2B, C, D). Seeds collected from the two sites in Guinea Savanna differed in shape and texture as seeds from one site were flat oval, black and smooth (NH/2016/P03) (Figure 3B); while seeds from the other site were round oval, black and rough (NH/2016/P12) (Figure 3C). Seeds collected from the same agroecological zone (Derived Savanna) exhibited distinct variation in colour and texture, NH/2016/P15 seeds were flat oval, brown and smooth (Figure 3E); while seeds of NH/2016/P04 were flat oval, black and wrinkled.
The morphological variation may be due to gene flow across regions because of seed dispersal since P. biglobosa is an open pollinated tree crop having main pollinators such as bat, honeybees, rodents and humans (Lassen, 2016; Lassen, Ræbild, Hansen, Brødsgaard, & Eriksen, 2012; Lompo et al., 2017). This variation offers great potential for future selection and domestication.
Lack of a clear association between genome size and morphological, geographical, or ecological patterns of differentiation has been reported for two species of Artemisia (Asteraceae) (Dobes et al., 2019; Xaxars et al., 2016).
|
Accession code |
Weight of 100 seeds (g) Mean ± SE |
Shape |
Colour |
Seed coat texture |
|---|---|---|---|---|
|
NH/2016/P01 |
23.11d ± 0.18 |
Round Oval |
Black |
Smooth |
|
NH/2016/P02 |
18.59k ± 0.16 |
Round Oval |
Brownish black |
Smooth |
|
NH/2016/P03 |
21.75f ± 0.15 |
Flat Oval |
Black |
Smooth |
|
NH/2016/P04 |
18.30k ± 0.32 |
Flat Oval |
Black |
Wrinkle |
|
NH/2016/P05 |
26.11a ± 0.21 |
Round Oval |
Black |
Smooth |
|
NH/2016/P06 |
23.38d ± 0.10 |
Flat Oval |
Brownish black |
Smooth |
|
NH/2016/P07 |
19.44i ± 0.14 |
Round Oval |
Black |
Smooth |
|
NH/2016/P08 |
20.87g ± 0.19 |
Round Oval |
Black |
Rough |
|
NH/2016/P09 |
17.93l ± 0.23 |
Round Oval |
Brownish black |
Smooth |
|
NH/2016/P10 |
18.54k ± 0.13 |
Round Oval |
Black |
Smooth |
|
NH/2016/P11 |
21.46f ± 0.06 |
Round Oval |
Black |
Smooth |
|
NH/2016/P12 |
20.32h ± 0.26 |
Round Oval |
Black |
Rough |
|
NH/2016/P13 |
23.74c ± 0.23 |
Round Oval |
Black |
Rough |
|
NH/2016/P14 |
19.00j ± 0.12 |
Flat Oval |
Brownish black |
Rough |
|
NH/2016/P15 |
24.59b ± 0.11 |
Flat Oval |
Brown |
Smooth |
|
NH/2016/P16 |
22.48e ± 0.13 |
Flat Oval |
Brownish black |
Smooth |
Seed storage protein analysis
Seed storage protein profiling has been used as an effective tool for varietal identification and determination of phylogenetic relationship in several plant species populations (Emre, 2009; Hameed, Qureshi, Nawaz, & Iqbal, 2012; Machuka, 2001).
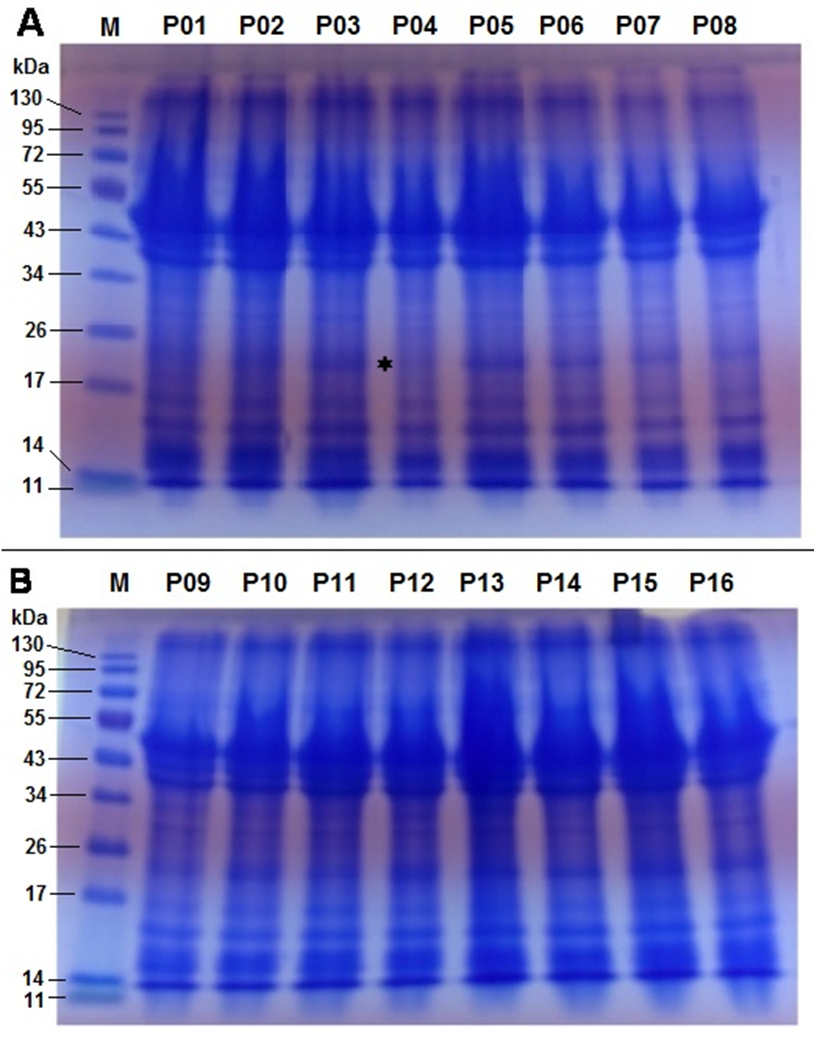
In this study, the SDS-PAGE profile of sixteen accessions of P. biglobosa showed similar electrophoretic patterns with respect to the number of protein bands and their band intensities (Figure 4). The uniformity in the protein band profiles of all sixteen accessions suggests a low level of genetic diversity, which also corroborates earlier studies on P. biglobosa using seed protein electrophoresis (Adesoye et al., 2015).
Occurrence of a narrow genetic base from the accessions of P. biglobosa would suggest that they resulted not only from a common gene pool, but also from the outcrossing nature of the species over a long time, leading to a low level of inter-population diversity. Low variation was observed in thirteen mungbean varieties using SDS-PAGE (Hameed et al., 2012) and also in genetic diversity assessment of groundnut using SDS-PAGE (Javaid et al., 2004).
The number of clearly visible protein bands ranged from eight to nine among the sixteen accessions of P. biglobosa with molecular weights ranging from 11 to 130 kDa. Two major clusters of bands were observed between 11−17 kDa and 34−53 kDa and one minor band was observed above 130 kDa (Figure 4). This is similar to results ofAdesoye et al. (2015) on albumin and globulin fractions of P. biglobosa in which two major bands were observed at the 16 and 50 kDa regions.
It has been suggested that high molecular weight proteins facilitate the development of seed hardness (Coelho, Bellato, Santos, Ortega, & Tsai, 2007); therefore, the presence of a high molecular weight band observed above the 130 kDa in this study may account for the seed hardness of P. biglobosa. The seeds of P. biglobosa are very hard and require treatment with sulphuric acid to induce germination.
A polymorphic polypeptide with molecular weight of approximately 24 kDa was absent in NH/2016/P04 but present in all other accessions (Figure 4A) and can be used for its identification. Differences in the presence or absence of bands among accessions are indicative of differences in the genes controlling the different polypeptide subunits (Osanyinpeju & Odeigah, 1998). Also, the presence or absence of polypeptide bands has been found to be linked to the expression of certain characteristics such as wrinkled seeds and insect resistance (Odeigah & Osanyinpeju, 1996; Rao & Pernolett, 1981). The seed shape of NH/2016/P04 was observed to be wrinkled and the absence of the 24 kDa band in this accession may be responsible for this seed texture as it was the only accession expressing this characteristic. Seed storage proteins are non-enzymatic and have the sole purpose of providing proteins (nitrogen and sulphur source) required during germination and establishment of a new plant (Hameed et al., 2012). Legume seed storage proteins are mostly 7S and 11S globulins, which tend to be deficient in sulphur-containing amino acids (Tang & Sun, 2010). In mung bean, SDS-PAGE revealed that 11S globulin was composed of two bands: 40 kDa and 24 kDa, 8S vicilin was composed of 60 kDa, 48 kDa, 32 kDa and 26 kDa bands; and basic 7S globulin was composed of 28 kDa, 17 kDa and 16 kDa bands (Hameed et al., 2012; Mendoza, Adachi, Bernardo, & Utsumi, 2001).
In this study, peptides with molecular weights of 40 kDa and 24 kDa were detected that may correspond to 11S globulin, peptides with molecular weights of 48 kDa and 32 kDa were detected that may correspond to the 8S vicilin subunit, while 28 kDa and 16 kDa peptides were also detected that may correspond to the 7S globulin subunit.Barakat (2004) reported low levels of protein polymorphism among six cultivars of soybean in which five major bands were identified at the 72, 36, 32, 20 and 16 kDa regions.
In African yam bean, SDS-PAGE separated identical globulin, albumin and vicilin patterns for all 26 accessions studied (Machuka, 2001).Strelec, Has-Schon, and Vitale (2012) reported that barley varieties could be partially discriminated by albumin/globulin banding patterns using SDS-PAGE, whereas this was not possible with native PAGE which showed more or less identical protein patterns for all varieties.
Through the use of SDS-PAGE on total proteins it is possible to detect a useful band polymorphism to explore the diversity of P. biglobosa as was detected in this study, albeit at a low level.
Cluster analysis
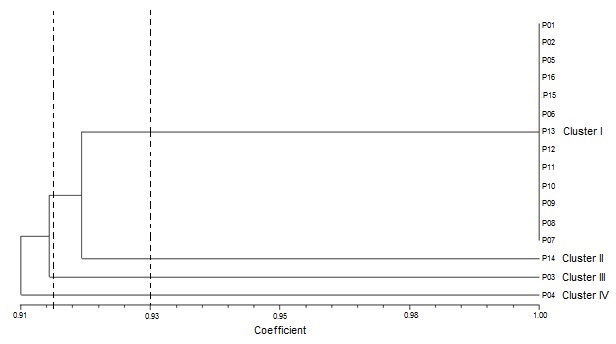
A dendrogram was constructed based on protein banding patterns using Jaccard’s similarity coefficients (Table 4). The dendrogram grouped the sixteen accessions into four clusters at 0.93 similarity coefficient (Figure 5). The first cluster grouped together the largest number (thirteen) of accessions which consisted of NH/2016/P01, NH/2016/P02, NH/2016/P05, NH/2016/P16, NH/2016/P15, NH/2016/P06, NH/2016/P13, NH/2016/P12, NH/2016/P11, NH/2016/P10, NH/2016/P09, NH/2016/P08 and NH/2016/P07. The majority of the members of this cluster had similarity coefficient of 1.00 suggesting them to be genetically identical. Cluster II consisted of NH/2016/P14. Accession NH/2016/P03, which was collected in Minna, Niger state and belonging to the Guinea Savanna agroecological zone, was separated alone into Cluster III, displaying pattern of geographic origin. Cluster IV consisted of NH/2016/P04 and was the most divergent of the sixteen tested accessions. The genetic similarity coefficient was 0.85 among NH/2016/P03, NH/2016/P04 and NH/2016/P14. Clustering showed pattern of geographic origin as eleven of the thirteen accessions grouped in Cluster I were collected from the Derived Savanna agro-ecological zone.
Genetic distance values give some idea of the level of genetic variability among selected species or accessions. The variation in genetic diversity among the sixteen P. biglobosa accessions ranged from 0.85 to 0.92 depicting a low genetic diversity (Table 4). All accessions in Cluster I had a similarity coefficient of 0.92 in any pairwise comparisons with NH/2016/P03, NH/2016/P04 and NH/2016/P14. The low levels of variability observed in P. biglobosa is congruent withSina (2006) who reported that the genetic distances among P. biglobosa trees in Burkina Faso were low (between 0 and 0.240), indicating that the populations were similar enough to belong to the same genetic group. Occurrence of a narrow genetic base from the accessions of P. biglobosa suggests that they may have resulted from a common gene pool and that fixation of variants through genetic drift has probably occurred.
Amusa et al. (2014) had earlier reported that close natural populations like P. biglobosa exhibited high genetic similarity and low genetic distance attributed to a high rate of exchange of gene flow between populations. Low genetic diversity was also observed in mung bean germplasm based on electrophoresis of seed storage proteins where a dendrogram analysis grouped the tested genotypes into three clusters at 93% homology (Hameed et al., 2012). Results of this study is similar to that obtained in cowpea in which seven landraces were separated into different clusters based on their geographical origin (Alghamdi et al., 2019). The high level of similarity in the accessions of P. biglobosa suggests that the seed storage proteins are highly conserved.
|
P01 |
P02 |
P03 |
P04 |
P05 |
P06 |
P07 |
P08 |
P09 |
P10 |
P11 |
P12 |
P13 |
P14 |
P15 |
P16 |
|
|---|---|---|---|---|---|---|---|---|---|---|---|---|---|---|---|---|
|
P01 |
1.000 |
|
|
|
|
|
|
|
|
|
|
|
|
|
|
|
|
P02 |
1.000 |
1.000 |
|
|
|
|
|
|
|
|
|
|
|
|
|
|
|
P03 |
0.923 |
0.923 |
1.000 |
|
|
|
|
|
|
|
|
|
|
|
|
|
|
P04 |
0.923 |
0.923 |
0.846 |
1.000 |
|
|
|
|
|
|
|
|
|
|
|
|
|
P05 |
1.000 |
1.000 |
0.923 |
0.923 |
1.000 |
|
|
|
|
|
|
|
|
|
|
|
|
P06 |
1.000 |
1.000 |
0.923 |
0.923 |
1.000 |
1.000 |
|
|
|
|
|
|
|
|
|
|
|
P07 |
1.000 |
1.000 |
0.923 |
0.923 |
1.000 |
1.000 |
1.000 |
|
|
|
|
|
|
|
|
|
|
P08 |
1.000 |
1.000 |
0.923 |
0.923 |
1.000 |
1.000 |
1.000 |
1.000 |
|
|
|
|
|
|
|
|
|
P09 |
1.000 |
1.000 |
0.923 |
0.923 |
1.000 |
1.000 |
1.000 |
1.000 |
1.000 |
|
|
|
|
|
|
|
|
P10 |
1.000 |
1.000 |
0.923 |
0.923 |
1.000 |
1.000 |
1.000 |
1.000 |
1.000 |
1.000 |
|
|
|
|
|
|
|
P11 |
1.000 |
1.000 |
0.923 |
0.923 |
1.000 |
1.000 |
1.000 |
1.000 |
1.000 |
1.000 |
1.000 |
|
|
|
|
|
|
P12 |
1.000 |
1.000 |
0.923 |
0.923 |
1.000 |
1.000 |
1.000 |
1.000 |
1.000 |
1.000 |
1.000 |
1.000 |
|
|
|
|
|
P13 |
1.000 |
1.000 |
0.923 |
0.923 |
1.000 |
1.000 |
1.000 |
1.000 |
1.000 |
1.000 |
1.000 |
1.000 |
1.000 |
|
|
|
|
P14 |
0.923 |
0.923 |
0.846 |
0.846 |
0.923 |
0.923 |
0.923 |
0.923 |
0.923 |
0.923 |
0.923 |
0.923 |
0.923 |
1.000 |
|
|
|
P15 |
1.000 |
1.000 |
0.923 |
0.923 |
1.000 |
1.000 |
1.000 |
1.000 |
1.000 |
1.000 |
1.000 |
1.000 |
1.000 |
0.923 |
1.000 |
|
|
P16 |
1.000 |
1.000 |
0.923 |
0.923 |
1.000 |
1.000 |
1.000 |
1.000 |
1.000 |
1.000 |
1.000 |
1.000 |
1.000 |
0.923 |
1.000 |
1.000 |
RAPD polymorphism
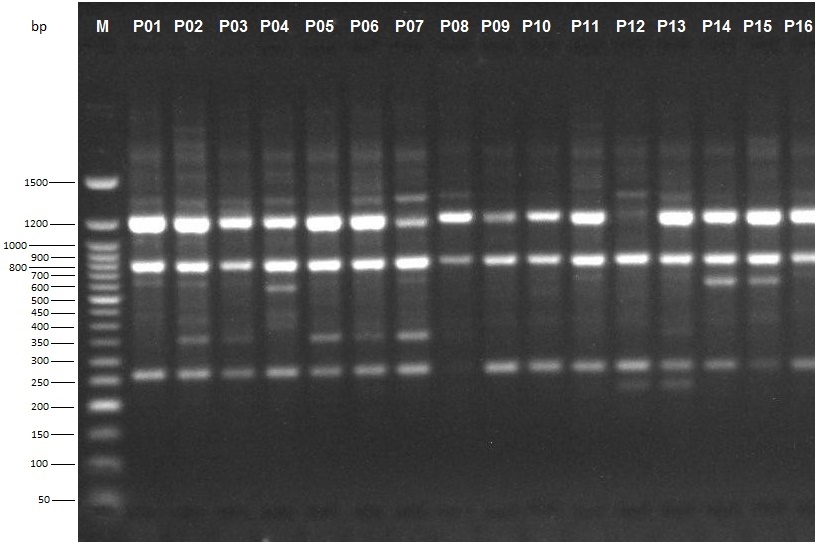
Genetic polymorphism is an indication of evolutionary adaptation, which has a main role in the survival of species in a changing environment (Stevens, Salomon, & Sun, 2007). In this study, Random Amplified Polymorphic DNA (RAPD) amplification profiles revealed a total of 256 alleles out of which 163 were polymorphic showing 63.67% polymorphism among the studied accessions. This relatively high polymorphism suggests a significant amount of genetic diversity among the accessions. A similar result was obtained among 11 soybean cultivars in which RAPD amplification profiles revealed 61.7% polymorphism using five primers (El-Kholy, 2013).
Alleles, ranging in size from 250 to 1500 basepairs (bp) and above, were scored for estimation of genetic relationship among the sixteen P. biglobosa accessions (Figure 6). An average of 10 alleles per primer was obtained in this study ranging from a minimum of four alleles using primer OPT05 to a maximum of 15 alleles using primer OPB10 (Table 2).
Genetic diversity is one of the important indices for the evaluation of genetic diversity among crop species (Narzary, Mahar, Rana, & Ranade, 2009; Tamboli et al., 2016). The genetic diversity in this study ranged from 0.41 to 0.93, suggesting a significant amount of variation among the 16 accessions evaluated (Table 2). An earlier report on genetic diversity assessment of 23 accessions of P. biglobosa from different agro-ecological zones using RAPD indicated weak genetic diversity (expected heterozygosity, HE= 0.05–0.18 and observed number of alleles, ONA = 1.11–1.65) (Amusa et al., 2014). The significance of the polymorphic information content (PIC) value is such that they are used to evaluate the amount of genetic diversity and are categorized as high (PIC > 0.05), medium (PIC < 0.05) and low (PIC < 0.25) (Abedian, Talebi, Golmohammdi, & Sayed-Tabatabaei, 2012). Polymorphic information content ranged from 0.39 for primer OPT05 to 0.93 for primer OPB10 (Table 2).
Fifteen of the sixteen polymorphic primers had PIC values greater than 0.5 indicating that RAPD can develop high-locus polymorphism, which is useful to assess genetic variability of the accessions. All primers showed an average PIC value of 0.79 and nine out of the sixteen primers exceeded the average. This relatively high polymorphism has been observed in studies of genetic diversity on soybean cultivars byChowdhury et al. (2001) and Barakat (2004).
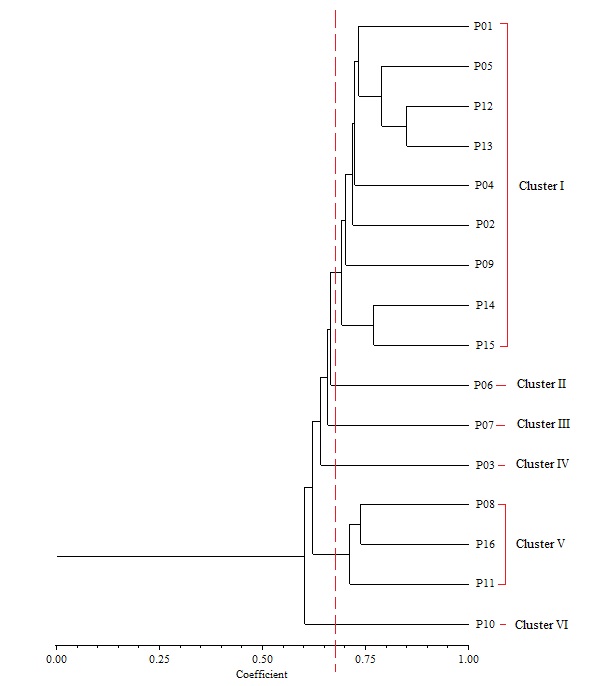
Cluster analysis based on UPGMA revealed six distinct clusters at a genetic similarity coefficient of 0.68 on the UPGMA dendrogram (Figure 7). Cluster I consisted of accessions NH/2016/P01, NH/2016/P05, NH/2016/P12, NH/2016/P13, NH/2016/P04, NH/2016/P02, NH/2016/P09, NH/2016/P14 and NH/2016/P15. All the accessions grouped together in Cluster 1 were collected from Derived Savanna except accession NH/2016/P12 which was collected from Guinea Savanna. This suggests that gene flow between the different locations may have occurred as a result of movement of germplasm and exchange of genetic material among farmers and markets. Cluster II consisted of NH/2016/P06; Cluster III consisted of NH/2016/P07 while Cluster IV consisted of NH/2016/P03. Accessions NH/2016/P08, NH/2016/P16 and NH/2016/P11 grouping together in Cluster V were collected from Derived Savanna. Accession NH/2016/P10 collected from Ogoja, Cross River State in the Humid Forest zone grouped alone in Cluster VI. Thus, in the UPGMA analysis of the RAPD profiles, accessions from same agroecological zone grouped together, while in other cases they were placed in different clusters. For most accessions in this study there was similar clustering pattern of geographically closer accessions, indicating significant association between genetic similarity and geographical distance. This does not agree with a report of Adesoye et al. (2013) who reported that distribution of P. biglobosa genotypes among clusters did not correspond with their geographical patterns. The lowest similarity was recorded between NH/2016/P10 and NH/2016/P06, NH/2016/P07, NH/2016/P03. The highest similarity was recorded between accessions NH/2016/P12 and NH/2016/P13, followed by accessions NH/2016/P05 and both NH/2016/P12, NH/2016/P13. Accessions NH/2016/P05 and NH/2016/P13 with narrow genetic distance were collected from the same agro-ecological zone (Derived Savanna). This result corroborates findings of Hamrick and Godt (1989) in which species with small geographic ranges maintained less genetic diversity than geographically widespread species. RAPD clearly distinguished some accessions by accession specific fragments (Figure 6). Therefore, RAPD markers can successfully be used to produce variety specific fingerprints in P. biglobosa accessions and are a valuable tool for assessing genetic diversity.
Conclusion
The low level of variation observed among the accessions as revealed by SDS-PAGE limits the method’s applicability to distinguish accessions. Nevertheless, SDS-PAGE was able to detect a polymorphic polypeptide with molecular weight of approximately 24 kDa which was present in all accessions but absent in NH/2016/P04. Thus, SDS-PAGE may not be used to identify accessions based on intraspecific variation; rather it might be more suitable to identify interspecific variation.
RAPD-PCR markers were more informative and could be used to discriminate between P. biglobosa accessions. Four RAPD primers (OPB10, OPT07, OPB04, OPT12) revealed high degrees of polymorphism among the accessions. The identification of accessions with maximum genetic divergence should be optimized in breeding programmes. The RAPD marker is therefore a more efficient tool to discriminate between accessions of P. biglobosa.
Implications of findings to the conservation and sustainable use of Parkia biglobosa genetic resources
-
The variation observed in qualitative traits and 100-seed weight among the sixteen accessions of P. biglobosa across the three agro-ecological zones of Nigeria indicates their potential for domestication through selection towards conservation and breeding.
-
Cluster analysis of the seed protein profile identified NH/2016/P04 as genetically distinct as it was clustered alone and was the most divergent of the sixteen tested accessions. The absence of the 24kDa band in accession NH/2016/P04 distinguishes it from all the other accessions. It can be adopted as parental line for heterosis crossing and should be exploited for conservation, breeding and sustainable utilization.
-
Four selected RAPD primers (OPB10, OPT07, OPB04 and OPT12) can be used to discriminate the accessions of P. biglobosa.
-
The highly diversified accessions of P. biglobosa indicate potential for domestication through selection in breeding programmes.
-
Most accessions from the same agroecological zone clustered together suggesting that there is a strong correlation between genetic similarity and geographic proximity.
-
The homogeneity of alleles among the studied P. biglobosa accessions suggests possible loss of intraspecific genetic diversity. The weakening gene pool and diversity observed can be enhanced through more germplasm collections, particularly from the diverse agroecological zones of Nigeria for better genetic characterization using more specific markers towards conservation, breeding and sustainable utilization.
Author contributions
P. E. Akin-Idowu designed the experiment. P. E. Akin-Idowu, A. O. Aduloju and O. I. Akinyoola executed the experiment. O. I. Akinyoola , P. E. Akin-Idowu and D. O. Ibitoye performed the analysis. P. E. Akin-Idowu, O. I. Akinyoola, U. G. Adebo, U. Orkpeh, Y. O. Olagunju and D. O. Ibitoye wrote the manuscript. All the authors read and approved its submission.
Conflict of interest statement
The authors declare no conflict of interest.