Multivariate analysis of morpho-biometric diversity in indigenous chickens from two zones of Oromia Regional State, Ethiopia
Fikrineh Negash*,a and Usman Abdulkadirb
a Freelance Researcher and Consultant, Addis Ababa, Ethiopia
b Adami Tulu Agricultural Research Center, P. O. Box 35, Batu, Ethiopia
* Corresponding author: Fikrineh Negash
Abstract: This study characterized the morpho-biometric features of indigenous chickens across six districts of West Arsi and East Shoa zones of Oromia Region State, Ethiopia, using multivariate techniques. Data were collected from 621 mature chickens (134 males, 487 females). Univariate analysis revealed significant district-level variation in morphometric traits (p < 0.001), with Lume chickens exhibiting the highest values, and Siraro and Shashemene the lowest. Shank length and body weight had the highest model explanatory power (R2: 0.58–0.64). Qualitative traits displayed distinct patterns, with red and brown plumage predominating in males and females, respectively, while rose and single combs, white–red earlobes, white skin, plain head shapes, and yellow shanks were the most prevalent. Multiple correspondence analysis highlighted associations between qualitative traits and districts, with the first two dimensions explaining 70.23% of the variance. Quadratic discriminant analysis classified chickens into their districts of origin with 41.80–91.30% accuracy, which was highest for Bora and Lume. Stepwise discriminant analysis identified seven traits (females) and four (males) as key discriminators, while canonical discriminant analysis revealed that the first two functions explained 98% of the variance in both female and male chickens, with strong between-district differentiation. Biplots confirmed that East Shoa chickens (larger in size) clustered separately from West Arsi populations. These findings underscore the phenotypic diversity of Ethiopian indigenous chickens, which is likely shaped by genetic, environmental and cultural factors. This diversity offers opportunities for targeted breeding and conservation programmes. Future studies should integrate genetic analyses to elucidate admixture and enhance breeding strategies.
Keywords: East Shoa zone, Morphometric traits, Multivariate analysis, Phenotypic diversity, West Arsi zone
Introduction
Poultry production serves as a critical component of Ethiopia's livestock system, playing a pivotal role in enhancing food security, generating income, and improving livelihoods for smallholder farmers. According to recent statistics (FAO, 2024), the country's poultry population stands at approximately 55 million chickens, with indigenous breeds being predominant. Despite their low productivity compared with commercial breeds, indigenous chickens are well-adapted to local environmental challenges. They thrive under low-input management systems, enduring poor feed resources, harsh climatic conditions and prevalent disease pressures. These adaptations derive from hereditary traits that produce varied responses to environmental stimuli, closely tied to anatomical-physiological features developed through natural selection (Ngeno et al, 2014). This evolutionary process has resulted in a wide genetic diversity within indigenous chicken populations.
The phenotypic diversity observed in Ethiopian indigenous chicken populations (Dana et al, 2010; Melesse and Negesse, 2011; Moreda et al, 2014; Negassa et al, 2014; Getachew et al, 2016; Tareke et al, 2018; Bekele et al, 2021; Mustefa et al, 2021; Mekonnen et al, 2023; Muluneh et al, 2023; Belay et al, 2024; Chebo et al, 2024; Markos et al, 2024; Begna et al, 2025) reflects their adaptation to various agroecological conditions. The remarkable diversity in indigenous chicken genetic resources likely stems from heterogeneous agroecological zones, diverse climatic conditions and distinct poultry-keeping practices shaped by varying production objectives (Dessie et al, 2011; Lawal and Hanotte, 2021). These chickens have developed both distinctive phenotypes and unique genetic profiles through generations of targeted breeding by local communities and natural selection (Mekonnen et al, 2023). Moreover, the observed diversity has been attributed to ethnic and cultural influences, historical migration patterns, and the country's strategic location in the Horn of Africa, serving as a crossroads between Asia and the Western world (Hassen et al, 2007).
This diversity serves as a vital foundation for breeding programmes aimed at improving productivity while preserving adaptive traits. It also plays a crucial role in the food security and livelihoods of marginalized farmers (Cabarles et al, 2012). However, these valuable genetic resources face mounting threats from shifting production systems, uncontrolled crossbreeding, environmental degradation and natural disasters (Besbes, 2009). Such pressures risk permanent genetic erosion, particularly in areas where exotic chicken breeds are being introduced. Since the loss of indigenous genetic resources is irreversible, urgent conservation measures are needed to safeguard these populations and their unique traits (Liyanage et al, 2015). The characterization of indigenous chickens – including their production environments and management systems – should serve as a fundamental requirement for developing sustainable conservation and utilization strategies as well as genetic improvement programmes for these genetic resources (Yussif et al, 2023; Liswaniso et al, 2024).
Both quantitative and qualitative morphological traits provide valuable tools for assessing genetic diversity in indigenous chickens (Getachew et al, 2016). This characterization yields critical information about current utilization potential while documenting population status and evaluating extinction risk (Tixier-Boichard et al, 2008; FAO, 2012). While numerous phenotypic characterization studies have been conducted across Ethiopia, a notable gap remains in multivariate analyses of chicken populations. This study specifically addresses this gap by employing multivariate statistical techniques to examine the morphological and biometric traits of indigenous chickens in selected districts of the West Arsi and East Shewa zones of the Oromia Regional State. This research aims to identify distinct phenotypic variations that will inform strategic breeding approaches and promote sustainable utilization of Ethiopia's valuable indigenous chicken genetic resources.
Materials and methods
Study area
This study was conducted in three districts, each from the East Shoa (i.e. Adama, Bora and Lume) and West Arsi (i.e. Dodola, Shashemene and Siraro) zones of Oromia Regional State, located in central and south-central Ethiopia. The districts were purposively chosen because of their socioeconomic importance in poultry production and high populations of indigenous chickens. Data were collected from randomly selected smallholder farmers who reared exclusively indigenous, non-descript chicken types – traditional breeds naturally adapted to local conditions.
Data generation
Morphometric measurements and qualitative morphological features were collected from 621 mature indigenous chickens (134 males and 487 females) aged eight months or older, an age threshold defined by Dana et al (2010). The number of male chickens from Adama, Lume, Bora, Dodola, Shashemene and Siraro were 25, 22, 23, 21, 21 and 22, respectively, while the corresponding numbers of female chickens were 79, 83, 79, 81, 81 and 84. Age was determined through farmer recall, and this threshold was selected because indigenous chickens are known to mature slowly (Melesse and Negesse, 2011). Sampling mature animals was also necessary due to the age-dependent expression and environmentally sensitive nature of most quantitative traits (FAO, 2012). Body weight was measured using a hanging spring balance, while linear measurements were taken with a textile measuring tape.
All the measurements followed standardized protocols (FAO, 2012):
- Body length (BL): Distance from the beak tip (rostrum maxillae) to the tail base (cauda; excluding tail feathers)
- Chest circumference (CC): Girth at the deepest point of the breast
- Shank length (SL): Tarsometatarsus length, measured from the flexed hock joint to the spur base
- Shank circumference (SC): Circumference at the midpoint of the shank
- Wing span (WS): Distance between the tips of both fully extended wings
- Wattles length (WL): Linear measurement from the wattle’s origin to its distal tip
- Comb length (CL): Distance from the comb’s anterior insertion (near the beak) to the posterior tip of the largest lobe.
Qualitative traits, including feather distribution and morphology, body plumage colour, shank colour, shank feather (absent/present), skin colour, earlobe colour, earlobe presence, comb type, head shape and spur presence, were also evaluated on the basis of standardized descriptors used in previous studies (Dana et al, 2010; Melesse and Negesse, 2011).
Statistical analysis
The data were analyzed using various procedures in JMP Pro 17.0.0 (SAS Institute Inc., 2022). First, separate one-way ANOVAs were conducted for male and female chickens to examine differences in morphometric variables among chickens from the six districts. Significantly different means were compared using Tukey's HSD test at p ≤ 0.05. The statistical model used was:
Where Yij is the individual morphometric or morphological measurement; µ is the overall mean; Ai is the fixed effect of the district (i = 1 to 6); and eij is the random error.
Second, contingency analysis incorporating frequency distributions (percentages) and Pearson's chi-square (χ²) tests were performed to assess qualitative morphological variables. The χ² test was employed to assess the degree of variation in these traits across the six districts. Third, multiple correspondence analysis (MCA) was used to visualize associations among categorical morphological traits and identify variation patterns.
Finally, discriminant analysis techniques – including quadratic discriminant analysis (QDA), stepwise discriminant analysis (SDA) and canonical discriminant analysis (CDA) – were applied (JMP Statistical Discovery LLC, 2022) to discriminate chickens from the six districts on the basis of morphometric variables. The original eight traits were analyzed using QDA separately for males and females, with classification accuracy determined as the percentage of individuals correctly assigned to their respective districts. The SDA was then applied to these eight traits to select the most discriminative ones. The selected traits were subsequently analyzed using CDA to evaluate morphometric differentiation among district populations. CDA drives set new variables, called canonical functions (CAN), from linear combinations of the original variables (Conte et al, 2018). These functions are designed to maximize the discrimination among the classes specified by the categorical grouping variable (i.e. district).
Results
Univariate analysis
Table 1 presents descriptive statistics for morphometric variables of indigenous chickens sampled across six districts, including univariate test results. All traits showed highly significant variation (p < 0.001) among districts for both sexes. The difference was also observed between male and female birds. Chickens from Lume district consistently exhibited the highest values for most traits, while those from Siraro and Shashemene districts showed the lowest values. Notably, Lume chickens recorded the highest mean body weights (1854.55g for males and 1435.37g for females), whereas Siraro and Shashemene chickens had the lowest weights. SL and BW demonstrated the highest R² and F values in both sexes. The greatest coefficients of variation (CV) were observed for WL and BW, ranging from 8.56% to 33.72% in males and from 6.28% to 45.52% in females.
Tables 2, 3 and 4 present descriptive statistics for qualitative traits. The body plumage colour distribution varied significantly across districts for both sexes (Table 2; p < 0.0001). Among males, red plumage predominated (52.99%), particularly in Siraro district (90.91%), while white and multi-coloured plumage were uncommon. Females showed different patterns, with brown plumage being most common (50.72%) and Kokima colouration being prevalent in Siraro (41.67%), following brown colour. District-level variation in comb type was more pronounced in females (p < 0.0001; Table 3), with the single comb being the most common (44.03%). Rose and pea combs were more common in specific districts.
Most qualitative traits exhibited significant district-specific patterns, except for feather distribution and shank feather presence (Table 4). The majority of chickens had normal feathers (94.52%), though silky feathers were present in Shashemene and Siraro. Yellow shanks predominated (51.69%), especially in Siraro, while white skin was most common overall (62.80%). However, yellow skin prevailed in Shashemene and Siraro. Nearly all chickens had earlobes (97.58%), with white and red or red-spotted white being dominant (36.07%), particularly in Adama, Lume and Bora. Plain heads were most common (66.51%), except in Adama, where snake-like heads predominated (42.31%). While most chickens lacked spurs (55.39%), the majority in Shashemene district possessed spurs.
Table 1. Descriptive statistics and univariate test results for morphometric traits of chickens sampled across six districts (n = 621; 134 males and 487 females). The levels (mean values) not connected by the same letter in a row are significantly different at p ≤ 0.05. Standard deviations (SD) indicate the average variability across all districts. CV, coefficients of variation; BW, body weight; BL, body length; CC, chest circumference; SL, shank length; SC, shank circumference; WS, wingspan; CL, comb length; WL, wattle length; AD, Adama; LM, Lume; BR, Bora; DD, Dodola; SH, Shashemene; SR, Siraro.
|
Variable |
Sex |
District |
SD |
CV, % |
R2 |
F value |
p value |
|||||
|
AD |
LM |
BR |
DD |
SH |
SR |
|||||||
|
BW, g |
Male |
1412.00b |
1854.55a |
1256.22bc |
1090.48cd |
971.43d |
977.27d |
402.21 |
31.74 |
0.58 |
35.21 |
< 0.0001 |
|
Female |
1206.33b |
1435.37a |
1085.90c |
841.98d |
720.99e |
715.48e |
342.93 |
34.34 |
0.61 |
148.61 |
< 0.0001 |
|
|
BL, cm |
Male |
38.52b |
40.86a |
36.57b |
36.62b |
36.81b |
36.64b |
2.79 |
7.40 |
0.32 |
12.14 |
< 0.0001 |
|
Female |
35.79a |
36.10a |
34.75b |
33.16c |
33.26c |
32.90c |
2.32 |
6.76 |
0.31 |
43.57 |
< 0.0001 |
|
|
CC, cm |
Male |
27.80ab |
29.55a |
25.70c |
28.86ab |
27.33bc |
27.09bc |
2.63 |
9.50 |
0.22 |
7.40 |
< 0.0001 |
|
Female |
25.44c |
26.40ab |
24.49d |
26.56a |
26.23abc |
25.67bc |
2.08 |
8.05 |
0.11 |
12.25 |
< 0.0001 |
|
|
SL, cm |
Male |
9.98b |
10.89a |
10.09b |
8.33c |
8.40c |
8.25c |
1.31 |
13.95 |
0.62 |
42.40 |
< 0.0001 |
|
Female |
8.28b |
8.82a |
8.22b |
6.88c |
6.86c |
6.88c |
1.01 |
13.23 |
0.64 |
171.23 |
< 0.0001 |
|
|
SC, cm |
Male |
4.64a |
4.98a |
4.50a |
3.98b |
3.92b |
3.84b |
0.72 |
16.63 |
0.34 |
13.21 |
< 0.0001 |
|
Female |
3.94b |
4.16a |
3.77b |
3.43c |
3.30cd |
3.16d |
0.57 |
15.68 |
0.40 |
63.38 |
<0.0001 |
|
|
WS, cm |
Male |
41.36b |
45.77a |
40.39b |
42.43b |
41.95b |
41.86b |
3.62 |
8.56 |
0.22 |
7.11 |
<0.0001 |
|
Female |
38.07b |
39.13a |
38.09b |
37.50bc |
36.95c |
36.82c |
2.37 |
6.28 |
0.11 |
12.06 |
<0.0001 |
|
|
CL, cm |
Male |
6.10b |
7.68a |
6.30b |
6.17b |
5.67b |
5.61b |
1.67 |
26.67 |
0.18 |
5.14 |
0.0002 |
|
Female |
3.33b |
3.95a |
2.95cd |
3.09bc |
2.99bcd |
2.63d |
0.91 |
28.83 |
0.21 |
25.16 |
<0.0001 |
|
|
WL, cm |
Male |
3.60bc |
4.66a |
3.37bc |
3.93ab |
3.10bc |
2.84c |
1.21 |
33.72 |
0.24 |
7.99 |
<0.0001 |
|
Female |
1.54b |
1.85a |
1.39bc |
1.16cd |
1.09d |
0.93d |
0.61 |
45.52 |
0.26 |
33.79 |
<0.0001 |
|
Table 2. Frequency distribution (percent) of body plumage colour and chi-square test results by sex (n = 621; 134 males and 487 females). Local plumage colour names are as follows: Gebsima, wheaten stripes on black; Teterima, black or red speckles on white; Kokima, white or grey stripes on brown/red; Wesera, mixed white and red; Zigrima, black-and-white spotted (Dana et al, 2010; Melesse and Negesse, 2011). AD, Adama; LM, Lume; BR, Bora; DD, Dodola; SH, Shashemene; SR, Siraro.
|
Colour |
District |
Total mean |
Chi-square |
p value |
|||||
|
AD |
LM |
BR |
DD |
SH |
SR |
||||
|
Male |
69.64 |
< 0.0001 |
|||||||
|
White |
16.00 |
36.36 |
13.04 |
14.29 |
0.00 |
0.00 |
13.43 |
||
|
Red |
32.00 |
22.73 |
43.48 |
61.93 |
71.43 |
90.91 |
52.99 |
||
|
Gebsima |
24.00 |
9.09 |
17.39 |
4.76 |
14.29 |
0.00 |
11.94 |
||
|
Brown |
20.00 |
13.64 |
0.00 |
0.00 |
0.00 |
4.55 |
6.72 |
||
|
Kokima |
0.00 |
0.00 |
0.00 |
4.76 |
0.00 |
0.00 |
0.75 |
||
|
Wesera |
8.00 |
4.55 |
21.74 |
14.29 |
14.29 |
4.55 |
11.19 |
||
|
Multicolour |
0.00 |
13.64 |
4.35 |
0.00 |
0.00 |
0.00 |
2.99 |
||
|
Female |
152.33 |
< 0.0001 |
|||||||
|
White |
12.66 |
15.66 |
17.72 |
9.88 |
2.47 |
0.00 |
9.65 |
||
|
Black |
13.92 |
7.23 |
10.13 |
16.05 |
0.00 |
1.19 |
8.01 |
||
|
Red |
2.53 |
6.02 |
12.66 |
1.23 |
0.00 |
0.00 |
3.71 |
||
|
Gebsima |
2.53 |
3.61 |
1.27 |
1.23 |
0.00 |
0.00 |
1.44 |
||
|
Teterima |
5.06 |
0.00 |
3.80 |
2.47 |
2.47 |
0.00 |
2.26 |
||
|
Brown |
51.90 |
42.17 |
44.30 |
39.51 |
70.37 |
55.95 |
50.72 |
||
|
Kokima |
10.13 |
16.87 |
7.59 |
29.63 |
23.46 |
41.67 |
21.77 |
||
|
Wesera |
0.00 |
6.02 |
2.53 |
0.00 |
0.00 |
0.00 |
1.44 |
||
|
Zigrima |
1.27 |
2.41 |
0.00 |
0.00 |
0.00 |
0.00 |
0.62 |
||
|
Multicolour |
0.00 |
0.00 |
0.00 |
0.00 |
1.23 |
1.19 |
0.41 |
||
Table 3. Frequency distribution (percent) of comb type and chi-square test results by sex (n = 621; 134 males and 487 females). AD, Adama; LM, Lume; BR, Bora; DD, Dodola; SH, Shashemene; SR, Siraro.
|
Comb type |
District |
Total mean |
Chi-square |
p value |
|||||
|
AD |
LM |
BR |
DD |
SH |
SR |
||||
|
Male |
15.80 |
0.7292 |
|||||||
|
Single |
44.00 |
45.45 |
43.48 |
23.81 |
33.33 |
31.82 |
37.31 |
||
|
Rose |
48.00 |
50.00 |
39.13 |
66.67 |
47.62 |
63.64 |
52.24 |
||
|
Pea |
4.00 |
0.00 |
0.00 |
4.76 |
4.76 |
0.00 |
2.24 |
||
|
Strawberry |
4.00 |
4.55 |
13.04 |
4.76 |
14.29 |
4.55 |
7.46 |
||
|
Cushion |
0.00 |
0.00 |
4.35 |
0.00 |
0.00 |
0.00 |
0.75 |
||
|
Female |
68.53 |
< 0.0001 |
|||||||
|
Single |
31.65 |
48.19 |
42.31 |
49.39 |
51.85 |
40.48 |
44.03 |
||
|
Rose |
30.38 |
33.73 |
37.18 |
23.46 |
29.63 |
44.05 |
33.13 |
||
|
Pea |
21.52 |
2.41 |
5.13 |
22.22 |
14.81 |
14.29 |
13.77 |
||
|
Walnut |
0.00 |
6.02 |
2.56 |
0.00 |
0.00 |
0.00 |
1.44 |
||
|
Strawberry |
15.19 |
8.43 |
10.26 |
4.94 |
3.70 |
1.19 |
7.20 |
||
|
Cushion |
1.27 |
1.20 |
2.56 |
0.00 |
0.00 |
0.00 |
0.82 |
||
Table 4. Frequency distributions (percent) and chi-square test results for qualitative morphological traits (n = 621; 134 males and 487 females). AD, Adama; LM, Lume; BR, Bora; DD, Dodola; SH, Shashemene; SR, Siraro; Ebab-ras, snake-like head; Gutya, crest head.
|
Trait |
District |
Total mean |
Chi-square |
p value |
|||||
|
AD |
LM |
BR |
DD |
SH |
SR |
||||
|
Feather morphology |
42.38 |
< 0.0001 |
|||||||
|
Normal |
100.00 |
99.05 |
100.00 |
95.10 |
85.29 |
87.74 |
94.52 |
||
|
Silky |
0.00 |
0.95 |
0.00 |
4.90 |
14.71 |
12.26 |
5.48 |
||
|
Feather distribution |
10.84 |
0.0546 |
|||||||
|
Normal |
100.00 |
97.14 |
100.00 |
100.00 |
100.00 |
99.06 |
99.36 |
||
|
Naked neck |
0.00 |
2.86 |
0.00 |
0.00 |
0.00 |
0.94 |
0.64 |
||
|
Shank colour |
127.87 |
< 0.0001 |
|||||||
|
White |
50.96 |
45.71 |
39.22 |
13.73 |
20.59 |
9.43 |
29.95 |
||
|
Black |
8.65 |
0.95 |
3.92 |
2.94 |
1.96 |
1.89 |
3.38 |
||
|
Yellow |
26.92 |
41.90 |
37.25 |
56.86 |
69.61 |
77.36 |
51.69 |
||
|
Green |
1.92 |
0.00 |
0.98 |
0.00 |
0.00 |
0.00 |
0.48 |
||
|
Grey /grey-blue |
11.54 |
11.43 |
18.63 |
26.47 |
7.84 |
11.32 |
14.49 |
||
|
Shank feather |
8.06 |
0.1529 |
|||||||
|
Absent |
96.15 |
96.19 |
98.04 |
98.04 |
100.00 |
100.00 |
98.07 |
||
|
Present |
3.85 |
3.81 |
1.96 |
1.96 |
0.00 |
0.00 |
1.93 |
||
|
Skin colour |
246.07 |
< 0.0001 |
|||||||
|
White |
82.69 |
82.86 |
85.29 |
50.98 |
30.39 |
44.34 |
62.80 |
||
|
Yellow |
12.50 |
1.90 |
0.98 |
47.06 |
66.67 |
55.66 |
30.76 |
||
|
Blue-black |
0.00 |
0.00 |
0.00 |
1.96 |
2.94 |
0.00 |
0.81 |
||
|
Grey |
4.81 |
15.24 |
13.73 |
0.00 |
0.00 |
0.00 |
5.64 |
||
|
Earlobe presence |
14.01 |
0.0155 |
|||||||
|
Absent |
0.96 |
0.00 |
0.00 |
5.88 |
4.90 |
2.85 |
2.42 |
||
|
Present |
99.04 |
100.00 |
100.00 |
94.12 |
95.10 |
97.17 |
97.58 |
||
|
Earlobe colour |
301.28 |
< 0.0001 |
|||||||
|
White |
10.58 |
5.71 |
28.43 |
41.18 |
25.49 |
13.21 |
20.61 |
||
|
Red |
22.12 |
37.14 |
18.63 |
38.24 |
23.53 |
28.30 |
28.02 |
||
|
Yellow |
0.00 |
0.00 |
0.00 |
5.88 |
27.45 |
39.62 |
12.24 |
||
|
White and red |
66.35 |
56.19 |
51.96 |
13.73 |
14.71 |
13.21 |
36.07 |
||
|
Yellow and red |
0.00 |
0.00 |
0.00 |
0.98 |
8.82 |
5.66 |
2.58 |
||
|
Black |
0.96 |
0.95 |
0.98 |
0.00 |
0.00 |
0.00 |
0.48 |
||
|
Head shape |
66.06 |
< 0.0001 |
|||||||
|
Ebab-ras |
42.31 |
24.76 |
24.51 |
23.53 |
14.71 |
4.72 |
22.38 |
||
|
Gutya |
15.38 |
4.76 |
16.67 |
9.80 |
13.73 |
6.60 |
11.11 |
||
|
Plain/flat |
42.31 |
70.48 |
58.82 |
66.67 |
71.57 |
88.68 |
66.51 |
||
|
Spur presence |
32.42 |
< 0.0001 |
|||||||
|
Absent |
55.77 |
60.95 |
60.78 |
59.80 |
30.39 |
64.15 |
55.39 |
||
|
Present |
44.23 |
39.05 |
39.22 |
40.20 |
69.61 |
35.85 |
44.61 |
||
Multivariate analysis
The two-dimensional biplot (Figure 1) illustrates the distribution and associations of qualitative morphological traits across districts. Chickens from Shashemene and Siraro districts clustered closely with yellow skin, while those from Adama, Lume and Bora grouped near grey skin, white plumage, strawberry combs, white–red combs and white shanks. Dodola chickens were strongly associated with plain head and brown plumage. Traits such as silky feathers, yellow–red earlobe, red plumage and yellow skin were positioned far from the origin of the first dimension (Dim 1). Similarly, traits such as Zigirima plumage, cushion comb, Wesera plumage, green shank, silky feather, shank feather, Gebsima plumage, red plumage, naked neck and walnut comb, among others, were distantly located from the origin of Dim 2.
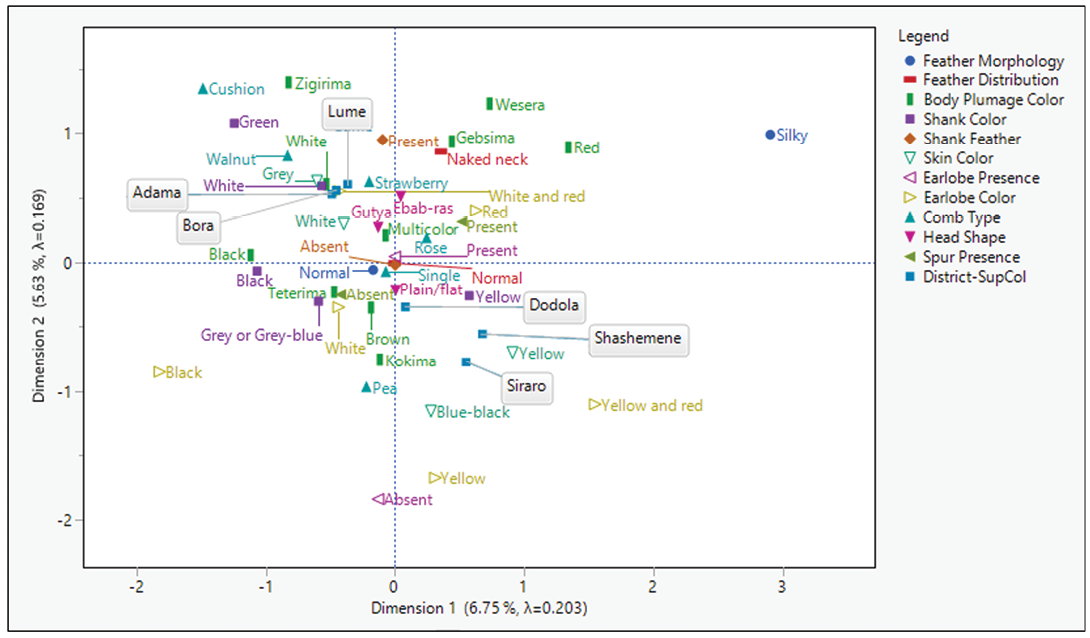
Table 5 presents the Benzécri-adjusted inertia decomposition, revealing that the first two dimensions collectively explained 70.23% of the total variance (Dim 1: 47.19%; Dim 2: 23.04%). Partial contributions to inertia (Supplemental Table 1) indicate that Dim 1 was primarily defined by silky feathers, red plumage, yellow skin/shank, spur presence, and red earlobes, while Dim 2 was driven by yellow skin/earlobes, red plumage, red-spotted white earlobes, white skin and pea combs.
Table 5. Benzécri-adjusted inertia decomposition of qualitative morphological traits (n = 621; 134 males and 487 females).
|
Dimension |
Inertia |
Adjusted inertia |
Percent |
Cumulative percent |
|
1 |
0.2025 |
0.0151 |
47.19 |
47.19 |
|
2 |
0.1689 |
0.0074 |
23.04 |
70.23 |
|
3 |
0.1513 |
0.0044 |
13.76 |
84.03 |
|
4 |
0.1298 |
0.0018 |
5.74 |
89.76 |
|
5 |
0.1227 |
0.0012 |
3.83 |
93.60 |
|
6 |
0.1150 |
0.0007 |
2.20 |
95.79 |
|
7 |
0.1111 |
0.0005 |
1.55 |
97.34 |
|
8 |
0.1074 |
0.0003 |
1.02 |
98.36 |
|
9 |
0.1040 |
0.0002 |
0.65 |
99.01 |
|
10 |
0.1018 |
0.0001 |
0.45 |
99.46 |
|
11 |
0.0998 |
0.0001 |
0.30 |
99.76 |
|
12 |
0.0967 |
0.0000 |
0.13 |
99.89 |
|
13 |
0.0954 |
0.0000 |
0.08 |
99.96 |
|
14 |
0.0938 |
0.0000 |
0.03 |
100.00 |
|
15 |
0.0920 |
0.0000 |
0.00 |
100.00 |
In this study, QDA was employed instead of linear discriminant analysis (LDA) due to the presence of unequal covariance matrices across the different chicken populations. The analysis successfully classified chickens into their respective districts of origin (Table 6). Chickens from Bora (88.31% of females and 91.30% of males) and Lume (67.10% of females and 90.90% of males) showed the highest classification accuracy, whereas Adama females and Dodola males had the lowest. Misclassification patterns revealed that 36.71% of female and 24.00% of male chickens from Adama were misassigned to Bora, while 19.00% of females and 16% of males were misassigned to Lume. Similarly, 24.39% of females and 9.09% of males from Lume were misclassified to Bora. Additionally, 22.10% of female and 23.80% of male chickens from Dodola were erroneously grouped into Shashemene, with a similar proportion of both sexes misassigned to Siraro. Furthermore, a substantial proportion of female and male chickens from Shashemene and Siraro were reciprocally misclassified into each other’s districts.
The SDA identified seven morphometric traits (SL, BW, CC, CL, WS, SC and BL) for females and only four traits (SL, CC, BW and WS) for males as the most discriminative variables (Table 7). The analysis revealed that BW, CC and SL in females and SL in males exhibited the highest discriminatory power (indicated by their higher F and Wilks’ Lambda values; p < 0.0001), while BL in females and WS in males were less effective for group discrimination (reflected by their lower F values).
Table 6. Classification results showing the number (and percentage) of correctly assigned male and female chickens (n = 621; 134 males and 487 females). AD, Adama; LM, Lume; BR, Bora; DD, Dodola; SH, Shashemene; SR, Siraro.
|
District |
AD |
LM |
BR |
DD |
SH |
SR |
Total |
|
Female |
|||||||
|
AD |
33 (41.80) |
15 (19.00) |
29 (36.71) |
0 (0.00) |
2 (2.53) |
0 (0.00) |
79 (100.00) |
|
LM |
6 (7.32) |
55 (67.10) |
20 (24.39) |
1 (1.22) |
0 (0.00) |
0 (0.00) |
82 (100.00) |
|
BR |
2 (2.60) |
6 (7.79) |
68 (88.31) |
0 (0.00) |
0 (0.00) |
1 (1.30) |
77 (100.00) |
|
DD |
1 (1.30) |
0 (0.00) |
2 (2.60) |
41 (53.20) |
17 (22.10) |
16 (20.80) |
77 (100.00) |
|
SH |
2 (2.53) |
0 (0.00) |
1 (1.27) |
7 (8.86) |
48 (60.80) |
21 (26.60) |
79 (100.00) |
|
SR |
1 (1.25) |
0 (0.00) |
4 (5.00) |
4 (5.00) |
24 (30.00) |
47 (58.80) |
80 (100.00) |
|
Male |
|||||||
|
AD |
13 (52.00) |
4 (16.00) |
6 (24.00) |
0 (0.00) |
2 (8.00) |
0 (0.00) |
25 (100.00) |
|
LM |
0 (0.00) |
20 (90.90) |
2 (9.09) |
0 (0.00) |
0 (0.00) |
0 (0.00) |
22 (100.00) |
|
BR |
1 (4.35) |
0 (0.00) |
21 (91.30) |
1 (4.35) |
0 (0.00) |
0 (0.00) |
23 (100.00) |
|
DD |
0 (0.00) |
1 (4.76) |
0 (0.00) |
10 (47.60) |
5 (23.80) |
5 (23.80) |
21 (100.00) |
|
SH |
0 (0.00) |
0 (0.00) |
0 (0.00) |
0 (0.00) |
16 (84.20) |
3 (15.80) |
19 (100.00) |
|
SR |
0 (0.00) |
0 (0.00) |
0 (0.00) |
3 (13.60) |
3 (13.60) |
16 (72.70) |
22 (100.00) |
Table 7. Stepwise selection summary of the most discriminative morphometric traits for female and male chickens (n = 621; 134 males and 487 females). BW, body weight; BL, body length; CC, chest circumference; SL, shank length; SC, shank circumference; WS, wingspan; CL, comb length.
|
Step |
Entered |
F value |
p value |
Wilks’ Lambda |
|
Female |
||||
|
1 |
SL |
19.73 |
< 0.0001 |
0.36 |
|
2 |
BW |
33.47 |
< 0.0001 |
0.28 |
|
3 |
CC |
23.33 |
< 0.0001 |
0.20 |
|
4 |
CL |
4.14 |
0.0011 |
0.16 |
|
5 |
WS |
6.88 |
< 0.0001 |
0.19 |
|
6 |
SC |
4.40 |
0.0006 |
0.17 |
|
7 |
BL |
3.27 |
0.0065 |
0.18 |
|
Male |
||||
|
1 |
SL |
14.45 |
< 0.0001 |
0.38 |
|
2 |
CC |
5.28 |
0.0002 |
0.26 |
|
3 |
BW |
7.02 |
< 0.0001 |
0.19 |
|
4 |
WS |
5.09 |
0.0003 |
0.15 |
The CDA extracted five and four canonical discriminant functions (CAN) in females and males, respectively (Table 8). The first two functions explained approximately 98% of the variance in both sexes. CAN1 accounted for the majority of the variance (91.77% for females, 81.58% for males), while CAN2 explained 6.09% and 16.55% for females and males, respectively. CAN1 exhibited greater correlations (0.8857 and 0.8596 for females and males, respectively) with the groups. For both sexes, CAN1 had a lower Wilks’ Lambda of 0.16.
Figure 2 shows the relationships between the morphometric traits selected through SDA and the two most discriminating functions across the six districts. For female chickens, CAN1 effectively discriminated between chickens from Adama, Lume and Bora populations, while CAN2 discriminated among Lume, Dodola and Shashemene populations. For male chickens, CAN1 differentiated chickens from Adama, Lume and Bora, whereas CAN2 distinguished between Lume and Dodola populations. In females, CAN1 was strongly correlated with SL, BW, SC and BL, while CAN2 was predominantly associated with CC and CL, as evidenced by higher loadings (Table 9). Male chickens exhibited different patterns, with CAN1 being most strongly linked to SL and BW, while CAN2 was correlated with CC, WS and BW. In the biplot, districts from East Shoa were positioned on the right (high CAN1) for both sexes, with Lume exhibiting the highest CAN1 value, while districts from West Arsi clustered on the left (low CAN1).
Table 8. Summary of canonical discriminant functions for male and female chickens (n = 621; 134 males and 487 females). CAN, canonical function.
|
CAN |
Eigenvalue |
Percent (%) |
Cumulative % |
Canonical corr. |
Wilks’ Lambda |
F value |
p value |
|
Female |
|||||||
|
CAN1 |
3.6409 |
91.77 |
91.77 |
0.8857 |
0.1597 |
30.39 |
<0.0001 |
|
CAN2 |
0.2417 |
6.09 |
97.86 |
0.4412 |
0.7412 |
6.04 |
<0.0001 |
|
CAN3 |
0.0551 |
1.39 |
99.25 |
0.2285 |
0.9203 |
2.61 |
0.0007 |
|
CAN4 |
0.0198 |
0.50 |
99.75 |
0.1393 |
0.9710 |
1.72 |
0.0895 |
|
CAN5 |
0.0098 |
0.25 |
100.00 |
0.0988 |
0.9902 |
1.53 |
0.2060 |
|
Male |
|||||||
|
CAN1 |
2.8296 |
81.58 |
81.58 |
0.8596 |
0.1558 |
15.37 |
<0.0001 |
|
CAN2 |
0.5742 |
16.55 |
98.13 |
0.6039 |
0.5965 |
5.90 |
<0.0001 |
|
CAN3 |
0.0593 |
1.71 |
99.84 |
0.2366 |
0.9390 |
1.33 |
0.2428 |
|
CAN4 |
0.0054 |
0.16 |
100.00 |
0.0733 |
0.9946 |
0.34 |
0.7122 |
Figure 2. Biplot of canonical discriminant functions and structure loadings for female (upper) and male (lower) chickens. BW, body weight; BL, body length; CC, chest circumference; SL, shank length; SC, shank circumference; WS, wingspan; CL, comb length; AD, Adama; LM, Lume; BR, Bora; DD, Dodola; SH, Shashemene; SR, Siraro.
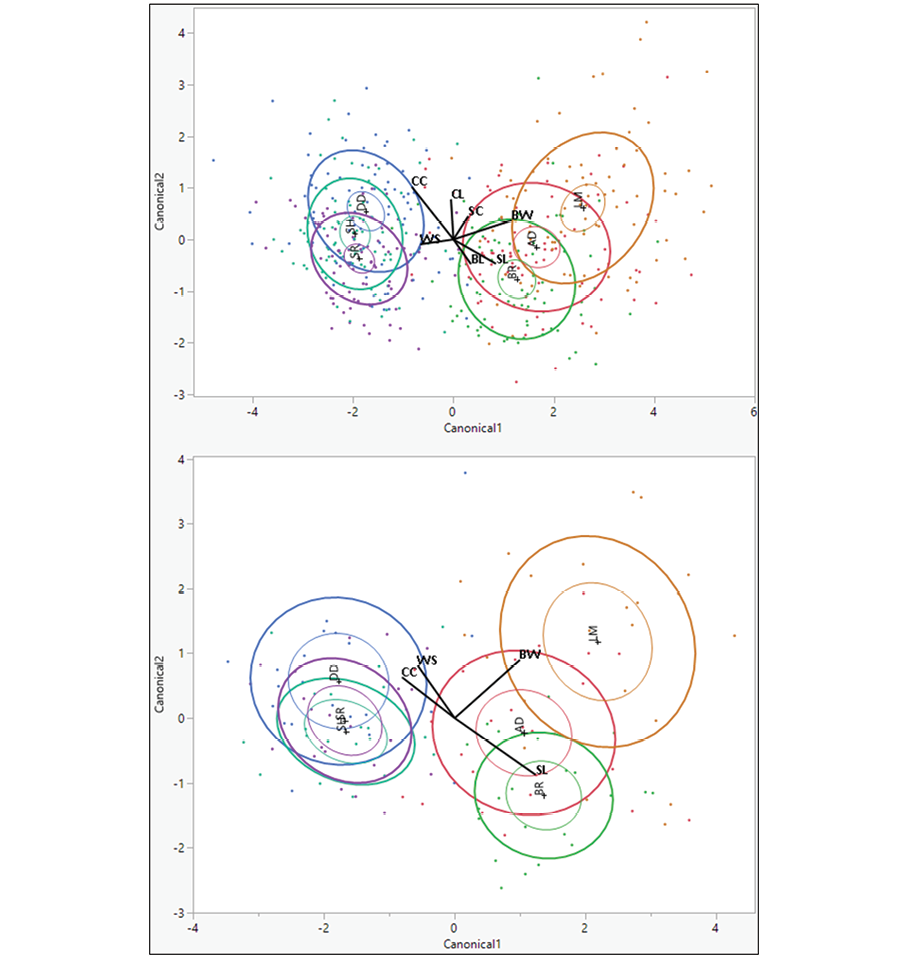
Table 9. Standardized canonical coefficients and canonical structures for female and male chickens from six districts (n = 621; 134 males and 487 females). CAN, canonical function.
|
Trait |
Standardized canonical coefficient |
Canonical structure |
||
|
CAN 1 |
CAN2 |
CAN 1 |
CAN2 |
|
|
Female |
||||
|
SL |
0.5636 |
–0.3135 |
0.9031 |
0.0122 |
|
BW |
0.7737 |
0.2445 |
0.8587 |
0.3827 |
|
CC |
–0.5539 |
0.6804 |
–0.1274 |
0.7539 |
|
CL |
–0.0323 |
0.5191 |
0.3837 |
0.6564 |
|
WS |
–0.4422 |
–0.0626 |
0.3564 |
0.2370 |
|
SC |
0.1965 |
0.3021 |
0.6971 |
0.2761 |
|
BL |
0.2330 |
–0.3188 |
0.6172 |
0.1335 |
|
Male |
||||
|
SL |
0.8242 |
–0.5826 |
0.9177 |
0.1345 |
|
CC |
–0.5370 |
0.4198 |
0.0742 |
0.7846 |
|
BW |
0.6652 |
0.5986 |
0.7964 |
0.6023 |
|
WS |
–0.3777 |
0.5410 |
0.1688 |
0.7123 |
Analysis of interclass distances (Table 10) based on the differences between class means on discriminant functions for CAN1, which accounted for the majority of the variance in both sexes, revealed clear geographical differentiation. Lume district chickens were significantly different from those in all three districts in the West Arsi zone (Shashemene, Siraro and Dodola, in that order). CAN1 also effectively discriminated between Adama and the three districts in West Arsi, as well as between Bora and those same districts. Notably, districts within the same geographical zone clustered more closely together.
Table 10. The distance between mean vectors of each class for male (above diagonal) and female (below diagonal) chickens (n = 621; 134 males and 487 females). AD, Adama; LM, Lume; BR, Bora; DD, Dodola; SH, Shashemene; SR, Siraro.
|
District |
AD |
LM |
BR |
DD |
SH |
SR |
|
|
Male |
|||||||
|
AD |
Female |
1.13 |
0.30 |
2.83 |
2.72 |
2.74 |
|
|
LM |
0.92 |
0.82 |
3.96 |
3.85 |
3.86 |
||
|
BR |
0.39 |
1.32 |
3.14 |
3.03 |
3.04 |
||
|
DD |
3.40 |
4.32 |
3.01 |
0.11 |
0.10 |
||
|
SH |
3.62 |
4.54 |
3.22 |
0.22 |
0.02 |
||
|
SR |
3.53 |
4.45 |
3.14 |
0.13 |
0.09 |
||
Discussion
Univariate analysis
In animal breeding, metrics such as body weight, length, and wither height serve as valuable proxies for economic performance due to their strong correlation with production output (FAO, 2012). The highly significant differences in morphometric traits among districts observed in this study align with previous findings in Ethiopia (Getachew et al, 2016; Assefa and Melesse, 2018; Tareke et al, 2018; Melesse et al, 2021; Mekonnen et al, 2023; Belay et al, 2024; Chebo et al, 2024) and other countries (Habimana et al, 2021; Liswaniso et al, 2024; Yaemkong et al, 2024). Variations in specific measurements across studies are likely attributable to differing management systems, as noted by Melesse et al (2021). These authors further emphasized that phenotypic variations may arise from genotypic and environmental factors and their interactions, which are crucial for long-term genetic adaptation to specific production environments.
Live BW is an economically important trait in animal production. In this study, chickens from the Lume district were the heaviest, followed by those from Adama. These values exceed those reported from other parts of Ethiopia (Hassen et al, 2007; Getu et al, 2014; Nigussie et al, 2015; Bekele et al, 2021) and other countries (Daikwo et al, 2011; Rotimi et al, 2016) but are lower than reports from elsewhere (Maharani et al, 2021; Moto and Rubanza, 2023). The BW of male (1854.55) and female (1435.37) chickens from Lume were higher than those found by Aklilu et al (2013) and Tamirat et al (2023). Such geographic variations are likely associated with differences in production environment, management practices, genetic background and the age at measurement.
Similarly, chickens from Lume and Adama were longer-bodied. The BL of male chickens from Adama was similar to that of males from other districts. Chickens from these two districts were longer than those reported from other parts of Ethiopia (Getu et al, 2014; Nigussie et al, 2015; Tamirat et al, 2023; Markos et al, 2024) and Nigeria (Daikwo et al, 2011), but shorter than chickens in other Ethiopian studies (Balcha et al, 2022) and other countries (Rotimi et al, 2016; Habimana et al, 2021; Moto and Rubanza, 2023). CC was highest in male chickens from Lume and in female chickens from Dodola. These values were higher than those in several previous reports (Nigussie et al, 2015; Balcha et al, 2022; Bayou et al, 2022; Mekonnen et al, 2023; Belay et al, 2024), though higher values have been documented in other Ethiopian studies (Aklilu et al, 2013; Tadese et al, 2024) and other country (Moto and Rubanza, 2023).
Higher values for shank traits (SL and SC) were recorded in chickens from Lume, followed by Adama and Bora. The SL values in these districts exceeded those from previous studies (Daikwo et al, 2011; Getu et al, 2014; Nigussie et al, 2015; Habimana et al, 2021; Maharani et al, 2021; Mekonnen et al, 2023), though longer shanks have also been reported (Aklilu et al, 2013; Markos et al, 2024). Long shanks are an adaptation for heat dissipation in tropical climates (Aklilu et al, 2013), which may explain their prevalence in the districts within Ethiopia's Central Rift Valley region. Udeh et al (2011) reported a relationship between SL and semen traits that varies by breed. They found SL to be a significant predictor of sperm motility in exotic cocks and the proportion of live sperm in local cocks. Long shanks in indigenous chickens, which are suitable for fast running, may also facilitate predator avoidance (Besbes, 2009; Ngeno et al, 2014).
Lume chickens exhibited greater WS, with values in other districts being closely related. Chickens from other parts of Ethiopia (Nigussie et al, 2015; Bekele et al, 2021; Bayou et al, 2022) and Rwanda (Habimana et al, 2021) exhibited greater WS, while lower values have been reported (Markos et al, 2024; Tadese et al, 2024). Udeh et al (2011) found a strong correlation between wing length and the proportion of live sperm in local cocks (r = 0.59), indicating its utility as a predictor for this trait.
Chickens from Lume had longer combs than those from other districts, exceeding lengths reported previously (Nigussie et al, 2015; Bekele et al, 2021; Belay et al, 2024; Markos et al, 2024; Tadese et al, 2024). The relationship between comb size and semen quality is complex and varies by breed. While inverse correlations have been observed in some studies (Udeh et al, 2011; Navara et al, 2012), Udeh et al (2011) also found CL to be a significant positive predictor of sperm concentration in exotic cocks. A relationship between comb size and BW has also been reported (Suyatno et al, 2023). Chickens from Lume had longer wattles than those in other districts, with values higher than those in previous reports (Nigussie et al, 2015; Bekele et al, 2021; Habimana et al, 2021; Maharani et al, 2021; Belay et al, 2024; Tadese et al, 2024). However, longer wattles have been found in other Ethiopian regions (Markos et al, 2024).
This study clearly demonstrates that chickens from Lume district consistently exhibited the highest values for key morphometric traits, including BW, identifying them as a high-priority population for selective breeding. Notably, Lume is a district where small-scale exotic chicken farming is common. Smallholder farmers often keep these breeds under the assumption that they are high-yielding and can improve indigenous stock through crossbreeding. Although farmers who owned exotic chickens were purposely excluded from this study, their uncontrolled distribution likely leads to introgression with indigenous populations. Therefore, the superior morphometric values in Lume may be associated with crossbreeding rather than representing the pure potential of the indigenous gene pool.
Significant sexual dimorphism was observed in all morphometric measurements, with males being larger than females, consistent with global studies (Liyanage et al, 2015; Mekonnen et al, 2023; Yaemkong et al, 2024; Begna et al, 2025). This dimorphism likely results from a combination of factors, including hormonally mediated superior muscle development in males (Semakula et al, 2011), evolutionary selective pressures such as intra-sexual competition or divergent parental care (Owens and Hartley, 1998), and different growth rates. This difference must be considered when designing breeding programmes for meat improvement (Habimana et al, 2021).
These morphometric traits, being polygenic, exhibit continuous variation (FAO, 2012). The highly significant (p < 0.001) differences for all traits confirm their strong discriminatory power. SL and BW demonstrated the highest F-values, revealing them as the most distinct traits and making them excellent for differentiating the groups. Conversely, WS and CC showed the weakest differentiation, making them poor for distinguishing among these populations. Furthermore, SL (R² = 0.64 in females, 0.62 in males) and BW (R² = 0.61 in females, 0.58 in males) had the greatest model explanatory power, meaning that district-level differences account for most of their variation. This aligns with Getachew et al (2016), who reported high explanatory power for BW. The observed CV across districts (7.40–33.72% in males; 6.28–45.52% in females) indicates substantial phenotypic heterogeneity, with WL and BW contributing the most, consistent with prior findings (Getachew et al, 2016).
Qualitative morphological traits such as plumage colour, comb type and skin pigmentation are markers of genetic diversity and adaptive features. They also hold economic value by influencing market preferences, product differentiation and breed valuation (Dana et al, 2010). Studying this variation provides evolutionary insights and reflects the socioeconomic context of subsistence farmers (Desta et al, 2013; Yussif et al, 2023). While these traits have less direct impact on production than quantitative traits, their adaptive significance makes them relevant for conservation (FAO, 2012).
This study revealed significant geographic variation in qualitative traits, confirmed by χ² tests. This indicates that the distribution of these traits is not the same across the districts. Higher χ² values for traits like earlobe colour, skin colour, feather colour and shank colour indicate their distribution is non-random across districts. This distinct geographic patterning, supported by MCA, suggests the existence of locally adapted populations, providing a phenotypic basis for targeted conservation and breeding strategies.
Avian colouration is influenced by complex interactions between pigments (melanins, carotenoids, psittacofulvins) and structural colours (Price-Waldman and Stoddard, 2021). Indigenous chickens show greater plumage diversity than standardized breeds (Tixier-Boichard et al, 2008). As also noted by various authors (Besbes, 2009; Bibi et al, 2021; Lawal and Hanotte, 2021; Chebo et al, 2023), indigenous chickens in this study are invariably coloured birds that display various plumage colours across the districts. This variation results from feather development mechanisms, genetics, and human selection (Cabarles et al, 2012).
The prevalence of red plumage in males and brown plumage in females is also common in different Ethiopian (Dana et al, 2010; Bekele et al, 2021; Begna et al, 2025) and Philippine (Cabarles et al, 2012) indigenous chickens. This pattern, inherited from the red junglefowl and reinforced by natural selection, provides camouflage (Besbes, 2009; Cabarles et al, 2012). However, a discrete choice experiment in rural Ethiopia found a farmer preference for white plumage over red (Terfa et al, 2019).
Regardless of sex differences, brown plumage is dominant in Nigeria (Daikwo et al, 2011), Ethiopia (Moreda et al, 2014), and Zambia (Liswaniso et al, 2024), while red is most common in other Ethiopian studies (Melesse and Negesse, 2011; Nigussie et al, 2015; Balcha et al, 2022). In the Borena zone of Ethiopia, the majority of both male and female chickens have white plumage, followed by red and brown plumage (Wario et al, 2021), whereas most chickens from North Wollo are white, followed by black and red (Achenef et al, 2023). Black plumage, rare or absent here, is dominant in Algeria (Moula et al, 2012), Nigeria (Egahi et al, 2010; Ige et al, 2012), Thailand (Buranawit et al, 2016) and Sri Lanka (Liyanage et al, 2015). Multicoloured plumage is most common in Kenya (Otecko et al, 2019), Tanzania (Moto and Rubanza, 2023) and Indonesia (Maharani et al, 2021), while a greyish mixture is predominant in Pakistan (Bibi et al, 2021).
Most chickens in this study had normal feather morphology and distribution, consistent with reports from Ethiopia (Melesse and Negesse, 2011; Nigussie et al, 2015; Assefa and Melesse, 2018; Mustefa et al, 2021; Wario et al, 2021; Balcha et al, 2022; Bayou et al, 2022; Achenef et al, 2023; Chebo et al, 2023; Muluneh et al, 2023; Tamirat et al, 2023; Tadese et al, 2024), Rwanda (Habimana et al, 2021), Ghana (Birteeb and Boakye, 2020) and Uganda (Yussif et al, 2023). While Dana et al (2010) reported nearly equal proportions of normal (58%) and silky (42%) feather types, most studies (Ige et al, 2012; Rotimi et al, 2016; Begna et al, 2025) confirm normal feathering is predominant.
The very low proportions or complete absence of silky, naked neck, and frizzle feather phenotypes in the current study suggest that farmers actively avoid selecting for these traits, potentially due to cultural stigma, as in Nigeria (Ige et al, 2012; Rotimi et al, 2016). Despite this, these genotypes are valuable for disease resistance (Ngeno et al, 2014), thermotolerance, improved feed-to-meat conversion and growth performance (Duguma, 2006; Dana et al, 2010; Melesse and Negesse, 2011). Naked-neck chickens are also known for their improved immune competence, better meat quality (e.g. lower cholesterol, higher dressing percentage), and easier processing due to less feather plucking (Desta, 2021). About 10 to 12% of naked-neck chickens have been reported in southwestern Ethiopia (Assefa and Melesse, 2018; Bayou et al, 2022).
In Ethiopia, farmers have historically culled single-combed chickens, reducing their frequency (Desta et al, 2013; Muluneh et al, 2023). In this study, single combs were most common in females and rose combs in males, consistent with Negassa et al (2014). This contrasts with Chebo et al (2023), who found single combs most common in males, with females having rose and single combs. Despite a reported fertility reduction in roosters homozygous for the rose comb allele (McLean and Froman, 1996), their high prevalence here may be driven by cultural and market preferences (Chebo et al, 2023). The high prevalence of single combs may also relate to heat dissipation (Moreda et al, 2014; Rotimi et al, 2016). Selection practices should consider the association of comb types with production and fertility (Chebo et al, 2023).
A single comb was the predominant type in both sexes of indigenous chickens in Ethiopia (Mustefa et al, 2021; Wario et al, 2021; Begna et al, 2025), Uganda (Yussif et al, 2023), Zambia (Liswaniso et al, 2024), the Philippines (Cabarles et al, 2012; Picardal et al, 2015), Sri Lanka (Liyanage et al, 2015), Bangladesh (Sarker et al, 2014) and Indonesia (Maharani et al, 2021). Regardless of sex differences, this comb type has been recorded in the majority of indigenous chickens in Nigeria (Egahi et al, 2010; Daikwo et al, 2011; Ige et al, 2012; Rotimi et al, 2016), Rwanda (Habimana et al, 2021), Ghana (Birteeb and Boakye, 2020), Kenya (Otecko et al, 2019), Tanzania (Moto and Rubanza, 2023), Ethiopia (Melesse and Negesse, 2011; Moreda et al, 2014; Assefa and Melesse, 2018; Alebachew et al, 2019; Bekele et al, 2021; Balcha et al, 2022; Bayou et al, 2022; Achenef et al, 2023; Tamirat et al, 2023), Thailand (Buranawit et al, 2016) and Pakistan (Bibi et al, 2021). However, pea combs occur in relatively high proportions in some Ethiopian studies, typically followed by single and rose combs (Hassen et al, 2007; Dana et al, 2010; Getachew et al, 2016). It is also the second most prevalent type, following rose combs (Nigussie et al, 2015).
A high proportion of yellow shanks was recorded, consistent with findings in Ethiopia (Hassen et al, 2007; Dana et al, 2010; Melesse and Negesse, 2011; Desta et al, 2013; Negassa et al, 2014; Nigussie et al, 2015; Assefa and Melesse, 2018; Bekele et al, 2021; Mustefa et al, 2021; Balcha et al, 2022; Bayou et al, 2022; Chebo et al, 2023; Muluneh et al, 2023; Tamirat et al, 2023), Uganda (Yussif et al, 2023), Nigeria (Daikwo et al, 2011), the Philippines (Cabarles et al, 2012), Sri Lanka (Liyanage et al, 2015), Rwanda (Habimana et al, 2021), Tanzania (Moto and Rubanza, 2023), Pakistan (Bibi et al, 2021) and Indonesia (Maharani et al, 2021). This prevalence is likely associated with farmer preferences for this phenotype (Desta et al, 2013). However, white shanks are more common in Zambia (Liswaniso et al, 2024), Ghana (Birteeb and Boakye, 2020), Nigeria (Rotimi et al, 2016) and Ethiopia (Wario et al, 2021). Both white and yellow shanks are predominantly found in Bangladesh (Sarker et al, 2014) and Ethiopia (Achenef et al, 2023), which likely suggests adaptations to heat dissipation in tropical climates (Moreda et al, 2014). Black shanks are predominant in Nigeria (Egahi et al, 2010) and Thailand (Buranawit et al, 2016). In domestic chickens, shank colour variation is caused by a combination of genes affecting carotenoid and melanin pigmentations, polygenic modifiers and environmental factors (Chebo et al, 2023).
Nearly all chickens from the six districts had featherless shanks, consistent with other Ethiopian (Hassen et al, 2007; Moreda et al, 2014; Bekele et al, 2021; Chebo et al, 2023; Muluneh et al, 2023) and Nigerian (Egahi et al, 2010) reports. However, equal proportions of chickens in Ethiopia have shanks with and without feathers (Begna et al, 2025). While feathered shanks are often considered an adaptation to colder climates (Ngeno et al, 2014), their absence in the cooler highland district of Dodola suggests other influencing factors.
Skin colour variation results from hybridization, inheritance, mutations in pigmentation genes (Cabarles et al, 2012), and dietary carotenoids (Dana et al, 2010). Consistent with the present findings, white skin is dominant in several Ethiopian regions (Nigussie et al, 2015; Alebachew et al, 2019; Balcha et al, 2022; Achenef et al, 2023; Muluneh et al, 2023; Begna et al, 2025) and other countries, including Zambia (Liswaniso et al, 2024), Ghana (Birteeb and Boakye, 2020), and the Philippines (Cabarles et al, 2012; Picardal et al, 2015), often followed by yellow. Yellow skin is predominant in some Ethiopian studies (Negassa et al, 2014; Assefa and Melesse, 2018; Tamirat et al, 2023) and is common in commercial stocks (Eriksson et al, 2008). White and yellow skin colours are also common in Pakistan (Bibi et al, 2021). Red was identified as the second most common skin colour after white in Ethiopia (Wario et al, 2021). As birds cannot synthesize carotenoids (Price-Waldman and Stoddard, 2021), differences in skin colour across indigenous chicken populations are likely driven by variations in local scavenging feed resources.
The current findings align with those of previous studies from Ethiopia (Moreda et al, 2014; Nigussie et al, 2015; Getachew et al, 2016; Alebachew et al, 2019; Chebo et al, 2023; Muluneh et al, 2023) and the Philippines (Picardal et al, 2015), where white-red was the most prevalent colour, followed by red and white. However, Dana et al (2010) reported a different pattern, with red being the most common colour, followed by white. A more distinct exception was reported by Bekele et al (2021), who identified yellow as the predominant colour, followed by red and white–red. Furthermore, a majority of Thai native chickens were reported to have black earlobes (Buranawit et al, 2016). Red earlobes have been identified as the dominant type in indigenous chickens from multiple countries, including Ethiopia (Melesse and Negesse, 2011; Desta et al, 2013; Negassa et al, 2014; Assefa and Melesse, 2018; Mustefa et al, 2021; Balcha et al, 2022; Bayou et al, 2022; Achenef et al, 2023; Tamirat et al, 2023; Tadese et al, 2024; Begna et al, 2025), Rwanda (Habimana et al, 2021), Zambia (Liswaniso et al, 2024), Indonesia (Maharani et al, 2021), and Pakistan (Bibi et al, 2021). Conversely, white earlobes were reported as the dominant phenotype in studies from Ethiopia (Duguma, 2006), Ghana (Birteeb and Boakye, 2020), and Nigeria (Egahi et al, 2010; Ige et al, 2012).
Consistent with observations in indigenous chickens from various Ethiopian regions (Dana et al, 2010; Moreda et al, 2014; Alebachew et al, 2019; Bekele et al, 2021; Mustefa et al, 2021; Wario et al, 2021; Balcha et al, 2022; Bayou et al, 2022; Tamirat et al, 2023; Begna et al, 2025), Nigeria (Egahi et al, 2010; Rotimi et al, 2016) and Ghana (Birteeb and Boakye, 2020), the plain head type was predominant among chickens in the present study. In contrast, snake-like heads are more common than other head shapes in chickens from certain Ethiopian regions (Negassa et al, 2014; Achenef et al, 2023). While spurs were absent in most chickens in this study, regardless of sex, Mustefa et al (2021) reported that spurs were present in most males but absent in most females, suggesting sex-dependent expression of this trait.
As noted by Desta et al (2013), the significant variation across locations reflects the combined influence of ecological factors (climate, geography) and traditional breeding history. This broad diversity signifies a substantial gene pool for genetic improvement through selective breeding and provides a foundation for designing effective conservation strategies for sustainable utilization of indigenous chicken genetic resources (Tixier-Boichard et al, 2008; Dessie et al, 2011).
Multivariate analysis
While univariate analysis offers simplicity by examining individual variables in isolation, multivariate analysis provides more comprehensive and biologically meaningful insights by evaluating multiple interrelated variables simultaneously. MCA is an exploratory technique specifically designed to analyze relationships among categorical variables (FAO, 2012). This approach generates a low-dimensional graphical map of variable categories, revealing clustering patterns and associations that pairwise tests (e.g. chi-square) cannot detect (Abdi and Valentin, 2007; Sourial et al, 2010; Fithian and Josse, 2017).
The resulting biplot (Figure 1) clearly demonstrates these relationships, showing strong associations between morphological variables and their geographic origins, a pattern also observed in other studies (Nigussie et al, 2015; Chebo et al, 2023). For instance, the clustering of yellow skin near the Shashemene and Siraro districts indicates a strong association, reflecting the high observed frequency of this trait in both locations (Table 4). The proximity of other qualitative traits to their respective sampling districts suggests meaningful biological–geographic relationships. In MCA, dimensions represent the largest deviations from variable independence (Sourial et al, 2010). Consequently, traits positioned farther from the origin, such as silky feathers (Dim 1) and Zigirima plumage colour (Dim 2), contribute most significantly to the observed patterns. A variable's distance from the origin corresponds to its power to differentiate populations (Chebo et al, 2023).
A recognized limitation of MCA is its tendency to underestimate the total explained variance (inertia), often requiring adjustments (Benzécri or Greenacre corrections) for accurate interpretation (Abdi and Valentin, 2007; Sourial et al, 2010; Camiz and Gomes, 2016; Khangar and Kamalja, 2017). Compared to Greenacre's conservative approach, the Benzécri method applies a more robust eigenvalue reweighting (Veflen et al, 2017). Given that the principal inertias of a Burt matrix produce numerous small eigenvalues, this study utilized Benzécri-adjusted inertias for more reliable variance estimation.
The first two dimensions in this study explained a greater proportion of the total variance than some previous reports. For instance, Chebo et al (2023) reported that the first two dimensions collectively explained 20.21%, 15.73%, 30.59% and 32.00% of the variance for different trait groups. Similarly, Nigussie et al (2015) and Belay et al (2024) reported 29.85% and 14.48%, respectively. In contrast, a study on Guinea fowl reported a higher value of 89.69% (Traoré et al, 2018), compared to the 70.23% obtained here.
Partial contributions to inertia quantify how much each category contributes to the variance explained by each dimension. Higher values indicate a more significant role in defining that axis. For example, in this study (Supplemental Table 1), the distinction between silky and non-silky feathers was the primary contributor to Dimension 1, while the presence or absence of yellow earlobes was more influential in Dimension 2. These contributions help identify the key traits driving population variation.
The MCA revealed significant geographic patterning, distinctly separating chickens from the East Shoa zone (Adama, Lume, Bora) and the West Arsi zone (Shashemene, Siraro), characterized by traits like grey skin and white plumage versus yellow skin, respectively. Despite its utility, MCA has been used in only a limited number of studies to characterize indigenous chickens in Ethiopia (Nigussie et al, 2015; Chebo et al, 2023; Muluneh et al, 2023; Belay et al, 2024), and none prior to this study in the present research area. The findings in this study can help to address this limitation. These findings can support the establishment of location-specific conservation programmes to maintain unique traits as distinct genetic resources.
Discriminant analysis is another multivariate technique that uses quantitative predictors (morphometric variables) to differentiate among categorical groups (districts). The QDA employed here classified chickens into their districts of origin with accuracies ranging from 41.80% to 88.31% for females and 47.60% to 91.30% for males. These correct classification rates are consistent with some previous studies (Picardal et al, 2015; Tareke et al, 2018; Mustefa et al, 2021; Muluneh et al, 2023; Chebo et al, 2024). However, it is lower than others that reported accuracies exceeding 80%, sometimes reaching 100% (Aklilu et al, 2013; Daikwo et al, 2015; Getachew et al, 2016; Yakubu and Ari, 2018; Melesse et al, 2021; Markos et al, 2024). Similarly, Kefelegn et al (2016) correctly classified 74% to 92% of chickens (both sexes) into their respective sampling locations, while Wario et al (2021) achieved 75% to 78% accuracy for females and 93% to 96% accuracy for males.
The higher correct classification rates for Bora and Lume suggest greater phenotypic homogeneity within chickens of these districts, but distinctness from other populations. In contrast, lower classification rates in the remaining districts indicate higher internal diversity. The overall classification success demonstrates homogeneity within populations relative to the variation between them (Melesse et al, 2021). Such distinctness among different geographic populations suggests location-specific conservation and breeding strategies. The misclassification observed in Adama, Dodola, Shashemene and Siraro may be attributed to overlapping morphometric traits or insufficiently distinct discriminant features, a phenomenon also noted in previous findings (Tareke et al, 2018; Muluneh et al, 2023).
SDA identified seven key discriminating traits for females and four for males. The number of traits selected varies across studies, suggesting that morphometric differentiation is context-dependent and influenced by genetic background, environment and management practices (Ajayi et al, 2012; Daikwo et al, 2015; Getachew et al, 2016; Kefelegn et al, 2016; Tareke et al, 2018; Mustefa et al, 2021; Wario et al, 2021; Bekele et al, 2022; Muluneh et al, 2023; Tadese et al, 2024). This highlights the importance of population-specific trait selection for characterization and conservation. Some of the discriminating variables identified here, such as SL and BW, align with previous findings (Ajayi et al, 2012; Aklilu et al, 2013; Bekele et al, 2022).
CDA constructs CAN functions that maximize separation among groups. While the number of significant functions varies across studies, typically either the first function or the first two functions explain most of the variance. In this study, the first two CAN explained 98% of the variance in both sexes, with CAN1 alone accounting for 91.77% of the variance in females and 81.58% of the variance in males. This high explanatory power is consistent with those of Chebo et al (2024), who reported that the first two functions captured 95.6% of the between-population variability. Similarly, other studies (Getachew et al, 2016; Kefelegn et al, 2016; Mustefa et al, 2021; Belay et al, 2024) reported that CAN1 alone explained 80 to 100% of the variance in both sexes.
However, some studies reported a lower variance explained by the first two functions. For instance, Tareke et al (2018) and Melesse et al (2021) reported that these functions accounted for 71.5% and 88% of the variance, respectively, regardless of sex. Muluneh et al (2023) reported 82% (females) and 68% (males), while Markos et al (2024) reported 63.58% (females) and 70.06% (males) for CAN1 alone. Similarly, Bekele et al (2022) noted that CAN1 explained 62% (females) and 89% (males) of the variance. The high canonical correlations observed in CAN1 (Table 8) for females (88.57%) and males (85.97%) indicate strong differentiation between chickens from different districts, which is consistent with previous findings (Melesse et al, 2021). However, other studies reported lower canonical correlations, where Mustefa et al (2021) and Muluneh et al (2023) reported values ranging from 50% to 80%, while Tareke et al (2018) and Bekele et al (2022) reported even lower values (30–50%).
Wilks' Lambda tests the significance of discriminant functions, with smaller values indicating greater discriminatory power (Toalombo Vargas et al, 2019). The lower Wilks’ Lambda value of 0.16 for CAN1 in both sexes (Table 8) demonstrates strong group separation, indicating that 84% of the variability in morphometric traits arises from between-district differences rather than within-district variation. This finding aligns with other studies reporting low Wilks' Lambda values (Getachew et al, 2016; Melesse et al, 2021; Muluneh et al, 2023) and suggests greater between-population differentiation than studies reporting higher values (Bekele et al, 2022; Chebo et al, 2024).
The biplot based on CAN1 and CAN2 revealed distinct morphological differentiation (Figure 2). For both sexes, CAN1 was strongly loaded with size-related traits (BW, SL, BL), consistent with Melesse et al (2021). A clear geographic pattern emerged: East Shoa districts (particularly Lume) clustered with high CAN1 scores, reflecting larger body size, while West Arsi districts (Siraro, Shashemene) grouped with low CAN1 scores, indicating smaller dimensions. Bora district appeared distinct, supported by its high classification accuracy (Table 6). The shorter distances between districts within the same zone likely reflect shared ancestry due to non-selection, extensive gene flow resulting from continuous inbreeding, and migration over generations under traditional production systems, as noted by other authors (Ajayi et al, 2012; Daikwo et al, 2015). In contrast, the greater separation between distant groups, likely attributable to high morphometric variation and systematic sampling, offers opportunities for the conservation and genetic improvement of indigenous chickens through selective breeding strategies (Tareke et al, 2018).
Conclusion
This study demonstrated significant morphometric and qualitative morphological diversity among indigenous chicken populations across the studied districts. Techniques such as MCA and discriminant analysis effectively captured phenotypic distinctions, revealing clear geographic patterning. The identification of key morphometric traits, particularly shank length and body weight, as powerful discriminators and predictors makes them reliable, easy-to-measure indicators for breed characterization. Farmers and breeders can use these traits as simple, effective selection criteria for improving body conformation and market weight. These findings also underscore the need to conserve these indigenous genetic resources and utilize district-specific traits in selective breeding programmes. Future research should incorporate molecular tools to evaluate genetic admixture and validate these phenotypic observations. This work establishes a foundational basis for the sustainable use and improvement of indigenous chicken diversity in Ethiopia, contributing to enhanced food security and rural livelihoods.
Supplemental Table 1. Partial contributions to inertias (eigenvalues) for the first two dimensions (Dim 1 and Dim 2)
Acknowledgments
The authors sincerely thank the farmers in the study areas for their willingness to share information and provide access to their chickens. We also extend our gratitude to the researchers who contributed to the data collection.
Author contributions
Fikrineh Negash contributed to conceptualization, methodology, data curation, formal analysis, and writing the original draft, as well as review and editing. Usman Abdulkadir contributed to methodology, project administration, resources and writing (review and editing).
Conflict of interest statement
The authors declare that they have no known competing financial interests or personal relationships that could have appeared to influence the work reported in this paper.
Ethics statement
The study was reviewed and approved by the Ethiopian Institute of Agricultural Research (EIAR) Research Review and Ethics Committee (Research code: AT/LS/Po-2015-1). Following a detailed explanation of the study's objectives and procedures, informed verbal consent was obtained from all smallholder farmers for access to their chickens.
Data availability
Data will be made available upon request.
References
Abdi, H., Valentin, D. (2007). Multiple correspondence analysis. Encyclopedia of Measurement and Statistics 2(4), 651–657. https://doi.org/10.4135/9781412952644.n299.
Achenef, Z. T., Ali, T. M., Mohammed, N. (2023). Phenotypic characterization of local chicken ecotypes in selected districts of North Wollo zone, Ethiopia. East African Journal of Veterinary and Animal Sciences 7(1), 47–56. https://doi.org/10.20372/eajvas.v7i1.473.
Ajayi, O. O., Adeleke, M. A., Sanni, M. T., Yakubu, A., Peters, S. O., Imumorin, I. G., Ozoje, M. O., Ikeobi, C. O. N., Adebambo, O. A. (2012). Application of principal component and discriminant analyses to morpho-structural indices of indigenous and exotic chickens raised under intensive management system. Tropical Animal Health and Production 44, 1247–1254. https://doi.org/10.1007/s11250-011-0065-1.
Aklilu, E., Kebede, K., Dessie, T., Banerjee, A. K. (2013). Phenotypic characterization of indigenous chicken population in Ethiopia. International Journal of Interdisciplinary and Multidisciplinary Studies 1(1), 24–32.
Alebachew, H., Abebe, A., Begna, F., Ahmed, K., Tarekegn, A., Abera, D., Mijana, D. (2019). Phenotypic characterization of local chicken ecotypes of Benishangul-Gumuz region, Western Ethiopia. Journal of Biology, Agriculture and Healthcare 9(7), 15–21. https://doi.org/10.7176/JBAH/9-7-03.
Assefa, H., Melesse, A. (2018). Morphological and morphometric characterization of indigenous chicken populations in Sheka Zone, South Western Ethiopia. Poultry, Fisheries and Wildlife Sciences 6(2), 200. https://doi.org/10.4172/2375-446X.1000200.
Balcha, Z., Baye, M., Masho, W., Admasu, Z. (2022). Morphological and morphometric features of indigenous chicken in Southwest Ethiopia. Online Journal of Animal and Feed Research 12(3), 132–146. https://dx.doi.org/10.51227/ojafr.2022.18.
Bayou, Y., Bayou, E., Genzebu, D., Assefa, H. (2022). Phenotypic characterization of indigenous chicken ecotypes in selected districts of Bench Maji Zone, South West Ethiopia. International Journal of Food Science and Agriculture 6(3), 293–300. http://dx.doi.org/10.26855/ijfsa.2022.09.009.
Begna, D., Bacha, T., Boki, S., Bekana, K. (2025). Characterization of indigenous chicken phenotypes in Liban Jawi District, Ethiopia: A qualitative and quantitative analysis. PloS ONE 20(1), e0307793. https://doi.org/10.1371/journal.pone.0307793.
Bekele, B., Melesse, A., Esatu, W., Dessie, T. (2022). Multivariate analysis of morphometric traits to differentiate the indigenous chicken reared under different agro-ecologies of Ethiopia. Veterinary Integrative Sciences 20(3): 775–791. https://doi.org/10.12982/VIS.2022.060.
Bekele, G., Goshu, G., Melesse, A., Esatu, W., Dessie, T. (2021). On-farm phenotypic and morphological characterization of indigenous chicken populations in Gambella Region, Ethiopia. International Journal of Poultry Science 20(1), 27–38. https://doi.org/10.3923/ijps.2021.27.38.
Belay, S., Belay, G., Resom, M. (2024). Morphometric and morphologic traits of indigenous chicken ecotypes of Tigray, northern Ethiopia. The Scientific World Journal 2024(1), 5537827. https://doi.org/10.1155/tswj/5537827.
Besbes, B. (2009). Genotype evaluation and breeding of poultry for performance under sub-optimal village conditions. World's Poultry Science Journal 65, 260–271. https://doi.org/10.1017/S0043933909000221.
Bibi, S., Noreen, S., Rehman, A., Mehmood, S., Shah, M. (2021). Morphological characteristics of native chicken of village Chhajjian, Haripur Pakistan. Poultry Science ١٠٠(٣), ١٠٠٨٤٣. https://doi.org/١٠.١٠١٦/j.psj.٢٠٢٠.١١.٠٢٢.
Birteeb, P. T., Boakye, T. (2020). Variant forms of qualitative traits of indigenous chickens reared under extensive system in Tolon District, Ghana. Animal Production Science 60(5), 705–712. https://doi.org/10.1071/AN19118.
Buranawit, K., Chailungka, C., Wongsunsri, C., Laenoi, W. (2016). Phenotypic characterization of Thai native black-bone chickens indigenous to northern Thailand. The Thai Journal of Veterinary Medicine ٤٦(٤), ٥٤٧–٥٥٤. https://doi.org/١٠.٥٦٨٠٨/٢٩٨٥-١١٣٠.٢٧٧٣.
Cabarles Jr, J. C., Lambio, A. L., Vega, S. A., Capitan, S. S., Mendioro, M. S. (2012). Distinct morphological features of traditional chickens (Gallus gallus domesticus L.) in Western Visayas, Philippines. Animal Genetic Resources 51, 73–87. https://doi.org/10.1017/S2078633612000410.
Camiz, S., Gomes, G. C. (2016). Alternative methods to multiple correspondence analysis in reconstructing the relevant information in a Burt's table. Pesquisa Operacional 36(1), 23–44. https://doi.org/10.1590/0101-7438.2016.036.01.0023.
Chebo, C., Melesse, A., Betsha, S. (2024). Quantifying phenotypic variability of indigenous chickens using morphometric traits by applying multivariate analysis: Input for sustainable rural chicken farming. Heliyon 10(21), e39850. https://doi.org/10.1016/j.heliyon.2024.e39850.
Chebo, C., Melesse, A., Betsha, S. (2023). Morphological descriptors of indigenous chickens: As a selection guide. Journal of Applied Animal Research ٥١(١), ٧٢٩–٧٤٢. https://doi.org/١٠.١٠٨٠/٠٩٧١٢١١٩.٢٠٢٣.٢٢٧٤٩٥٦.
Conte, G., Dimauro, C., Serra, A., Macciotta, N. P. P., Mele, M. (2018). A canonical discriminant analysis to study the association between milk fatty acids of ruminal origin and milk fat depression in dairy cows. Journal of Dairy Science 101(7), 6497–6510. https://doi.org/10.3168/jds.2017-13941.
Daikwo, I. S., Okpe, A. A., Ocheja, J. O. (2011). Phenotypic characterization of local chickens in Dekina. International Journal of Poultry Science 10(6), 444–447. https://doi.org/10.3923/ijps.2011.444.447.
Daikwo, S. I., Dike, U. A., Dim, N. I. (2015). Discriminant analysis of morphometric differences in the normal feathered and frizzle feathered chickens of north central Nigeria. Agro-Science: Journal of Tropical Agriculture, Food, Environment and Extension 14(3), 12–15. http://dx.doi.org/10.4314/as.v14i3.3.
Dana, N., Dessie, T., Van der Waaij, L. H., van Arendonk, J. A. M. (2010). Morphological features of indigenous chicken populations of Ethiopia. Animal Genetic Resources 46, 11–23. https://doi.org/10.1017/S2078633610000652.
Dessie, T., Taye, T., Dana, N., Ayalew, W., Hanotte, O. (2011). Current state of knowledge on phenotypic characteristics of indigenous chickens in the tropics. World's Poultry Science Journal 67(3), 507–516. https://doi.org/10.1017/S0043933911000559.
Desta, T. T. (2021). The genetic basis and robustness of naked neck mutation in chicken. Tropical Animal Health and Production ٥٣(١), ٩٥. https://doi.org/١٠.١٠٠٧/s١١٢٥٠-٠٢٠-٠٢٥٠٥-١.
Desta, T. T., Dessie, T., Bettridge, J., Lynch, S. E., Melese, K., Collins, M., Christley, R. M., Wigley, P., Kaiser, P., Terfa, Z., Mwacharo, J. M. (2013). Signature of artificial selection and ecological landscape on morphological structures of Ethiopian village chickens. Animal Genetic Resources 52, 17–29. https://doi.org/10.1017/S2078633613000064.
Duguma, R. (2006). Phenotypic characterization of some indigenous chicken ecotypes of Ethiopia. Livestock Research for Rural Development 18, 131.
Egahi, J. O., Dim, N. I., Momoh, O. M., Gwaza, D. S. (2010). Variations in qualitative traits in the Nigerian local chicken. International Journal of Poultry Science 9(10), 978–979. https://doi.org/10.3923/ijps.2010.978.979.
Eriksson, J., Larson, G., Gunnarsson, U., Bed'Hom, B., Tixier-Boichard, M., Strömstedt, L., Wright, D., Jungerius, A., Vereijken, A., Randi, E., Jensen, P. (2008). Identification of the yellow skin gene reveals a hybrid origin of the domestic chicken. PLoS Genetics ٤(٢), e١٠٠٠٠١٠. https://doi.org/١٠.١٣٧١/journal.pgen.١٠٠٠٠١٠.
FAO (2012). Phenotypic characterization of animal genetic resources. FAO Animal Production and Health Guidelines No. 11. Rome, Italy.
FAO (2024). FAOSTAT Statistical database. https://www.fao.org/faostat/en/#data/QCL.
Fithian, W., Josse, J. (2017). Multiple correspondence analysis and the multi-logit bilinear model. Journal of Multivariate Analysis 157, 87–102. http://dx.doi.org/10.1016/j.jmva.2017.02.009.
Getachew, F., Abegaz, S., Assefa, A., Misganaw, M., Emshaw, Y., Hailu, A., Tessema, M., Okore, C. (2016). Multivariate analyses of morphological traits in indigenous chicken populations of Metekel zone, Northwestern Ethiopia. Animal Genetic Resources 59, 15–25. https://doi.org/10.1017/S2078633616000084.
Getu, A., Melaku, M., Alemayehu, Y. (2014). Phenotypic characterization of indigenous chicken ecotypes in the eastern Amahara region, Ethiopia. Global Journal of Animal Breeding and Genetics 2(4), 79–85.
Habimana, R., Ngeno, K., Mahoro, J., Ntawubizi, M., Shumbusho, F., Manzi, M., Hirwa, C. A., Okeno, T. O. (2021). Morphobiometrical characteristics of indigenous chicken ecotype populations in Rwanda. Tropical Animal Health and Production 53, 24. https://doi.org/10.1007/s11250-020-02475-4.
Hassen, H., Neser, F. W. C., van Marle-Koster, E., De Kock, A. (2007). Phenotypic variation of native chicken populations in northwest Ethiopia. Tropical Animal Health and Production 39, 507–513. https://doi.org/10.1007/s11250-007-9032-2.
Ige, A. O., Salako, A. E., Yakubu, A., Adeyemi, S. A. (2012). Qualitative traits characterization of Yoruba and Fulani ecotype indigenous chickens in derived savannah zone of Nigeria. International Journal of Poultry Science 11(10), 616–620. https://doi.org/10.3923/ijps.2012.616.620.
JMP Statistical Discovery LLC. (2022). JMP® 17 Documentation Library. Cary, NC.
Kefelegn, K. K, Feyera, B., Negassi, A. (2016). Morphometric differentiation of indigenous chicken populations of Ethiopia using discriminant analysis. In Presentation at international research on food security, natural resource management and rural development, Vienna, Austria.
Khangar, N. V., Kamalja, K. K. (2017). Multiple correspondence analysis and its applications. Electronic Journal of Applied Statistical Analysis 10(2), 432–462. http://dx.doi.org/10.1285/i20705948v10n2p432.
Lawal, R. A., Hanotte, O. (2021). Domestic chicken diversity: Origin, distribution, and adaptation. Animal Genetics 52(4), 385–394. https://doi.org/10.1111/age.13091.
Liswaniso, S., Mwambilwa, K., Odubote, K., Tyasi, T. L., Mweni, M., Sun, X., Xu, R., Qin, N. (2024). Zambian indigenous chicken genetic resources: phenotypic characteristics and their production systems among small-scale farmers. Frontiers in Veterinary Science 11, 1429869. https://doi.org/10.3389/fvets.2024.1429869.
Liyanage, R. P., Dematawewa, C. M. B., Silva, G. L. L. P. (2015). Comparative study on morphological and morphometric features of village chicken in Sri Lanka. Tropical Agricultural Research 26(2), 261–273. https://doi.org/10.4038/tar.v26i2.8090.
Maharani, D., Mustofa, F., Sari, A. P. Z., Fathoni, A., Sasongko, H., Hariyono, D. N. H. (2021). Phenotypic characterization and principal component analyses of indigenous chicken breeds in Indonesia. Veterinary World ١٤(٦), ١٦٦٥–١٦٧٦. https://doi.org/١٠.١٤٢٠٢/vetworld.٢٠٢١.١٦٦٥-١٦٧٦.
Markos, S., Belay, B., Dessie, T. (2024). Morphometric differentiation of three chicken ecotypes of Ethiopia using multivariate analysis. PLoS ONE 19(2), e0295134. https://doi.org/10.1371/journal.pone.0295134.
McLean, D. J., Froman, D. P. (1996). Identification of a sperm cell attribute responsible for subfertility of roosters homozygous for the rose comb allele. Biology of reproduction ٥٤(١), ١٦٨–١٧٢. https://doi.org/١٠.١٠٩٥/biolreprod٥٤.١.١٦٨.
Mekonnen, K. T., Lee, D. H., Cho, Y. G., Son, A. Y., Seo, K. S. (2023). Biometric trait characterization and multivariate discriminant analysis of traditionally bred autochthonous chickens in Ethiopia. Agriculture 13(11), 2142. https://doi.org/10.3390/agriculture13112142.
Melesse, A., Negesse, T. (2011). Phenotypic and morphological characterization of indigenous chicken populations in southern region of Ethiopia. Animal Genetic Resources 49, 19–31. https://doi.org/10.1017/S2078633611000099.
Melesse, A., Tadele, A., Assefa, H., Taye, K., Kebede, T., Taye, M., Betsha, S. (2021). Assessing the morphological diversity of Ethiopian indigenous chickens using multivariate discriminant analysis of morphometric traits for sustainable utilization and conservation. Poultry Science Journal 9(1): 61–72. https://doi.org/10.22069/psj.2021.18469.1644.
Moreda, E., Singh, H., Sisaye, T., Johansson, A. M. (2014). Phenotypic characterization of indigenous chicken population in South West and South part of Ethiopia. British Journal of Poultry Sciences 3(1), 15–19. https://doi.org/10.5829/idosi.bjps.2014.3.1.8370.
Moto, E., Rubanza, C. D. (2023). Phenotypic characterization of indigenous chicken in the central zone of Tanzania. Open Agriculture 8(1), 20220218. https://doi.org/10.1515/opag-2022-0218.
Moula, N., Farnir, F., Salhi, A., Iguer-Ouada, M., Leroy, P., Antoine-Moussiaux, N. (2012). Backyard poultry in Kabylie (Algeria): from an indigenous chicken to a local poultry breed? Animal Genetic Resources 50, 87–96. https://doi.org/10.1017/S207863361200001X.
Muluneh, B., Taye, M., Dessie, T., Wondim, D. S., Kebede, D., Tenagne, A. (2023). Morpho-biometric characterization of indigenous chicken ecotypes in north-western Ethiopia. PLoS ONE 18(6), e0286299. https://doi.org/10.1371/journal.pone.0286299.
Mustefa, A., Kenfo, H., Belayhun, T., Hailu, A., Assefa, A. (2021). Morphometric and morphological characterization of chicken resources adapted to pastoral and agropastoral areas of southern Ethiopia. Genetic Resources 2(4), 72–84. https://doi.org/10.46265/genresj.NDFM2712.
Navara, K. J., Anderson, E. M., Edwards, M. L. (2012). Comb size and color relate to sperm quality: A test of the phenotype-linked fertility hypothesis. Behavioral Ecology ٢٣(٥), ١٠٣٦–١٠٤١. https://doi.org/١٠.١٠٩٣/beheco/ars٠٦٨.
Negassa, D., Melesse, A., Banerjee, S. (2014). Phenotypic characterization of indigenous chicken populations in Southeastern Oromia Regional State of Ethiopia. Animal Genetic Resources 55, 101–113. https://doi.org/10.1017/S2078633614000319.
Ngeno, K., Vander Waaij, E. H., Kahi, A. K. (2014). Indigenous chicken genetic resources in Kenya: Their unique attributes and conservation options for improved use. World's Poultry Science Journal 70, 173–184. https://doi.org/10.1017/S0043933914000154.
Nigussie, H., Kebede, K., Ameha, N. 2015. Phenotypic and morphological characterization of indigenous chicken populations in southern zone of Tigray, Ethiopia. Journal of Biology, Agriculture and Healthcare 5(21), 132–141.
Otecko, N. O., Ogali, I., Mauki, D. H., Ogada, S., Moraa, G. K., Lichoti, J., Agwanda, B., Peng, M. S., Ommeh, S. C., Zhang, Y. P. (2019). Phenotypic and morphometric differentiation of indigenous chickens from Kenya and other tropical countries augments perspectives for genetic resource improvement and conservation. Poultry Science 98(7), 2747–2755. http://dx.doi.org/10.3382/ps/pez097.
Owens, I. P., Hartley, I. R. (1998). Sexual dimorphism in birds: Why are there so many different forms of dimorphism? Proceedings of the Royal Society B: Biological Sciences ٢٦٥(١٣٩٤), ٣٩٧–٤٠٧. https://doi.org/١٠.١٠٩٨/rspb.١٩٩٨.٠٣٠٨.
Picardal, J. P., Afable, F. A., Lagman, M. C. A., Campoto, E. A., Palada, E. P., Valdez Jr, M. B. (2015). Phenotypic characterization of native chickens (Gallus gallus domesticus) in Eastern Samar, Philippines. IAMURE International Journal of Ecology and Conservation 15, 242–265. http://dx.doi.org/10.7718/ijec.v15i1.1005.
Price-Waldman, R., Stoddard, M. C. (2021). Avian coloration genetics: Recent advances and emerging questions. Journal of Heredity ١١٢(٥), ٣٩٥–٤١٦. https://doi.org/١٠.١٠٩٣/jhered/esab٠١٥.
Rotimi, E. A., Egahi, J. O., Adeoye, A. A. (2016). Phenotypic characterization of indigenous chicken population in Gwer-West, Benue State, Nigeria. World Scientific News 3(53), 343–353.
Sarker, N. R., Hoque, A., Faruque, S., Islam, N., Bhuiyan, F. H. (2014). An ex situ study on body characteristics and effect of plumage color on body weight of indigenous chicken (Gallus domesticus) in Bangladesh. Acta Scientiarum. Animal Sciences 36, 79–84. https://doi.org/10.4025/actascianimsci.v36i1.20118.
SAS Institute Inc. (2022). JMP® Pro Version 17.0.0. Cary, NC.
Semakula, J., Lusembo, P., Kugonza, D. R., Mutetikka, D., Ssennyonjo, J., Mwesigwa, M. (2011). Estimation of live body weight using zoometrical measurements for improved marketing of indigenous chicken in the Lake Victoria basin of Uganda. Livestock Research for Rural Development ٢٣(٨), ١٧٠.
Sourial, N., Wolfson, C., Zhu, B., Quail, J., Fletcher, J., Karunananthan, S., Bandeen-Roche, K., Béland, F., Bergman, H. (2010). Correspondence analysis is a useful tool to uncover the relationships among categorical variables. Journal of Clinical Epidemiology 63(6), 638–646. https://doi.org/10.1016/j.jclinepi.2009.08.008.
Suyatno, S., Sujono, S., Winaya, A., Zalizar, L., Pangestu, M. (2023). Characterization of qualitative and quantitative traits of four types of Indonesian native chickens as ancestor of new strains of local super laying hens. Jordan Journal of Biological Sciences ١٦(٢), ٧١–١٧٩. https://doi.org/١٠.٥٤٣١٩/jjbs/١٦٠٢٠١.
Tadese, D., Bekele, B., Hailemesikel, D., Wolde, B., Esatu, W., Dessie, T. (2024). On-farm phenotypic characterization of indigenous chicken populations and their productive and reproductive performances in central Ethiopia. Journal of Livestock Science 15(15), 181–189. https://doi.org/10.33259/JLivestSci.2024.181-189.
Tamirat, D., Getachew, T., Masho, W., Admasu, Z. (2023). Morphological and morphometric features of indigenous chicken in North Shewa zone, Oromia regional state, Ethiopia. The Scientific Temper 14(3), 609–617. https://doi.org/10.58414/SCIENTIFICTEMPER.2023.14.30.07.
Tareke, M., Assefa, B., Abate, T., Tekletsadik, E. (2018). Evaluation of morphometric differences among indigenous chicken populations in Bale zone, Oromia Regional State, Ethiopia. Poultry Science Journal 6(2), 181–190. https://doi.org/10.22069/psj.2018.14974.1329.
Terfa, Z. G., Garikipati, S., Kassie, G. T., Dessie, T., Christley, R. M. (2019). Understanding farmers’ preference for traits of chickens in rural Ethiopia. Agricultural Economics 50(4), 451–463. https://doi.org/10.1111/agec.12502.
Tixier-Boichard, M., Ayalew, W., Jianlin, H. (2008). Inventory, characterization and monitoring. Animal Genetic Resources Information 42, 29–44. https://doi.org/10.1017/S1014233900002534.
Toalombo Vargas, P. A., Navas Gonzalez, F. J., Landi, V., Leon Jurado, J. M., Delgado Bermejo, J. V. (2019). Sexual dimorphism and breed characterization of Creole hens through biometric canonical discriminant analysis across Ecuadorian agroecological areas. Animals 10(1), 32. https://doi.org/10.3390/ani10010032.
Traoré, G. F., Tapsoba, A. S. R., Bayala, B., Soudré, A., Traore, A., Dayo, G. K., Ávarez, I., Fernández, I., Sanou, M., Tamboura, H. H., Goyache, F. (2018). Multivariate analyses of morphological traits characterize the Guinea fowl (Numida meleagris) of Burkina Faso as a homogeneous population. European Poultry Science ٨٢, ١–١٣. https://doi.org/١٠.١٣٩٩/eps.٢٠١٨.٢٥١.
Udeh, I., Ugwu, S. O. C., Ogagifo, N. L. (2011). Predicting semen traits of local and exotic cocks using linear body measurements. Asian Journal of Animal Sciences 5(4), 268–276. https://doi.org/10.3923/ajas.2011.268.276.
Veflen, N., Storstad, O., Samuelsen, B., Langsrud, S., Hagtvedt, T., Ueland, Ø., Gregersen, F., Scholderer, J. (2017). Food scares: Reflections and reactions. International Journal on Food System Dynamics 8(2), 155–164. http://dx.doi.org/10.18461/ijfsd.v8i2.826.
Wario, D. D., Tadesse, Y., Yadav, S. B. S. (2021). On-Farm phenotypic characterization of indigenous chicken, in Dire and Yabello districts, Borena zone, Oromia Regional State, Ethiopia. Journal of Genetic Resources 7(1), 36–48. https://doi.org/10.22080/jgr.2020.19954.1211.
Yaemkong, S., Phromnoi, S., Mingchai, C., Jongjitvimol, T. (2024). Characterization of phenotypic variation in indigenous chicken populations in lower Northern Thailand to improve chicken breeding. International Journal of Zoology 2024(1), 9985076. https://doi.org/10.1155/2024/9985076.
Yakubu, A., Ari, M. M. (2018). Principal component and discriminant analyses of body weight and conformation traits of Sasso, Kuroiler and indigenous Fulani chickens in Nigeria. The Journal of Animal and Plant Sciences 28(1), 46–55.
Yussif, I., Kugonza, D. R., Okot, M. W., Amuge, P. O., Costa, R., Dos Anjos, F. (2023). Uganda chicken genetic resources: I. phenotypic and production characteristics. Frontiers in Genetics 13, 1033031. https://doi.org/10.3389/fgene.2022.1033031.