Characterization of Iranian rice genetic resources for key grain quality traits
Mostafa Modarresi
Rice Research Institute of Iran, Agricultural Research, Education and Extension Organization (AREEO), Rasht, Islamic Republic of Iran
* Corresponding author: Mostafa Modarresi (mstmodarresi@gmail.com)
Abstract: Grain quality traits are crucial for rice (Oryza sativa L.) breeding, as they significantly influence consumer preferences and market value. This study evaluated 48 diverse rice genotypes, including a strong representation of Iranian landraces that constitute unique and valuable genetic resources at risk of erosion, as well as some improved varieties and imported lines, for seven grain quality traits: amylose content, gelatinization temperature, grain length, grain width, cooked grain length, grain shape, and grain elongation during the 2023–2024 growing seasons. The studied rice genotypes showed substantial variation in quality-related traits. All traits demonstrated significant genotypic variation, with high broad-sense heritability (H² ≥ 0.968) and notable genetic advance (up to 49.37% for gelatinization temperature), indicating strong potential for genetic improvement. Correlation analyses showed strong positive relationships among grain length, grain shape, and cooked grain length, but negative associations with grain width and grain elongation, indicating breeding trade-offs. Path analysis highlighted grain length as a primary driver of cooked grain length and identified gelatinization temperature and grain shape as key influences on amylose content. Hierarchical clustering and principal component analysis identified four genotype clusters, with standout performers like Gohar (excelling in grain length) and Gharib Siah Reyhani (high elongation) suitable for breeding programmes. These results not only provide a robust framework for multi-trait selection and the development of high-quality varieties tailored to Iranian and global markets, but also underscore the conservation value and uniqueness of Iranian landraces as representative genetic resources for future rice improvement and food security.
Keywords: Oryza sativa, grain quality, genotypic variation, heritability, path analysis, breeding
Introduction
Rice (Oryza sativa L.) is a staple food for over half of the global population, providing a primary source of calories and nutrition, particularly in Asia, Africa and Latin America (Birla et al, 2017). The quality of rice grains, encompassing physical, chemical and cooking properties, significantly influences consumer preferences, market value and food security. Key grain quality traits, such as amylose content, gelatinization temperature, grain length, grain width, cooked grain length, grain shape and grain elongation, determine the sensory and culinary attributes of rice, including texture, appearance and cooking behaviour (Hori and Sun, 2022; Modarresi, 2023). For instance, amylose content affects the stickiness and firmness of cooked rice. In contrast, cooked grain length and grain shape contribute to the visual appeal and palatability preferred in premium rice varieties. These traits are under complex genetic control, influenced by both genotypic and environmental factors, making their improvement a priority in rice breeding programmes (Sultana et al, 2022).
Breeding for enhanced grain quality requires a thorough understanding of genotypic variation, trait interrelationships, and genetic parameters such as heritability and genetic advance. High heritability and substantial genetic variation indicate traits amenable to selection, while correlation and path analyses reveal how traits interact to influence overall quality (Kumar et al, 2010; Thuy et al, 2023). For example, grain length and cooked grain length are often positively correlated, suggesting that selecting for longer grains may enhance cooked grain appearance (Malik et al, 2022). However, trade-offs, such as the negative association between grain width and grain shape, necessitate careful consideration in breeding strategies. Multivariate techniques, including principal component analysis (PCA) and hierarchical clustering, further aid in identifying genotypes with desirable trait combinations and understanding the underlying structure of trait variation (Talekar et al, 2022). Despite advances in rice breeding, comprehensive studies integrating these approaches to evaluate diverse germplasm, particularly in regions like Iran with rich rice genetic diversity, remain limited.
Iran is a significant rice-producing country, with a wide array of local landraces and improved cultivars adapted to diverse agroecological conditions (Modarresi, 2023; Modarresi et al, 2024). These local landraces, shaped by centuries of farmer selection, represent a uniquely rich component of Iran’s rice genetic resources, harbouring trait combinations – particularly for grain quality – that are often absent or diluted in modern improved varieties and imported lines. Their representativeness of traditional Iranian rice diversity, coupled with their adaptation to local environments, confers high conservation value, especially as many are threatened by genetic erosion due to the widespread adoption of high-yielding modern cultivars. These genotypes offer a valuable resource for improving grain quality traits, yet their genetic potential and trait associations are underexplored.
Previous studies in Iran, such as Abarshahr et al (2011), Yadi et al (2021), Safiedin Ardebili et al (2024), have focused primarily on yield-related traits, morphometric diversity of individual cultivars, or limited quality parameters examined in isolation, often without integrating genetic parameters, trait interrelationships and multivariate analyses. To our knowledge, no prior Iranian study has provided a comprehensive, multi-trait evaluation that simultaneously characterizes genotypic variation, estimates broad-sense heritability and genetic advance, examines trait associations through correlation and path coefficient analyses, and applies principal component analysis and hierarchical clustering to identify superior genotype combinations across the seven key physical and chemical grain quality traits most relevant to cooking, eating and market value.
This study aimed to evaluate 48 rice genotypes for seven grain quality traits that align closely with preferred cooking and eating characteristics to inform breeding for improved grain quality. Specific objectives were to: (1) assess phenotypic variation and genotypic differences in amylose content, gelatinization temperature, grain length, grain width, cooked grain length, grain shape and grain elongation; (2) estimate genetic parameters, including heritability and genetic advance, to identify traits with high breeding potential; (3) examine trait interrelationships using correlation, PCA and path analysis to understand their contributions to grain quality; and (4) identify superior genotypes with desirable trait combinations through clustering and multivariate analyses. By integrating these approaches on a highly representative Iranian germplasm panel, this study provides a novel framework for multi-trait selection and conservation-informed breeding.
Materials and methods
Plant material and experimental design
The rice germplasm was obtained from the Rice Research Institute of Iran (RRII), located in Rasht, Gilan Province. It consisted of 48 genotypes, including a diverse set of local landraces, RRII-improved/registered cultivars, RRII-improved/breeding lines, and imported genotypes (Table 1), and was evaluated for grain quality traits. This composition provides a highly representative sample of Iranian rice genetic diversity while incorporating unique landrace material of considerable conservation value. The genotypes included Deylamani, Hashemi, Shiroudi, Binam, Gohar and 43 others, selected to represent a broad range of genetic diversity in Iranian and international rice germplasm. All 48 genotypes are maintained as pure lines at RRII. Seeds for the experiments were obtained from uniform multiplication plots grown under standard conditions at RRII in the season preceding the 2023 trial to ensure genetic purity, viability and consistency across genotypes. The experiments were conducted in a randomized complete block design (RCBD) with four replications at RRII, Rasht, Iran, during the 2023 and 2024 growing seasons. Each genotype was planted in a 2m² plot, with standard agronomic practices applied uniformly across all plots to minimize environmental variation. The four replications ensured robust estimation of genotypic effects while accounting for field heterogeneity.
Table 1. Origin and year of release of genotypes used in this study. *Cy, Dcl, and Line7 are historical codes for imported rice genotypes from international collections, developed more than 40 years ago; detailed full names are unavailable due to limited archival records.
|
Genotype |
Origin |
Year of release |
Genotype |
Origin |
Year of release |
|
Deylamani |
Iranian landrace, Mazandaran province |
- |
Fuji Minori |
Imported/Japan/Registered cultivar |
1971 |
|
Hashemi |
Iranian landrace, Guilan province |
- |
Sepidroud |
RRII-improved/Registered cultivar |
1987 |
|
Shiroudi |
RRII-improved/Registered cultivar |
2008 |
Rash |
IRRI-improved/Registered cultivar |
2017 |
|
Binam |
Iranian landrace, Guilan province |
- |
Koohsar |
IRRI-improved/Registered cultivar |
2011 |
|
Gohar |
RRII-improved/Registered cultivar |
2016 |
Gharib Siah Reyhani |
Iranian landrace/Guilan province |
- |
|
Khazar |
RRII-improved/Registered cultivar |
1983 |
Neda |
RRII-improved/Registered cultivar |
1998 |
|
Hassani |
Iranian landrace, Guilan province |
- |
Anam |
RRII-improved/Registered cultivar |
2018 |
|
Saleh |
RRII-improved/Registered cultivar |
2002 |
Zenith |
Imported/United States |
- |
|
Abji Boji |
Iranian landrace, Guilan province |
- |
Dorfak |
RRII-improved/Registered cultivar |
2001 |
|
Anbarboo Ilam |
Iranian landrace, Ilam province |
- |
Keshvari |
IRRI-improved/Registered cultivar |
2011 |
|
Champa Boodar |
Iranian landrace, Guilan province |
- |
Fajr |
IRRI-improved/Registered cultivar |
2001 |
|
Gharib |
Iranian landrace, Guilan province |
- |
Bejar |
RRII-improved/Registered cultivar |
1993 |
|
Salari |
Iranian landrace, Mazandaran province |
- |
Line7* |
Imported/IRRI |
- |
|
Ali Kazemi |
Iranian landrace, Guilan province |
- |
Nemat |
RRII-improved/Registered cultivar |
1995 |
|
Mutant Gohar |
RRII-improved/Breeding line |
- |
Ahlami Tarom |
Iranian landrace, Mazandaran Province |
- |
|
Tisa |
RRII-improved/Registered cultivar |
2018 |
Dom Siah |
Iranian landrace, Guilan province |
- |
|
Hassan Saraei |
Iranian landrace, Guilan province |
- |
Shahpasand |
Iranian landrace, Mazandaran Province |
- |
|
TH1 |
RRII-improved/Breeding line |
- |
Ghodsi |
RRII-improved/Breeding line |
- |
|
Tetep |
Imported/Vietnam |
- |
Sange Tarom |
Iranian landrace, Mazandaran Province |
- |
|
Tarom Mahalli |
Iranian landrace, Mazandaran Province |
- |
Dom Zard |
Iranian landrace, Guilan province |
- |
|
Anbarboo |
Iranian landrace, Khuzestan province |
- |
Dcl* |
Imported/Egypt |
- |
|
Kadous |
IRRI-improved/Registered cultivar |
2003 |
Cy* |
Imported/Egypt |
- |
|
Mohammadi Chaparsar |
Iranian landrace, Mazandaran Province |
- |
IR64 |
Imported/IRRI |
- |
|
Dom Sefid |
Iranian landrace, Guilan province |
- |
IR36 |
Imported/IRRI |
- |
Trait measurements
Seven grain quality traits were measured on harvested grain samples from each plot (4 replications per year × 2 years), yielding 384 plot-level observations in total (48 genotypes × 4 replications × 2 years). The traits included amylose content (%), determined using the colourimetric method with iodine-potassium iodide solution, following the protocol of Juliano (1971). Absorbance was measured at 620nm using a spectrophotometer, and amylose content was calculated based on a standard curve. Gelatinization temperature was assessed using the alkali spreading test (Little, 1958), where grains were soaked in 1.7% potassium hydroxide solution for 23 hours at 30°C. Spreading was scored on a 1–7 scale, with higher scores indicating lower gelatinization temperature. Although this alkali spreading value (ASV) is technically an ordinal score, it is routinely treated as a quasi-continuous variable in rice grain quality and breeding studies for parametric statistical analyses. This approach is widely accepted due to the scale's progressive correspondence with actual gelatinization temperature and its consistent use in ANOVA, correlation, heritability, and multivariate analyses in the literature (e.g. Little, 1958; Juliano, 1971; Pang et al, 2016; Xu et al, 2024). Grain length (mm) was measured as the average length of ten randomly selected whole milled grains per plot. Grain width (mm) was measured as the average width of the same ten grains, perpendicular to the length. Cooked grain length (mm) was determined by measuring ten cooked grains selected from a sample of 20–100 whole, milled rice grains, presoaked in distilled water for 30 minutes at ambient temperature, cooked in a vigorously boiling water bath at 100°C for ten minutes, cooled in a water bath at ambient temperature, and blotted with blotting paper (Juliano and Perez, 1984). The 10-grain average provided the plot-level value. Grain shape was calculated as the ratio of grain length to grain width, reflecting grain slenderness. The grain shapes were categorized into three types based on their length-to-width ratio, displayed from top to bottom as follows: slender (ratio > 3), medium (ratio 2–3), and bold (ratio < 2) (Zhao et al, 2022a). Grain elongation calculated as the ratio of cooked grain length to uncooked grain length, indicating grain expansion during cooking. All measurable traits were based on plot-level averages (of ten grains where specified) or bulk samples. These plot-level values were used directly in descriptive statistics and ANOVA. Genotype means (averaged across the eight plot-level values per genotype) were used for correlation, hierarchical clustering, principal component analysis and path analysis. All measurements were conducted in a rice quality laboratory environment to ensure consistency.
Statistical analyses
Data were analyzed using R version 4.3.1 (R-Core-Team, 2023) for descriptive statistics, analysis of variance, correlation analysis, hierarchical clustering and principal component analysis, using packages including dplyr, agricolae, corrplot, Hmisc, ComplexHeatmap, dendextend, tidyverse, ggfortify, and factoextra. Descriptive statistics – mean, standard error, minimum, maximum, and range – were calculated for each trait across all observations using the dplyr package to summarize trait variability.
Analysis of Variance (ANOVA): To assess the validity of combining data across years, a preliminary full ANOVA model including the genotype × year (G × Y) interaction term was fitted for each trait using the aov function. The G × Y interaction was non-significant for all seven traits (F-values ranging from 0.91 (grain elongation) to 1.28 (amylose content); df = 47, p > 0.10). Homogeneity of error variances between years was confirmed using Levene’s test (leveneTest function in the car package; p > 0.05 for all traits). Year was treated as a fixed effect. These results justified pooling data from the 2023 and 2024 seasons for the final combined analysis of variance (ANOVA), performed using the aov function with genotype (48 levels) as the main factor, year (2 levels) as a fixed effect, and replication (4 levels) as a blocking factor. Variance components for estimation of genetic parameters (including broad-sense heritability) were derived from this pooled ANOVA.
A combined ANOVA was performed across two growing seasons using the following linear model:
where is the observed value of a trait, is the overall mean, is the effect of the genotype, is the effect of the year, is the G × Y interaction, is the effect of the replication nested within year, and is the residual error.
Mean performance: Mean trait values were computed for each genotype by averaging across the four replications using dplyr, providing genotypic performance profiles. Genotypic means were compared using Tukey’s Honest Significant Difference (HSD) test at a 5% significance level.
Genetic Parameters: Variance components were estimated from ANOVA results. Genetic variance (σ²g) was calculated as (MSg - MSe) / r, where MSg is the mean square for genotype, MSe is the mean square error, and r is the number of replications (4). Environmental variance (σ²e) was equated to MSe, and phenotypic variance (σ²p) was σ²g + σ²e. Broad-sense heritability (H²) was computed as σ²g/σ²p. Genotypic and phenotypic coefficients of variation (GCV, PCV) were calculated as (√σ²g/mean) × 100 and (√σ²p/mean) × 100, respectively. Genetic advance (GA) was estimated as GA = k × √σ²g × H², where k = 2.06 (5% selection intensity), and expressed as a percentage of the mean.
Correlation analysis: Pearson correlation coefficients among the seven traits were calculated using the rcorr function in the Hmisc package, with significance tested at p < 0.05. A correlation heatmap was generated using corrplot to visualize relationships.
Hierarchical clustering and heatmap: Mean trait values per genotype were standardized (z-scores) and subjected to hierarchical clustering using Euclidean distance and Ward’s method (ward.D2) in the ComplexHeatmap package. A heatmap was produced to visualize trait patterns across genotypes.
Principal component analysis (PCA): PCA was performed on standardized mean trait values using the prcomp function to identify major axes of variation. Biplots of genotypes and traits on the first two principal components (PC1, PC2) were generated using ggfortify and factoextra to visualize genotypic and trait contributions.
Path analysis (structural equation modelling) was conducted separately using Python, employing the semopy package, which is specifically designed for structural equation modelling and provides standardized path coefficients and widely accepted goodness-of-fit indices. The use of Python for path analysis was independent of the R-based analyses and allowed for flexible specification and evaluation of alternative causal models. Path analysis was conducted to disentangle direct and indirect relationships among grain quality traits based on an explicitly defined biological and physicochemical framework. Two separate path models were specified, with cooked grain length and amylose content selected as focal (dependent) traits in independent analyses. These traits were chosen because they represent integrative endpoints of rice cooking and eating quality rather than primary morphological descriptors. In the first model, cooked grain length was treated as a key post-cooking physical outcome influenced by pre-cooking grain morphology (grain length and grain width) and starch-related properties. Grain length and grain width were specified as upstream traits because they are determined during grain development and physically constrain the extent of kernel expansion during cooking. Grain shape (length-to-width ratio) was modelled as an intermediate composite trait influenced by grain length and width, consistent with its mathematical definition and biological interpretation as a descriptor of kernel slenderness. Grain elongation was modelled as a downstream response variable influenced by cooked grain length and grain shape. This directionality reflects the biological and operational definition of grain elongation as the relative increase in kernel length after cooking (i.e. cooked grain length relative to uncooked grain length). Thus, cooked grain length is a necessary antecedent of elongation, and elongation represents a secondary, derived cooking response rather than an independent primary trait. In the second model, amylose content was treated as the focal chemical trait, reflecting its central role in determining rice texture and cooking behaviour. Gelatinization temperature was specified as an upstream physicochemical trait influencing amylose behaviour during cooking, while grain shape was included as a morphological correlate reflecting known associations between kernel slenderness and starch composition. Covariances among biologically related traits (e.g. amylose content and gelatinization temperature; grain length and grain width) were specified where appropriate. All path models were hypothesis-driven and grounded in established rice grain development, starch chemistry and cooking-quality literature. Standardized path coefficients were estimated using structural equation modelling, and model fit was evaluated using comparative fit index (CFI ≥ 0.90) and root mean square error of approximation (RMSEA ≤ 0.08). The Python script used for this analysis is provided as Supplemental File 1.
Results
Descriptive statistics of rice grain traits
The seven grain quality traits exhibited considerable variation across the 48 rice genotypes evaluated over four replications per year across two years (Table 2). Amylose content ranged from 15.97% to 28.68% (mean = 22.88%), indicating diverse starch properties. Gelatinization temperature varied from 3.13 to 7 (mean = 4.95), reflecting differences in cooking characteristics. Grain length and cooked grain length showed means of 7.21mm and 11.56mm, respectively, with ranges of 5.01–8.33mm and 8.47–14.37mm. Grain width averaged 2.14mm, ranging from 1.54 to 3.06mm. Grain shape, a ratio of length to width, had a mean of 3.42 (range = 1.70–5.48), while grain elongation, indicating cooking expansion, averaged 1.61 (range = 1.36–2.09). These results highlight substantial phenotypic diversity among genotypes, critical for breeding programmes targeting grain quality.
Table 2. Descriptive statistics of investigated traits in 48 studied rice genotypes. SE, standard error
|
Traits |
Range |
Minimum |
Maximum |
Mean±SE |
|
Amylose content (%) |
12.71 |
15.97 (Dcl) |
28.68 (Saleh) |
22.876 ± 0.207 |
|
Gelatinization temperature |
3.87 |
3.13 (Hashemi) |
7 (Saleh) |
4.949 ± 0.086 |
|
Grain length (mm) |
3.32 |
5.01 (Fuji Minori) |
8.33 (Gohar) |
7.173 ± 0.054 |
|
Grain width (mm) |
1.52 |
1.54 (Saleh) |
3.06 (Fuji Minori) |
2.163 ± 0.023 |
|
Cooked grain length (mm) |
5.9 |
8.47 (Champa Boodar) |
14.37 (Gohar) |
11.533 ± 0.079 |
|
Grain shape |
3.78 |
1.7 (Fuji Minori) |
5.48 (Saleh) |
3.428 ± 0.052 |
|
Grain elongation |
0.73 |
1.36 (Dorfak) |
2.09 (Gharib Siah Reyhani) |
1.616 ± 0.010 |
Analysis of variance (ANOVA)
Prior to pooling, a preliminary full model confirmed non-significant G × Y interaction for all traits (F = 0.91–1.28, df = 47, p > 0.10), together with homogeneous error variances across years (Levene’s test, p > 0.05). This justified combining the data across years for the final ANOVA. The effect of year (comparing the 2023 and 2024 growing seasons) was not statistically significant according to the ANOVA results, indicating that the measured traits remained consistent between the two years (Table 3). Two-way ANOVA revealed highly significant genotypic effects (p < 0.001) for all seven traits, underscoring substantial genetic variation. The calculated F-values for the genotype effect, derived from the mean squares presented in Table 3, ranged from 21.47 for grain elongation to 266.79 for gelatinization temperature, confirming strong differentiation among the 48 genotypes. In contrast, replication effects were non-significant (p > 0.05) for all traits, with corresponding F-values below 0.99, suggesting minimal environmental variation due to experimental blocks. These findings confirm that observed trait differences are primarily driven by genetic factors, facilitating effective selection for desired grain characteristics.
Table 3. Analysis of variance for grain quality traits among the 48 rice genotypes. * and ** are significant at 0.05 and 0.01 probability, respectively.
|
Source of Variation |
Degrees of Freedom |
Mean squares of traits |
||||||
|
Amylose content (%) |
Gelatinization temperature |
Grain length (mm) |
Grain width (mm) |
Cooked grain length (mm) |
Grain shape |
Grain elongation |
||
|
Year |
1 |
0.04 |
0.000 |
0.008 |
0.0115 |
0.001 |
0.00 |
0.0003 |
|
Varieties |
47 |
63.05** |
11.205** |
4.450** |
0.8500** |
8.752** |
4.261** |
0.14538** |
|
Replication |
3 |
2.15 |
0.039 |
0.202 |
0.0273 |
0.174 |
0.031 |
0.00041 |
|
Residuals |
332 |
0.56 |
0.042 |
0.091 |
0.0074 |
0.249 |
0.033 |
0.00677 |
Mean performance of genotypes
Mean comparisons among the studied genotypes were performed using Tukey’s honest significant difference (HSD) test at a 5% significance level to determine significant differences among treatments. The grouping letters shown in Table 4 represent the statistical comparison results, where means followed by the same letter are not significantly different from each other. This analysis provided a clear distinction of genotypic performance for each evaluated trait. For instance, Saleh exhibited the highest amylose content (27.1%) and grain shape (5.3), while Gohar had the longest grain (8.32mm) and cooked grain length (14.08mm) (Table 4). Gharib Siah Reyhani showed the highest grain elongation (2.04), and Fuji Minori had the widest grains (3.02mm) but the lowest grain shape (1.74) (Figure 1). These differences underscore the diversity in grain quality traits among the studied genotypes. In addition, results identified genotypes matching Iranian consumer preferences. For example, Deylamani (amylose content = 20.90%, gelatinization temperature = 3.75, grain length = 7.33mm, grain shape = 3.54), Hashemi (20.50%, 3.33, 7.03mm, 3.70), and Salari (20.70%, 4.00, 6.88mm, 3.62) exhibited moderate amylose content (19–23%) and gelatinization temperature (3–4), with grain lengths close to or above 7mm and slender grain shapes (≥ 3), although direct consumer preference was not assessed in this study.
Table 4. Mean performance for quality-related traits of the 48 studied genotypes with Tukey’s honest significant difference (HSD) groupings. Means followed by the same letter within a column are not significantly different at p < 0.05 according to Tukey’s HSD test.
|
Genotype |
Amylose content (%) |
Gelatinization temperature |
Grain length (mm) |
Grain width (mm) |
Cooked grain length (mm) |
Grain shape |
Grain elongation |
|
Abji Boji |
20.50 fg |
3.92 ef |
7.10 cde |
2.05 def |
11.50 def |
3.46 cd |
1.62 bc |
|
AhlamiTarom |
21.70 ef |
3.33 f |
7.57 bcd |
1.95 efg |
11.73 cde |
3.88 bc |
1.55 cd |
|
Ali Kazemi |
17.30 hi |
3.75 ef |
7.18 cde |
2.22 cd |
11.92 bcd |
3.23 de |
1.66 bc |
|
Anam |
25.00 bcd |
3.75 ef |
7.58 bcd |
1.98 efg |
12.16 bc |
3.82 bc |
1.60 bc |
|
Anbarboo |
22.90 de |
4.92 cd |
6.52 efg |
2.45 bc |
11.17 efg |
2.66 fg |
1.71 b |
|
Anbarboo Ilam |
23.60 cd |
4.33 de |
6.62 ef |
2.37 bc |
10.97 fg |
2.79 f |
1.66 bc |
|
Bejar |
26.30 abc |
6.75 a |
6.83 def |
2.07 def |
10.60 ghi |
3.30 de |
1.55 cd |
|
Binam |
22.10 e |
4.25 de |
6.73 def |
2.35 bc |
10.70 gh |
2.86 f |
1.59 bc |
|
Champa Boodar |
26.90 ab |
4.80 cd |
5.85 h |
2.78 a |
8.77 j |
2.10 h |
1.50 d |
|
Cy |
16.80 i |
3.83 ef |
7.90 abc |
2.50 b |
12.23 bc |
3.16 e |
1.55 cd |
|
Dcl |
16.70 i |
3.66 f |
7.95 ab |
1.85 gh |
12.08 bc |
4.30 ab |
1.52 d |
|
Deylamani |
20.90 f |
3.75 ef |
7.33 cde |
2.07 def |
11.17 efg |
3.54 c |
1.52 d |
|
Dom Sefid |
22.50 e |
5.50 bc |
7.62 bcd |
1.88 fg |
11.58 def |
4.05 b |
1.52 d |
|
Dom Siah |
22.50 e |
5.25 bc |
7.15 cde |
1.93 efg |
11.47 def |
3.70 bc |
1.60 bc |
|
Dom Zard |
21.30 f |
3.75 ef |
6.30 fg |
1.97 efg |
10.82 gh |
3.20 e |
1.72 b |
|
Dorfak |
24.40 cd |
4.17 de |
8.05 ab |
1.95 efg |
11.48 def |
4.13 b |
1.43 e |
|
Fajr |
23.60 cd |
7.00 a |
7.58 bcd |
1.82 gh |
11.93 bc |
4.16 b |
1.57 bc |
|
Fuji Minori |
21.90 ef |
5.58 b |
5.25 i |
3.02 a |
9.13 ij |
1.74 i |
1.74 b |
|
Gharib |
20.90 f |
4.17 de |
6.05 gh |
2.67 ab |
11.57 def |
2.27 gh |
1.91 a |
|
Gharib Siah Reyhani |
19.60 g |
4.25 de |
6.27 fg |
2.92 a |
12.80 ab |
2.15 h |
2.04 a |
|
Ghodsi |
18.90 h |
4.66 cd |
6.60 ef |
2.07 def |
11.97 bc |
3.19 e |
1.81 ab |
|
Gohar |
24.20 cd |
7.00 a |
8.33 a |
1.92 fg |
14.08 a |
4.34 ab |
1.69 b |
|
Hashemi |
20.50 fg |
3.33 f |
7.03 de |
1.90 fg |
11.13 efg |
3.70 bc |
1.58 bc |
|
Hassan Saraei |
21.90 ef |
5.16 bc |
7.35 cde |
2.02 ef |
12.03 bc |
3.64 c |
1.64 bc |
|
Hassani |
19.50 g |
5.42 bc |
6.58 ef |
2.60 ab |
11.57 def |
2.53 g |
1.79 ab |
|
IR36 |
26.20 abc |
7.00 a |
6.95 def |
2.10 de |
11.40 def |
3.31 de |
1.64 bc |
|
IR64 |
22.30 e |
6.00 b |
5.68 hi |
2.72 a |
11.08 fg |
2.09 h |
1.95 a |
|
Kadous |
25.00 bcd |
4.08 de |
7.98 ab |
1.85 gh |
11.80 bcd |
4.31 ab |
1.48 de |
|
Keshvari |
23.70 cd |
4.25 de |
7.70 bc |
1.73 h |
11.38 ef |
4.45 a |
1.48 de |
|
Khazar |
23.40 cd |
4.92 cd |
7.35 cde |
2.08 def |
10.50 hi |
3.53 c |
1.43 e |
|
Koohsar |
22.90 de |
4.17 de |
6.73 def |
2.55 b |
10.52 hi |
2.64 fg |
1.56 cd |
|
Line7 |
27.00 ab |
7.00 a |
7.75 bc |
1.92 fg |
13.28 a |
4.04 b |
1.71 b |
|
Mohammadi Chaparsar |
26.90 ab |
4.00 e |
6.12 gh |
2.48 bc |
9.35 i |
2.47 g |
1.53 d |
|
Mutant Gohar |
22.00 ef |
3.50 f |
7.58 bcd |
1.97 efg |
11.60 def |
3.85 bc |
1.53 d |
|
Neda |
26.00 abc |
4.50 d |
7.88 abc |
2.07 def |
12.20 bc |
3.81 bc |
1.55 cd |
|
Nemat |
26.00 abc |
7.00 a |
8.63 a |
1.95 efg |
12.60 abc |
4.43 a |
1.46 e |
|
Rash |
22.60 e |
3.83 ef |
6.73 def |
2.13 d |
9.82 hi |
3.16 e |
1.46 e |
|
Salari |
20.70 f |
4.00 e |
6.88 def |
1.90 fg |
11.73 cde |
3.62 c |
1.71 b |
|
Saleh |
27.10 a |
7.00 a |
8.32 a |
1.57 i |
12.87 ab |
5.30 a |
1.55 cd |
|
Sange Tarom |
22.70 de |
5.80 b |
7.23 cde |
2.50 b |
11.57 def |
3.53 c |
1.60 bc |
|
Sepidroud |
26.20 abc |
7.00 a |
6.92 def |
1.92 fg |
10.73 gh |
3.60 c |
1.55 cd |
|
Shahpasand |
25.30 bcd |
4.75 cd |
8.23 a |
2.13 d |
12.00 bc |
3.86 bc |
1.46 e |
|
Shiroudi |
25.60 abc |
4.75 cd |
7.53 bcd |
1.88 fg |
12.40 ab |
4.01 b |
1.65 bc |
|
TaromMahalli |
21.20 f |
5.00 cd |
7.27 cde |
2.08 def |
12.20 bc |
3.50 c |
1.68 b |
|
Tetep |
23.20 cd |
5.08 bc |
7.17 cde |
2.28 cd |
10.80 gh |
3.14 e |
1.51 d |
|
TH1 |
18.50 h |
4.41 de |
7.37 cde |
2.18 cd |
13.47 a |
3.38 de |
1.83 ab |
|
Tisa |
26.40 abc |
6.25 b |
7.90 abc |
2.40 bc |
13.03 ab |
3.29 de |
1.65 bc |
|
Zenith |
26.40 abc |
7.00 a |
7.07 cde |
2.13 d |
10.67 ghi |
3.32 de |
1.51 d |
|
Tukey HSD (0.05) |
1.35 |
0.62 |
0.68 |
0.18 |
0.95 |
0.31 |
0.14 |
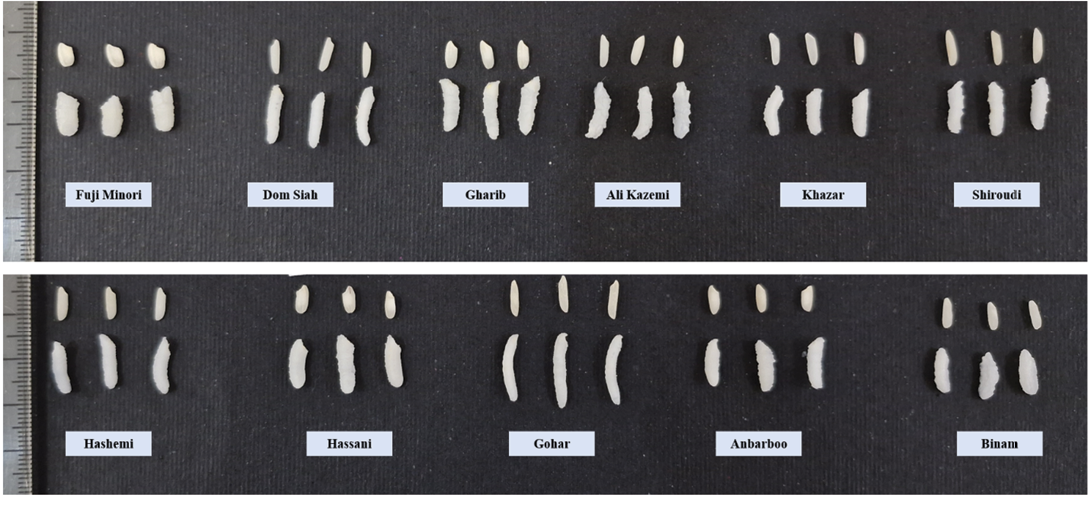
Figure 1. Comparative differences in grain length, grain width, and grain shape, as well as cooked grain length, cooked grain width, and cooked grain shape, among 11 selected rice genotypes (Fuji Minori, Dom Siah, Gharib, Ali Kazemi, Khazar, Shiroudi, Hashemi, Hassani, Gohar, Anbarboo, and Binam). The figure illustrates genotypic variation in both raw and cooked grain dimensions and shape, highlighting differences in grain morphology and cooking-related structural changes among contrasting rice types.
Genetic parameters
The high broad-sense heritability estimates (H² ≥ 0.968, Table 5) reflect substantial genotypic contribution to phenotypic variation under the conditions of this study, facilitated by low genotype × year interaction and minimal residual error. However, it should be noted that such extremely high heritability values likely represent upper-bound estimates obtained under highly controlled experimental conditions. The evaluation was conducted at a single location with uniform agronomic management, using pure-line genotypes and laboratory-based grain quality measurements, all of which tend to reduce environmental variance and inflate heritability estimates. Genetic parameters, including genotypic variance, phenotypic variance, broad-sense heritability, and genetic advance, were estimated using genotype means pooled across years. Year and genotype × year interaction effects were treated as environmental sources of variation and were therefore not included in the calculation of genetic parameters. This approach provides estimates of overall genetic potential that are less influenced by year-specific environmental fluctuations and is widely adopted in multi-year crop evaluation studies (Schmidt et al, 2019; Rajaprakasam et al, 2025). Estimation of genetic parameters revealed high genetic variability for the studied traits (Table 5). Genotypic variance (σ²g) was highest for amylose content (7.7834) and lowest for grain elongation (0.0175). Phenotypic variance (σ²p) followed a similar trend, with values ranging from 0.0181 (grain elongation) to 7.9149 (amylose content). Genotypic coefficients of variation (GCV) were highest for gelatinization temperature (24.018%) and grain shape (21.0828%), indicating substantial genetic diversity, while grain elongation showed the lowest GCV (8.1926%). Phenotypic coefficients of variation (PCV) were slightly higher than GCV, reflecting environmental influences. Broad-sense heritability (H²) was high for all traits, ranging from 0.968 (grain elongation) to 0.9957 (gelatinization temperature), indicating that trait variation was predominantly genetic. Genetic advance (GA) as a percentage of the mean was highest for gelatinization temperature (49.3704%) and grain shape (43.2934%), suggesting strong potential for selection-based improvement.
Table 5. Estimation of genetic parameters for grain quality related traits of studied rice genotypes. Grand Mean, Arithmetic mean of the population for the respective trait; σ²g, Genotypic variance; σ²e, Environmental (error) variance; σ²p, Phenotypic variance; GCV, Genotypic coefficient of variation (%); PCV, Phenotypic coefficient of variation (%); H², Broad-sense heritability; GA, Expected genetic advance under selection; GA Percent Mean, Genetic advance expressed as a percentage of the grand mean.
|
Trait |
Grand Mean |
σ²g |
σ²e |
σ²p |
GCV |
PCV |
H2 |
GA |
GA Percent Mean |
|
Amylose content |
22.9104 |
7.7834 |
0.1315 |
7.9149 |
12.1774 |
12.2798 |
0.9834 |
5.6992 |
24.8761 |
|
Gelatinization temperature |
4.9494 |
1.4131 |
0.0061 |
1.4192 |
24.018 |
24.0699 |
0.9957 |
2.4435 |
49.3704 |
|
Grain length |
7.1726 |
0.5231 |
0.0125 |
0.5357 |
10.084 |
10.2042 |
0.9766 |
1.4724 |
20.5286 |
|
Grain width |
2.1635 |
0.1026 |
0.0011 |
0.1036 |
14.804 |
14.8806 |
0.9897 |
0.6564 |
30.339 |
|
Cooked grain length |
11.5327 |
1.0771 |
0.0337 |
1.1108 |
8.9991 |
9.1387 |
0.9697 |
2.1053 |
18.255 |
|
Grain shape |
3.4278 |
0.5223 |
0.0033 |
0.5256 |
21.0828 |
21.1497 |
0.9937 |
1.484 |
43.2934 |
|
Grain elongation |
1.6159 |
0.0175 |
6.00E-04 |
0.0181 |
8.1926 |
8.327 |
0.968 |
0.2683 |
16.6044 |
Correlation among traits
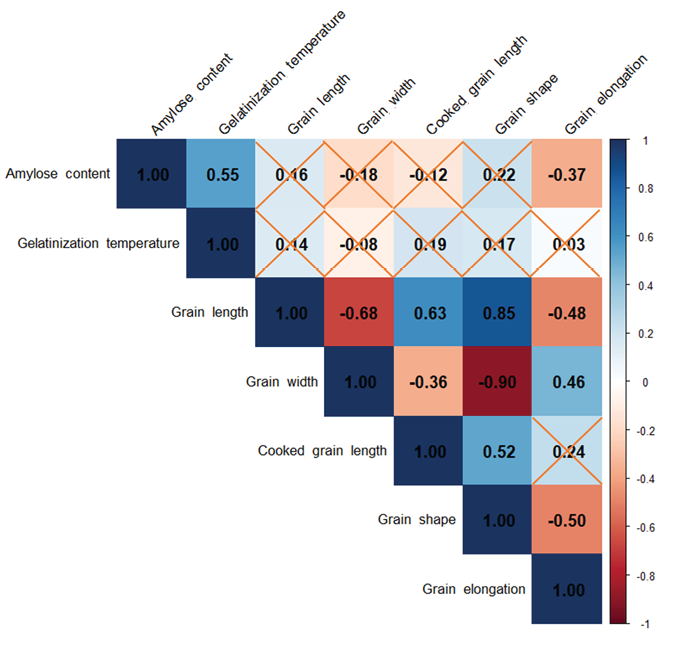
Pearson correlation coefficients revealed significant relationships among traits (Figure 2). Grain length was strongly positively correlated with grain shape (r = 0.890, p < 0.01) and cooked grain length (r = 0.675, p < 0.01), but negatively correlated with grain width (r = -0.711, p < 0.01) and grain elongation (r = -0.518, p < 0.01). Grain width showed a strong negative correlation with grain shape (r = -0.918, p < 0.01) and a positive correlation with grain elongation (r = 0.491, p < 0.01). Amylose content was positively correlated with gelatinization temperature (r = 0.557, p < 0.01), indicating a strong positive correlation, and showed a weak positive correlation with grain shape (r = 0.222, p < 0.05), but was negatively correlated with grain elongation (r = -0.385, p < 0.01). Cooked grain length was positively correlated with grain shape (r = 0.556, p < 0.01) and grain elongation (r = 0.276, p < 0.05). These correlations suggest complex interdependencies among traits, influencing grain quality outcomes.
Hierarchical clustering and heatmap
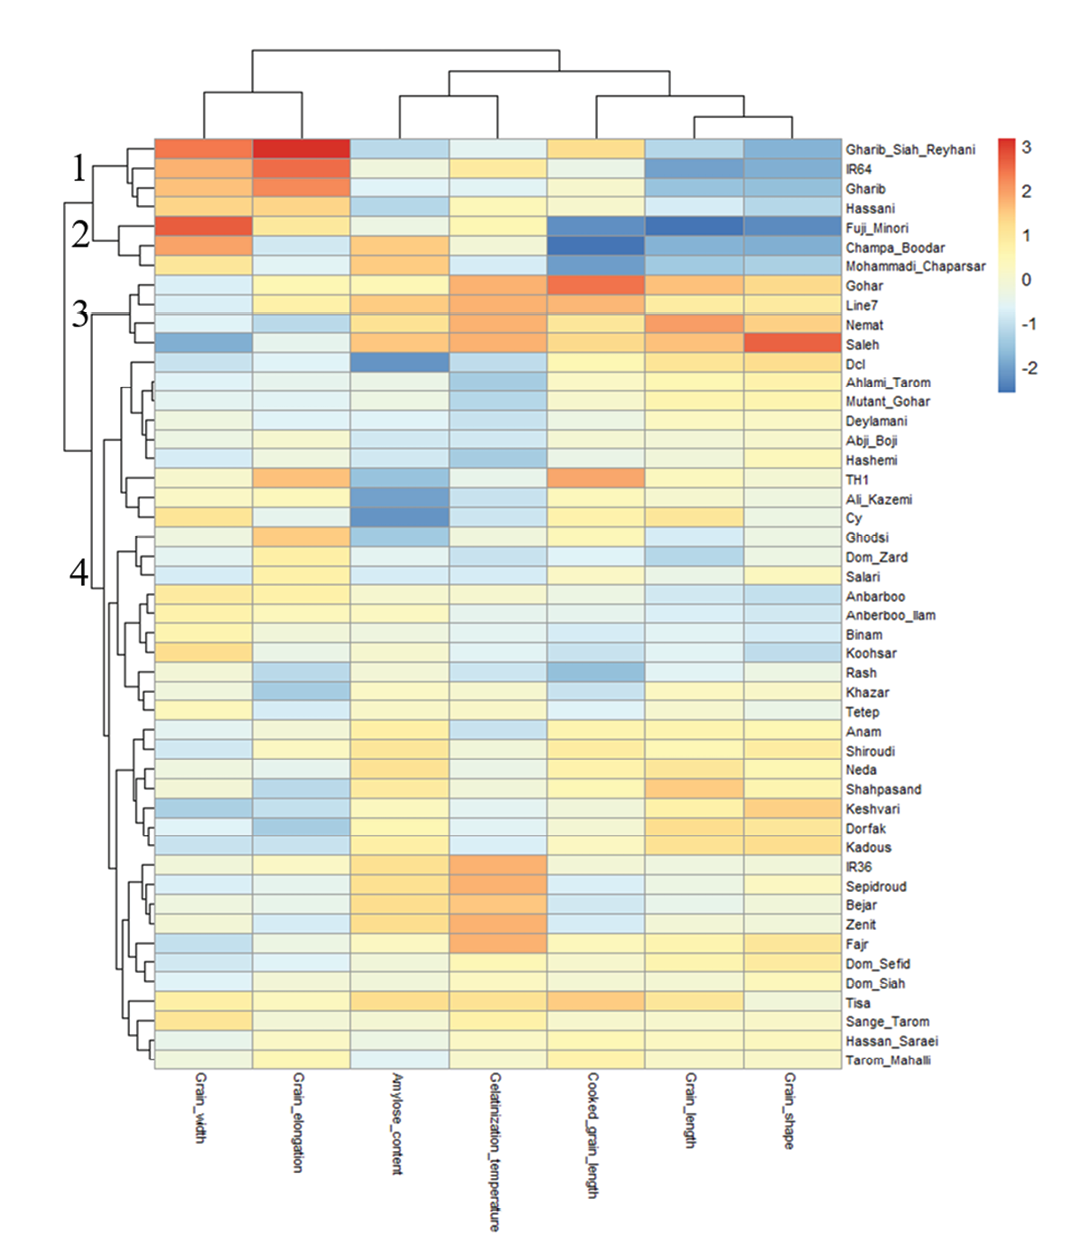
Hierarchical clustering, visualized through a heatmap, grouped the 48 genotypes based on their trait profiles (Figure 3). Four major genotype clusters emerged. Cluster 1 included Gharib Siah Reyhani, IR64, Gharib, and Hassani. This cluster was characterized by high grain elongation and high grain width, with Gharib Siah Reyhani showing the highest grain elongation (٢.٠٤). Cluster ٢ comprised Fuji Minori, Champa Boodar, and Mohammadi Chaparsar, which also exhibited elevated grain elongation and width, though to a slightly lower extent than Cluster 1. Cluster 3 consisted of Gohar, Line7, Nemat, and Saleh. Within this cluster, Saleh and Line7 displayed high amylose content (٢٧.١٪ and ٢٧.٠٪, respectively) and pronounced grain shape (٥.٣ and ٤.٠٤). Cluster ٤ was the largest group, containing the remaining genotypes from Dcl to Tarom Mahalli (including Ahlami Tarom, Deylamani, Hashemi, Shiroudi, Dom Sefid, Sange Tarom, and many others). This cluster was associated with intermediate trait values, particularly for cooked grain length and grain length. Trait clustering showed that grain length, grain shape, and cooked grain length were closely related, while grain elongation and grain width formed a separate cluster, consistent with correlation results.
Principal component and genotype biplot analysis
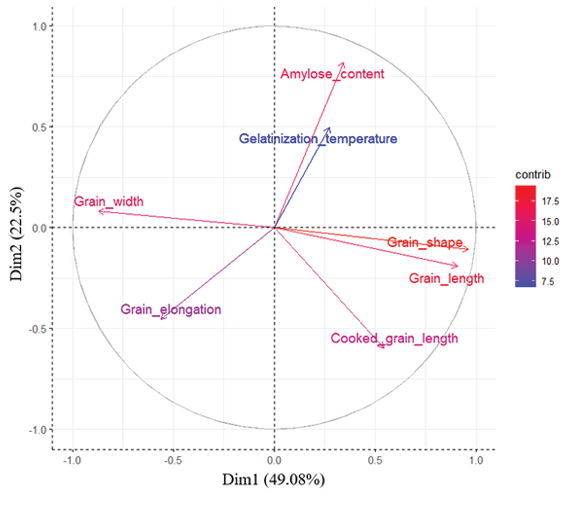
PCA biplot (Figure 4) revealed that PC1 and PC2 explained 49.08% and 24.62% of the total variation, respectively (total 73.70% of the variation). Grain length, grain shape, and cooked grain length were positively associated along PC1, while grain width and elongation negatively correlated with these traits. Amylose content and gelatinization temperature were closely aligned along PC2, reflecting their positive correlation (r = 0.557). Variables such as cooked grain length and grain shape exhibited the highest contributions, as indicated by their red-coloured, longer arrows, strongly influencing Dim1 and suggesting a positive correlation with this component. In contrast, variables like grain width and grain elongation showed lower contributions, represented by shorter blue arrows, indicating a weaker influence on the principal components. These findings highlight the key morphometric and physicochemical traits driving variation among the rice genotypes, providing insights into their interrelationships and potential implications for breeding programmes aimed at improving grain quality traits.
The genotype biplot (Figure 5), based on cos² values, further elucidated genotypic relationships. Genotypes like Saleh, Nemat, and Saleh were positioned in the upper-right quadrant, associated with high grain shape and cooked grain length. Gharib Siah Reyhani, Hassani, and TH1 clustered in the lower-left quadrant, linked to high grain elongation. Champa Boodar and Fuji Minori were located in the upper-left quadrant of the PCA biplot, reflecting wider grains and more compact shapes compared to the typical long-grain Iranian types. In contrast, genotypes such as Deylamani, Hashemi, and Shiroudi were positioned near the centre of the plot, indicating more balanced trait profiles in terms of grain shape and width.
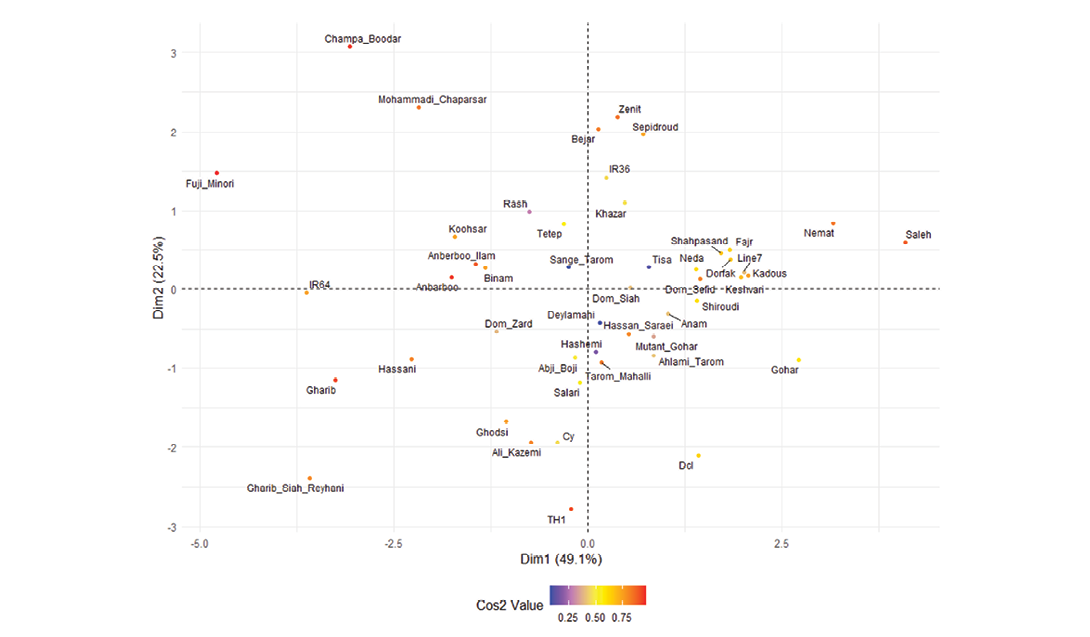
Figure 5. Genotype biplot (cos² colour-coded) of 48 rice genotypes, illustrating genotypic relationships based on grain quality traits. Colour intensity indicates cos² values (purple (low cos², ~0.0-0.25) for minimal contribution, yellow (moderate cos², ~0.25-0.50) for intermediate influence, orange (high cos², ~0.50-0.75) for significant impact, and red (very high cos², ~0.75-1.0) for the strongest association with the analyzed traits).
Path analysis
Before presenting numerical results, it is important to emphasize that the specified path models represent biologically informed hypotheses about trait dependencies rather than definitive causal proofs. The models were designed to reflect the temporal and mechanistic hierarchy of rice grain traits, progressing from primary morphological attributes (grain length and width), to composite descriptors (grain shape), to cooking-induced outcomes (cooked grain length and grain elongation), and finally to key physicochemical determinants of eating quality (amylose content). For a comprehensive understanding of the interrelationships among rice quality characteristics, the selection of appropriate dependent (or resultant) traits for path analysis is paramount. Based on their significant contribution to overall rice quality and consumer preference, cooked grain length and amylose content were chosen as separate dependent variables for independent path analyses. Cooked grain length was selected as a key dependent trait due to its direct relevance to the final physical quality of the grain after cooking. As a primary component of cooking and eating quality, particularly in markets that highly value long, slender grains, cooked grain length serves as an integrated outcome variable. It inherently reflects the combined effects of the raw grain's morphological dimensions and its complex cooking behaviour. Analyzing the direct and indirect influences on cooked grain length allows for a mechanistic understanding of how initial grain properties translate into the ultimate consumer experience.
Concurrently, amylose content was chosen as a second, distinct dependent variable. Despite being a chemical component, amylose content is widely recognized as the single most important determinant of rice cooking and eating quality, profoundly influencing texture attributes such as stickiness, hardness and fluffiness. By modelling amylose content as a dependent trait, the path analysis can elucidate the genetic and morphological factors that underpin this fundamental chemical property.
Cooked grain length: The path analysis (Figure 6A) revealed significant relationships among grain characteristics and cooking properties with cooked grain length as a focal trait. Significant paths were identified. Cooked grain length was strongly influenced by grain length (path coefficient β = 0.699, p < 0.001) but not grain width (β = 0.109, p = 0.152), with an R² of 0.398, indicating moderate predictability. Grain shape was highly predicted by grain length (β = 0.454, p < 0.001) and grain width (β = -0.588, p < 0.001), yielding an R² of 0.913. Grain elongation was significantly affected by cooked grain length (β = 0.685, p < 0.001) and grain shape (β = -0.853, p < 0.001), with an R² of 0.587. Amylose content negatively impacted grain width (β = -0.192, p = 0.023) but not grain length (β = 0.114, p = 0.180). Gelatinization temperature showed no significant effects on grain length (β= 0.078, p = 0.357) or grain width (β = 0.020, p = 0.809). A significant covariance was observed between amylose content and gelatinization temperature (β = 0.545, p < 0.001). These findings highlight cooked grain length as a key mediator between grain length and elongation, with strong interdependencies among grain shape and elongation. This confirms that elongation is primarily a function of post-cooking kernel expansion rather than an independent morphological trait.
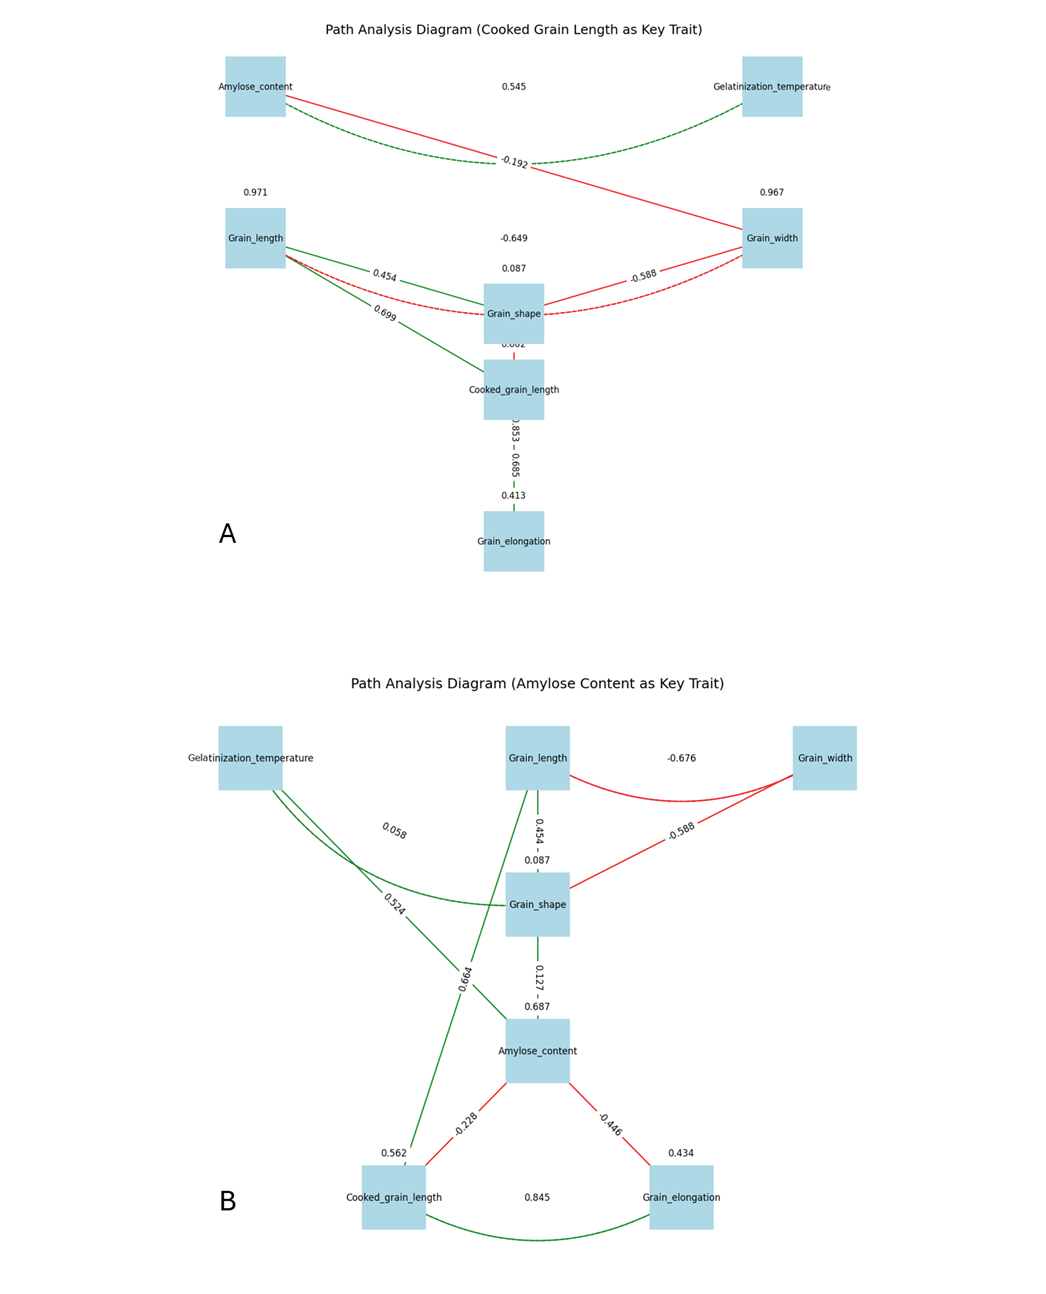
Figure 6. Path analysis diagram. A, Cooked grain length as key trait. B, Amylose content as key trait. The numbers on the connecting lines represent path coefficients (β), which indicate the strength and direction of the relationships between traits: positive values signify a positive influence, while negative values signify a negative influence. The magnitude of these coefficients reflects the degree of impact. The colours of the lines denote the type of relationship: green lines represent positive effects, red lines indicate negative effects, and the thickness of the lines corresponds to the relative strength of the coefficients.
Amylose content: Path analysis (Figure 6B) was conducted to elucidate the relationships among grain traits, with amylose content as the central trait. Standardized path coefficients revealed significant (p < 0.05) direct effects, with gelatinization temperature positively influencing amylose content (β = 0.52, p = 0.002), indicating that higher gelatinization temperatures enhance amylose content. Grain shape also had a significant positive effect on amylose content (β = 0.127, p = 0.008), suggesting that slender grains correlate with higher amylose levels. Grain shape was strongly determined by grain length (β = 0.454, p < 0.001) and grain width (β = -0.588, p = 0.015), with longer, narrower grains resulting in higher shape ratios. Amylose content significantly influenced cooked grain length (β = -0.228, p = 0.012) and grain elongation (β = -0.446, p = 0.020), highlighting its role in post-cooking grain characteristics. Grain length indirectly affected cooked grain length, while cooked grain length influenced grain elongation (β = 0.845, p = 0.005). Significant covariances were observed between gelatinization temperature and grain shape (r = 0.058, p = 0.030), and grain length and grain width (r = -0.676, p = 0.008), indicating interrelated trait dynamics. R-squared values indicated that the model explained 68% of the variance in amylose content. These results underscore amylose content as a pivotal mediator linking physicochemical and morphological traits to cooking quality in rice.
Discussion
The present study provides a comprehensive analysis of grain quality traits in 48 diverse rice genotypes, revealing significant variability, trait interdependencies and genotypic diversity that have important implications for rice breeding programmes aimed at improving cooking and eating quality. The results demonstrate a strong genetic control of grain quality traits across the two growing seasons, as the non-significant year effect from the ANOVA analysis suggests consistent trait expression despite annual variations, while the highly significant genotypic effects emphasized the predominant role of genetic diversity among the evaluated rice genotypes. The negligible replication effects further indicate minimal environmental interference, reinforcing that observed differences are genetically driven, which is advantageous for targeted breeding programmes aimed at enhancing desirable traits.
The stability of rice grain quality traits across different years observed in our study is supported by Kunjaroenruk et al (2025), who reported that certain rice quality parameters, evaluated across multiple seasons in a tropical savannah environment, remained unaffected by seasonal variations, highlighting the predominant role of genotypic factors over temporal environmental changes. The significant genotypic variation observed across all traits (Table 3) aligns with previous studies on rice grain quality, such as those by Ferdous et al (2018) and Karim et al (2024), which reported substantial diversity in amylose content, grain dimensions and cooking properties among rice cultivars. The broad variation observed among genotypes reflects the inclusion of Iranian landraces, improved varieties, and lines, providing a rich genetic pool for selection. This diversity is critical for breeding programmes targeting specific quality traits, such as high grain elongation for consumer-preferred aromatic varieties or tailored amylose levels for different cooking applications. The HSD test at the 5% level (Table 4) delineated genotypic differences, and high broad-sense heritability and genetic advance highlight traits with strong potential for selection in breeding programmes.
The high broad-sense heritability estimates and genetic advance values indicate that many of the evaluated grain quality traits possess strong potential for improvement through selection. However, these exceptionally high heritability estimates should be interpreted with caution, as grain quality traits are generally more stable and less environmentally sensitive than yield-related traits, particularly when measured under controlled laboratory conditions. Moreover, the absence of significant genotype × year interaction, combined with single-location testing, uniform crop management, and the use of genetically fixed pure lines, likely reduced environmental variance and inflated heritability estimates. Such inflation under optimized experimental conditions has been widely reported in rice quality studies and does not necessarily imply similar expression across diverse environments or production systems. Therefore, the heritability estimates reported here should be regarded as indicators of genetic potential under favourable and controlled conditions rather than absolute parameters. Similar observations have been reported by Nirmaladevi et al (2015), Hori and Sun (2022) and Al-Daej (2022), who emphasized the relative stability of grain quality traits compared with yield-related traits.
Correlation analysis (Figure 2) revealed important relationships among grain quality traits that have direct implications for breeding strategies. The strong positive associations among grain length, grain shape and cooked grain length highlighted grain length as a key morphometric trait influencing visual appeal and cooking quality, as supported by previous literature (Anne et al, 2018; Arikit et al, 2019; Cruz et al, 2021). Conversely, the negative associations between grain length and grain elongation, as well as between grain shape and grain elongation, suggest potential trade-offs, where slender or longer grains may exhibit reduced elongation during cooking. This phenomenon may be attributed to structural constraints in the starch matrix and has been reported previously for premium rice types such as Basmati (Bhattacharjee et al, 2002; Singh et al, 2018). The substantial inclusion of Iranian landraces in this study revealed unique grain quality profiles – such as the outstanding elongation of Gharib Siah Reyhani and the preferred moderate amylose and gelatinization temperature combinations in Deylamani, Hashemi, and Salari – that are characteristic of traditional Iranian rice types valued by consumers. These findings emphasize the uniqueness of landrace germplasm and its irreplaceable role as a representative reservoir of genetic variation for grain quality.
The positive association between amylose content and gelatinization temperature is consistent with the biochemical properties of starch, as higher amylose levels generally require greater thermal energy for gelatinization. Similar relationships have been documented by Xu et al (2024) and Zhao et al (2022b). The observed negative association between amylose content and grain elongation suggests that high-amylose genotypes may be less suitable for rice types where pronounced elongation after cooking is preferred, such as aromatic rice. Comparable findings were reported by Karim et al (2024), although contrasting results have been observed by Bandara et al (2025), indicating that genotype composition and genetic background strongly influence these relationships. The substantial inclusion of Iranian landraces in this study revealed distinctive grain quality profiles – such as superior elongation in certain traditional genotypes and favourable combinations of moderate amylose content and gelatinization temperature in others – that are characteristic of rice types preferred by Iranian consumers. These results highlight the importance of landrace germplasm as an irreplaceable reservoir of genetic diversity for grain quality improvement, particularly for region-specific breeding objectives.
Hierarchical clustering (Figure 3) effectively grouped genotypes based on their overall grain quality profiles, allowing the identification of clusters with distinct and agronomically relevant characteristics. Genotypes characterized by high grain elongation and width may serve as promising parents for breeding programmes targeting elongation, while those with high amylose content and slender grain shape may be suitable for markets requiring firmer, non-sticky cooked rice. The largest cluster, comprising genotypes with intermediate trait values, reflects broad adaptability and potential versatility for diverse consumer preferences. The clustering of traits further reinforced the strong interrelationships among grain length, grain shape and cooked grain length, consistent with correlation and path analysis results. Similar trait-based clustering patterns have been reported by Abdelsalam et al (2025).
Principal component analysis serves as a powerful tool for identifying trends, reducing redundancy and elucidating complex interrelationships within datasets, even across diverse crop species characterized by varying yields and grain attributes (Islam et al, 2024). This versatility underscores its utility in agricultural research, where multifaceted traits must be analyzed to inform breeding decisions. By focusing on maximizing the explained variance while accounting for trait interconnections, PCA facilitated the classification of accessions into distinct groups, highlighting genotypic diversity and potential trade-offs in quality profiles (Khatun et al, 2023). PCA and genotype biplots (Figures 3 and 4) provided deeper insight into trait associations and varietal performance. Along PC1, which accounted for 49.08% of the variance, positive loadings were observed for grain length, grain shape and cooked grain length, indicating their coordinated contribution to overall grain morphology and cooking appeal. In contrast, grain width and grain elongation exhibited negative associations, consistent with correlation analyses that suggest antagonistic relationships – longer grains often correspond to reduced width, potentially impacting milling efficiency and breakage susceptibility. This mirrors observations in Abdelsalam et al (2025), where PCA revealed two primary dimensions explaining 94.2% of variance: one dominated by physical-processing traits and another by nutritional-functional attributes. Furthermore, the alignment of amylose content and gelatinization temperature along PC2 (22.5% variance) reinforces their biochemical interdependence, as amylose influences starch granule stability and gelatinization behaviour during cooking. This association aligns with Cruz et al (2021), who reported strong genetic correlations among amylose content, gelatinization temperature (measured as alkali-spread value), and pasting properties in Latin American rice germplasm.
The path analysis underscored cooked grain length’s pivotal role in rice quality, with grain length strongly predicting it, aligning with Devi et al (2017), and John and Raman (2023) who found uncooked grain length as a primary determinant of cooked grain length across rice varieties. However, the negative effect of grain shape on elongation contrasts with Devi et al (2017), who reported a positive relationship, possibly due to genotypic diversity between their samples and ours. These results indicate that amylose content has a significant but limited effect on grain width, while gelatinization temperature has no significant effect on grain dimensions. In contrast, Bhardwaj et al (2019) suggested that higher amylose content is associated with longer and broader grains in indica rice.
Amylose content is a critical mediator in rice grain quality, significantly influenced by gelatinization temperature and grain shape, and affecting cooked grain length and grain elongation. The positive effect of gelatinization temperature on amylose content aligns with findings by Jane et al (2025), who reported that gelatinization temperature directly influences amylose content by promoting amylose leaching and inducing structural changes in starch granules. In addition, Neoh et al (2020) and Yang et al (2024) reported a positive correlation between higher gelatinization temperatures and higher amylose content. However, this result contrasts with Pang et al (2016), who reported that correlation analyses revealed a high amylose content in inbred lines was associated with lower gelatinization temperatures, suggesting varietal differences may account for the discrepancy. The significant influence of grain shape on amylose content supports Al-Daej (2022), who found significant positive correlations between grain shape and amylose content.
Conclusion
In this study, we characterized 48 rice genotypes for key grain quality traits, revealing substantial genetic variation and high broad-sense heritability for traits such as grain shape, gelatinization temperature and grain length, indicating strong potential for selection in quality-oriented breeding programmes. Our findings identified genotypes with favourable trait combinations, including long, slender grains with moderate amylose content, which, according to prior literature, align with preferred rice characteristics in Iranian and regional markets. However, this study has several limitations: (1) evaluations were conducted at a single location, which may limit the generalizability of the results across diverse environments; (2) the data are purely phenotypic, without molecular or genomic validation; (3) genetic analyses were restricted to broad-sense heritability, which does not partition additive and non-additive effects; and (4) multi-environment performance and genotype × environment interactions were not assessed. Despite these limitations, the study provides a robust framework for initial phenotypic selection of high-quality rice genotypes and highlights promising candidates for future breeding. Further research incorporating multi-location trials, molecular marker data and advanced genetic analyses is recommended to validate and extend these findings.
Supplemental File 1. Python Script for Path Analysis Diagram of Cooked Grain Length as a Key Trait.
Data availability
The datasets generated during the current study are available from the corresponding author on reasonable request.
Acknowledgments
This work was supported by the Rice Research Institute of Iran. The authors thank Mr Mohammad Mohammadi, Mrs Mitra Yekta, Dr Mina Ebrahimi, Mrs Tahereh Mohseni, and Mr Mahmoud Sayyadi for their assistance and companionship.
Conflict of interest statement
The author declare that the research was conducted in the absence of any commercial or financial relationships that could be construed as potential conflicts of interest.
References
Abarshahr, M., Rabiei, B., Lahigi, H.S. (2011). Genetic variability, correlation and path analysis in rice under optimum and stress irrigation regimes. Notulae Scientia Biologicae 3 (4), 134-142. https://doi.org/10.15835/nsb346280
Abdelsalam, K.M., Shaalan, A.M., AbouEl-Soud, G.M., El-Dalil, M.A., Marei, A.M., El-Moneim, D.A., El-Banna, A.A., Lamlom, S.F., Abdelghany, A.M. (2025). Comprehensive quality profiling and multivariate analysis of rice (Oryza sativa L.) cultivars: integrating physical, cooking, nutritional, and micronutrient characteristics for enhanced varietal selection. BMC Plant Biology 25 (1), 492. https://doi.org/10.1186/s12870-025-06438-5
Al-Daej, M.I. (2022). Genetic studies for grain quality traits and correlation analysis of mineral element contents on Al-Ahsa rice and some different varieties (Oryza sativa L.). Saudi Journal of Biological Sciences 29 (3), 1893-1899. https://doi.org/10.1016/j.sjbs.2021.10.032
Anne, S., Islam, S., Haque, M., Raffi, S. (2018). Evaluation of Physical and Cooking Property Based Grain Quality Traits in Popular Rice (Oryza sativa L.) Cultivars of Bangladesh. Sch. J. Agric. Vet. Sci 5 (3), 172-178.
Arikit, S., Wanchana, S., Khanthong, S., Saensuk, C., Thianthavon, T., Vanavichit, A., Toojinda, T. (2019). QTL-seq identifies cooked grain elongation QTLs near soluble starch synthase and starch branching enzymes in rice (Oryza sativa L.). Scientific reports 9 (1), 8328. https://doi.org/10.1038/s41598-019-44856-2
Bandara, A., Batugahage, B., Prasantha, B., Senanayake, D. (2025). Impact of amylose content on physical properties, cooking qualities, and water absorption of long-grain basmati-type rice (Oryza sativa L.) varieties. Ceylon Journal of Science 54 (1). https://doi.org/10.4038/cjs.v54i1.8418
Bhardwaj, R., Salgotra, R., Sharma, M. (2019). Studies on correlation of amylose content and grain dimensions in Basmati rice (Oryza sativa L.). Electronic Journal of Plant Breeding 10 (2), 364-369. http://dx.doi.org/10.5958/0975-928X.2019.00046.2
Bhattacharjee, P., Singhal, R.S., Kulkarni, P.R. (2002). Basmati rice: a review. International Journal of Food Science and Technology 37 (1), 1-12. https://doi.org/10.1046/j.1365-2621.2002.00541.x
Birla, D.S., Malik, K., Sainger, M., Chaudhary, D., Jaiwal, R., Jaiwal, P.K. (2017). Progress and challenges in improving the nutritional quality of rice (Oryza sativa L.). Critical Reviews in Food Science and Nutrition 57 (11), 2455-2481. https://doi.org/10.1080/10408398.2015.1084992
Cruz, M., Arbelaez, J.D., Loaiza, K., Cuasquer, J., Rosas, J., Graterol, E. (2021). Genetic and phenotypic characterization of rice grain quality traits to define research strategies for improving rice milling, appearance, and cooking qualities in Latin America and the Caribbean. The Plant Genome 14 (3), e20134. https://doi.org/10.1002/tpg2.20134
Devi, K.R., Chandra, B.S., Lingaiah, N., Hari, Y., Venkanna, V. (2017). Analysis of variability, correlation and path coefficient studies for yield and quality traits in rice (Oryza sativa L.). Agricultural Science Digest-A Research Journal 37 (1), 1-9. https://doi.org/10.18805/asd.v0iOF.7328
Ferdous, N., Elias, S.M., Howlader, Z.H., Biswas, S.K., Rahman, M.S., Habiba, K.K., Seraj, Z.I. (2018). Profiling Bangladeshi rice diversity based on grain size and amylose content using molecular markers. Current Plant Biology 14 56-65. https://doi.org/10.1016/j.cpb.2018.09.002
Hori, K., Sun, J. (2022). Rice grain size and quality. Rice 15 (1), 33. https://doi.org/10.1186/s12284-022-00579-z
Islam, M.A., Hasan, M.M., Hossain, M.A., Haque, M.A., Siddique, M.N.A., Shamsuddoha, M., Habib, M.A., Risha, S.S. (2024). Identification and evaluation of high-performing advanced germplasm of rice through morphological and breeding value analysis. Discover Agriculture 2 (1), 1-13. https://doi.org/10.1007/s44279-024-00143-x
Jane, K.A., Inamdar, N.N., Kotagale, N.R. (2025). Effect of gelatinizing temperature and moisture on the retrogradation of coix starch. International Journal of Biological Macromolecules 143860. https://doi.org/10.1016/j.ijbiomac.2025.143860
John, D., Raman, M. (2023). Physicochemical properties, eating and cooking quality and genetic variability: A comparative analysis in selected rice varieties of South India. Food Production, Processing and Nutrition 5 (1), 49. https://doi.org/10.1186/s43014-023-00164-x
Juliano, B., Perez, C. (1984). Results of a collaborative test on the measurement of grain elongation of milled rice during cooking. Journal of Cereal Science 2 (4), 281-292. https://doi.org/10.1016/S0733-5210(84)80016-8
Juliano, B.O. (1971). A simplified assay for milled-rice amylose. Cereal Sci. Today 12 334-360. url: https://www.researchgate.net/publication/275886661_A_Simplified_Assay_for_Milled-Rice_Amylose
Karim, M.D., Abuhena, M., Hossain, M.D., Billah, M.M. (2024). Assessment and comparison of cooking qualities and physio-chemical properties of seven rice varieties in terms of amylose content. Food Physics 1 100014. https://doi.org/10.1016/j.foodp.2024.100014
Khatun, M., Islam, M., Khan, M., Hossain, M., Islam, A. (2023). Principal component analysis and estimated breeding values for selecting suitable parental genotypes in rice (Oryza sativa L.). Sabrao Journal of Breeding & Genetics 55 (6).
http://doi.org/10.54910/sabrao2023.55.6.3
Kumar, A.P., Sarawgi, A., Verulkar, S., Verma, R. (2010). Correlation coefficient and path analysis study among grain quality components in rice (Oryza sativa L.). Electronic Journal of Plant Breeding 1 (6), 1468-1473. https://www.cabidigitallibrary.org/doi/pdf/10.5555/20113103136
Kunjaroenruk, J., Koonmanee, S., Singkham, N., Chankaew, S., Suriharn, K. (2025). Genotypic variation and seasonal effects on rice (Oryza sativa L.) grain protein content and yield in tropical Savannah environment. Journal of Agriculture and Food Research 20 101778. https://doi.org/10.1016/j.jafr.2025.101778
Little, R.R. (1958). Differential effect of dilute alkali on 25 varieties of milled white rice. Cereal Chem. 35 111-126.
Malik, A., Kumar, A., Ellur, R.K., Krishnan S, G., Dixit, D., Bollinedi, H., Vinod, K., Nagarajan, M., Bhowmick, P., Singh, N. (2022). Molecular mapping of QTLs for grain dimension traits in Basmati rice. Frontiers in Genetics 13 932166. https://doi.org/10.3389/fgene.2022.932166
Modarresi, M. (2023). Rice Breeding in Iran, Current Status and Future Perspective. Plant Breeding and Biotechnology 11 (2), 97-104. https://doi.org/10.9787/PBB.2023.11.2.97
Modarresi, M., AllahGholipour, M., Ebadi, A. (2024). Estimation of Gene Effect and Combining Ability for Yield and Yield Components Using Line x Tester Analysis in Rice (Oryza sativa L.). Plant Breeding and Biotechnology 12 17-29. https://doi.org/10.9787/PBB.2024.12.17
Neoh, G.S., Tan, X., Dieters, M., Fox, G., Gilbert, R. (2020). Effects of cold temperature on starch molecular structure and gelatinization of late-maturity alpha-amylase affected wheat. Journal of Cereal Science 92 102925. https://doi.org/10.1016/j.jcs.2020.102925
Nirmaladevi, G., Padmavathi, G., Suneetha Kota, S.K., Babu, V.R. (2015). Genetic variability, heritability and correlation coefficients of grain quality characters in rice (Oryza sativa L.). SABRAO Journal of Breeding and Genetics 47 (4), 424-433.
Pang, Y., Ali, J., Wang, X., Franje, N.J., Revilleza, J.E., Xu, J., Li, Z. (2016). Relationship of rice grain amylose, gelatinization temperature and pasting properties for breeding better eating and cooking quality of rice varieties. PloS one 11 (12), e0168483. https://doi.org/10.1371/journal.pone.0168483
R-Core-Team (2023). R: a language and environment for statistical computing; R Core team: Vienna, Austria, 2023. Available at: www. r-project. org (Accessed February 17, 2023).
Rajaprakasam, S., Jafarullakhan, S.S., Vijayakumar, V., Saravanan, N.A., Rathinavelu, S., Kannan, B., Chockalingam, V., Muthurajan, R., Kanagarajan, S. (2025). Multi-model-based validation of multi-environment trial results in horse gram (Macrotyloma uniflorum Lam. Verdc.). Scientific Reports 15 (1), 41266. https://doi.org/10.3390/metabo13020165
Safiedin Ardebili, S.M., Azizinezhad, R., Saadatmand, S., Ahmadvand, R., Mehregan, I. (2024). Investigation of the Morphometric Diversity of Ali Kazemi Rice in Iran. Journal of Genetic Resources 10 (2), 131-142. url: https://sc.journals.umz.ac.ir/article_5069_938101953784273f928db45fff441fa5.pdf
Schmidt, P., Hartung, J., Bennewitz, J., Piepho, H.P. (2019). Heritability in plant breeding on a genotype-difference basis. Genetics 212 (4), 991-1008. https://doi.org/10.1534/genetics.119.302134
Singh, V., Singh, A.K., Mohapatra, T., S, G.K., Ellur, R.K. (2018). Pusa Basmati 1121–a rice variety with exceptional kernel elongation and volume expansion after cooking. Rice 11 1-10. https://doi.org/10.1186/s12284-018-0213-6
Sultana, S., Faruque, M., Islam, M.R. (2022). Rice grain quality parameters and determination tools: a review on the current developments and future prospects. International Journal of Food Properties 25 (1), 1063-1078. https://doi.org/10.1080/10942912.2022.2071295
Talekar, S., Praveena, M.V., Satish, R. (2022). Genetic diversity using principal component analysis and hierarchical cluster analysis in rice. Int J Plant Sci 17 (2), 191-196. https://doi.org/10.15740/HAS/IJPS/17.2/191-196
Thuy, N.P., Trai, N.N., Khoa, B.D., Thao, N.H.X., Phong, V.T., Thi, Q.V.C. (2023). Correlation and path analysis of association among yield, micronutrients, and protein content in rice accessions grown under aerobic condition from Karnataka, India. Plant breeding and biotechnology 11 (2), 117-129. https://doi.org/10.9787/PBB.2023.11.2.117
Xu, H., Xu, S., Xu, Y., Jiang, Y., Li, T., Zhang, X., Yang, J., Wang, L. (2024). Relationship between the physicochemical properties and amylose content of rice starch in rice varieties with the same genetic background. Journal of Cereal Science 118 103932. https://doi.org/10.1016/j.lwt.2026.119398
Yadi, R., Heravan, I.M., Heidari Sharifabad, H. (2021). Identifying the superior traits for selecting the ideotype of rice cultivars. Cereal Research Communications 49 475-484. https://doi.org/10.1007/s42976-020-00088-z
Yang, J., Zhang, X., Wang, D., Wu, J., Xu, H., Xiao, Y., Xie, H., Shi, W. (2024). The deterioration of starch physiochemical and minerals in high-quality indica rice under low-temperature stress during grain filling. Frontiers in Plant Science 14 1295003. https://doi.org/10.3389/fpls.2023.1295003
Zhao, D., Zhang, C., Li, Q., Liu, Q. (2022a). Genetic control of grain appearance quality in rice. Biotechnology Advances 60 108014. https://doi.org/10.1016/j.biotechadv.2022.108014
Zhao, T., Zhang, H., Chen, F., Tong, P., Cao, W., Jiang, Y. (2022b). Study on structural changes of starches with different amylose content during gelatinization process. Starch-Stärke 74 (7-8), 2100269. https://doi.org/10.1002/star.202100269