Phenotypic diversity of indigenous goats across three agroecological zones in southeastern Ethiopia
Kebede Tilahuna,b,*, Aberra Melessea, Simret Betshaa
a College of Agriculture, School of Animal and Range Sciences, Hawassa University, P.O. Box 05, Hawassa, Ethiopia
b College of Agriculture, Department of Animal Science, Kebridehar University, P.O. Box 250, Kebridehar, Ethiopia
* Corresponding author: Kebede Tilahun (keedetilahun2000@gmail.com)
Abstract: The study aimed to evaluate the phenotypic diversity of indigenous goats reared in three agroecological zones of southeastern Ethiopia based on their morphometric traits. Multi-stage purposive and random sampling methods were applied to select the study areas and the goats. A total of 601 (463 female and 138 male) goats were randomly sampled, measured and described using 16 morphometric traits. Data collected were analyzed using univariate and multivariate statistical procedures in SAS version 9.4. Univariate analysis revealed significant variations of all morphometric traits across the agroecological zones. The goats in the lowland agroecological zone were larger (p < 0.05) than those reared in other agroecological zones. Goats reared in the highland agroecological zone were smaller and lighter in size, while those from the midland agroecological zone showed intermediate body size and weight. Multivariate analysis (i.e. canonical discriminant and cluster analysis) showed that the goats in the three agroecological zones were different in terms of their morphology, with the largest Mahalanobis distance (42.3%) being observed between lowland and highland goat populations. Discriminant analysis correctly assigned 86% of goats to their source populations. These results indicate the existence of morphological diversity among goat populations in the three agroecological zones of southeastern Ethiopia and suggest the need to develop conservation and breeding strategies aimed at retaining the observed diversity at the phenotypic level. Further studies using molecular tools are needed to elucidate the observed diversity at the phenotypic level and to design appropriate strategies for the sustainable management of these animal genetic resources.
Keywords: Agroecological zone, conservation, diversity, goat, morphometric trait, multivariate analysis
Introduction
Genetic diversity of livestock species across various environments is vital for their long-term viability and resilience in the face of climate change (Kuthu et al, 2022) and helps animals to adapt to changing environments and demands (Razgour et al, 2019; Velado-Alonso et al, 2020; Shuma et al, 2024). It provides a baseline for survival, productivity and genetic improvement of animal population in diverse climates (Oladepo et al, 2017; Ganiyu et al, 2018). Genetic diversity in indigenous populations is essential for the sustainable utilization and conservation of resources (Velado-Alonso et al, 2020; Habimana et al, 2021; Sheriff et al, 2021). Morphological variation among indigenous goats has important economic and socio-cultural value (Getaneh et al, 2022; Melesse et al, 2022) and is a good indicator of the selection regime and history of the breed (Mdladla et al, 2017). Indigenous breeds are an invaluable and irreplaceable source of genetic diversity (Maksimovic et al, 2023). Proper characteriztion at phenotypic and genetic levels is essential for their improvement and conservation (Whannou et al, 2021; Worku and Melesse, 2021; Okoro et al, 2023).
Characterization involves three types of information, namely phenotypic, genetic and historical (FAO, 2012). Phenotypic characterization provides essential information for proper management of farm animal genetic resources at local, national, regional and global levels (FAO, 2012) and is important to describe the uniqueness of animal genetic resources (Sako et al, 2024). Morphological characterization includes both the description of qualitative and quantitative characteristics (Deribe et al, 2021; Kitila et al, 2025), and it is the first step in identifying unique traits (Kandoussi et al, 2021; Melesse et al, 2022) and population structure, especially in resource-poor areas, where advanced genomic tools are limited (Bousbia et al, 2021; Nguluma et al, 2022; Akounda et al, 2023). Morphometric traits specifically serve as reliable indicators for breed identification and the productivity potential of livestock resources (Aliyu et al, 2021; Elzarei et al, 2023; Selvan et al, 2023). They determine the growth, development, shape and proportion of animals, and have a strong correlation with production traits (Ghahri et al, 2019; Chokoe et al, 2020; Muhammad et al, 2021; Kuthu et al, 2022; Kitila et al, 2025). For example, traits such as body weight, body height and chest girth are direct indicators of body size and are important growth determinants that affect economic viability (Valsalan et al, 2020). These traits have moderate to high heritability, making them suitable for selection in genetic improvement programmes (Sarma et al, 2019) and have diverse implications in designing genetic improvement programs (Melesse et al, 2022; Akounda et al, 2023).
Ethiopia is endowed with large and diversified goat breeds/populations (Shuma et al, 2024), which are raised in different production systems and agroecological zones. These goat populations exhibit significant phenotypic and genetic diversity resulting from environmental pressure and traditional breeding practices (Tarekegn et al, 2021). The existence of such large goat populations, coupled with their diverse agroecological conditions, production and husbandry systems, justifies the need for characterization. A lack of characterization can lead to improper utilization, indiscriminate crossbreeding and dilution, and replacement of a local population without knowing their unique genetic merit. These phenomena result in a loss of genetic diversity and population uniformity, which has become a global concern (Arsoy et al, 2024). This is especially true in developing nations, where indigenous breeds are replaced at an alarming rate by high-producing exotic breeds irrespective of their genetic potential. Thus, the findings of characterization studies would enable breeders and policymakers to take appropriate actions to safeguard local animal genetic resources from genetic erosion through adulteration and uncontrolled crossbreeding activities.
The goat population distributed in the southeastern part of Ethiopia is commonly referred to as the Arsi-Bale breed/type. They are reared in the highlands of Arsi and Bale and in the lowlands of the Sidama region. Different attempts have been made to characterize this goat population. For example, Hankamo et al (2020) found the existence of remarkable differences among the goats in the Sidama region. Muluneh and Tadesse (2022), in their study, detected variation between goats in two districts of southern Ethiopia. Abebe and Korato (2020) detected phenotypic variation among the goats in the Arsi zone. In addition, Guyo et al (2023) found the divergence of goats reared in three agroecological zones of the Bale zone. The inconsistency and divergence of the findings of these authors suggest that a goat population is underrepresented. In addition, none of these authors have considered agroecological zones and multivariate techniques to analyze the morphometrical data except Guyo et al (2023). Furthermore, there is considerable population movement between the Arsi-Bale and nearby goat populations, which could lead to phenotypic differences and genetic adulterations of goats reared in these areas (Worku and Melesse, 2021). As a result, characterizing and evaluating genetic diversity and population structure is imperative to design suitable breeding programmes, allowing sustained genetic improvement and conservation of the goat populations in their native environments. Therefore, this study aimed to characterize the phenotypic diversity of local goat populations reared in three agroecological zones to generate baseline data for designing sustainable genetic improvement strategies of local goat populations in the study areas.
Materials and methods
Study area
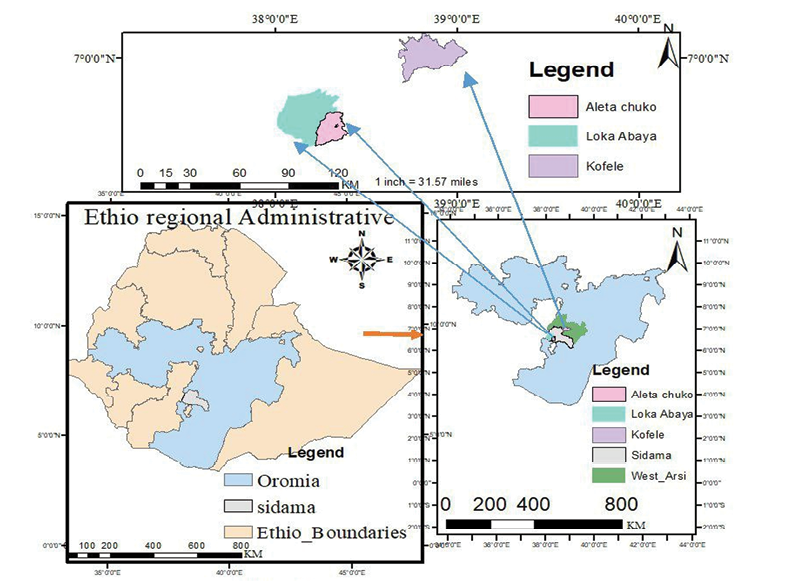
This study was conducted in three agroecological zones of southeastern Ethiopia, namely lowland, midland and highland. These agroecological zones were identified in two major regions, the Sidama and Oromia regions. The midland and lowland agroecological zones were sampled from the Sidama region, while the highland zone was considered from the West Arsi zone of the Oromia region (Figure 1). The description of agroecological zones is summarized in Table 1.
Sampling procedure
Secondary data on goat distribution and climate were obtained from zonal livestock and fishery development offices. These data were used for the selection of the three agroecological zones considered in this study according to their gradient and the abundance of goats. Multi-stage purposive sampling methods were employed to select districts, kebeles (i.e. the smallest administrative unit in Ethiopia), and households. Loka Abaya, Aleta Chucko, and Kofele districts were specifically selected to represent the lowland, midland and highland agroecological zones, respectively. In these nine rural kebeles, a total of 252 households (76 from lowland, 84 from midland and 92 from highland, agroecological zones) were selected based on the size of their goat herds. From each of these households, two to three goats were sampled, and morphometric measurements were taken. The sample size was then estimated using Yamane’s (1967) formula described as follows:
where n is the sample size, N is the population size (108,600 in the lowland, 36,439 in the midland, and 3,718 in the highland agroecological zones), and e is the level of precision (7%). Accordingly, a total of 601 adult goats (i.e. 204 from lowland, 203 from midland and 194 from highland agroecological zones) with at least one pair of permanent incisors were randomly sampled.
Table 1. Description of the agroecological zones with coordinates and climates. Source: Hankamo et al, 2020; Worku and Melesse 2021; Chebo et al, 2023.
|
Agroecological zones |
District |
Latitude |
Longitude |
Average temperature (°C) |
Rainfall |
Altitude (m a.s.l.) |
|
Highland |
Kofele |
06°50’–07°09’ N |
38°38’–39°04’ E |
5–17 |
1,500–2,100 |
2,000–3,050 |
|
Midland |
Aleta Chuko |
6°46'–7°10' N |
38°04’–38°24’ E |
18–28 |
1,200–1,400 |
1,400–2,300 |
|
Lowland |
Loka Abaya |
6°42’–7°83’ N |
37°92– 39°14’ E |
10–32 |
900–1,400 |
1,001–2,000 |
Morphometric data collection
Morphometric data were collected between October 2023 and February 2024 in the three agroecological zones. Sixteen morphometric traits were recorded from 601 goats of both sexes (Supplemental Table 1). Measurements were as follows: body weight (BW), taken using a suspended balance; chest girth (CG), measured as a circumference of the chest just behind the forelegs; rump length (RL), as distance from hip (Tuber coxa) to the pin (Tuber ischi); rump width (RW), as horizontal distance between the extreme lateral points of the hook bone of pelvis; rump height (RH), measured as a distance from the ground to the highest point of rump; height at withers (HW), as a distance from the ground to the withers; body length (BL), measured as the distance from the point of shoulder to the pin bone; chest width (CW), as the width of the chest between the briskets; paunch girth (PG), as the circumference of the belly at the centre; ear length (EL), measured from the base to the tip of the ear; ear width (EW), measured from one tip of the ear to the other across the centre of the ear; head length (HdL), the length of front head from middle of top head between horn site to end of mouth; head width (HdW), as the width of front head from the base of left and right ear; chest depth (CD), the vertical distance from sternum (bottom brisket surface) to withers; shoulder width (SW), as the distance between the tip of two withers; and fore cannon circumference (FCC), measured as a circumference at the narrowest part of the bone jointing fetlock and knee joint. The body weight of the goat was measured using a 50kg portable digital scale, while linear body measurement traits were measured using plastic tape graduated in cm. All measurements were taken early in the morning, before the goats were released for feeding. Measurements were taken while the animals were standing on a flat surface and held by one person to reduce measurement error. Pregnant females were excluded from the measurements.
Statistical analysis
Univariate analysis
The morphometric data were analyzed using the General Linear Model Procedures of the Statistical Analysis System (PROC GLM of SAS version 9.4, 2016) to identify the effect of agroecological zone on morphometric traits. When the F-test declared significant, multiple least square means were compared using the Tukey-Kramer test. The univariate model used to analyze the effect of an agroecological zone is as follows:
Yi = µ+ Ai + ei
Yi = response of the observed dependent variables
µ= the overall mean
Ai = the fixed effect of ith agroecological zones (i = highland, midland and lowland)
ei = residual error
Multivariate analysis
The stepwise regression procedure was conducted on data collected from female and male goats separately to identify the best-fitted regression model for the prediction of live body weight of male and female goats separately. The identified model was then plotted to generate a graph using the procedure of linear regression. The stepwise multiple linear regression was carried out to predict the body weight from linear traits using the model:
Yj = β0 + β1 X1 + β2 X2 + β3 X3 … β16 X16 + ej
Where:
Yj = the response variable (BW)
β0 = the intercept
X1, X2… X16 = linear traits
β1, β2… β16 = regression coefficients of the X1, X2… X16
ej = residual error
Sixteen morphometric traits were subjected to the stepwise discriminant analysis (PROC STEPDISC) to identify the morphometric traits that have high discriminating power. However, the analyses have determined that all morphometric traits have discriminating power. The procedure of cluster analysis (PROC CLUSTER) was applied to construct a dendrogram using the average linkage method to cluster the goat populations into their morphometric similarity. Moreover, the canonical discriminant analysis (PROC CANDISC) was applied to determine the Mahalanobis distance, univariate and multivariate statistics, and canonical variables. The TEMPLATE and SGRENDER procedures were used to create a plot of the first two canonical variables in a scatter graph for visual interpretation. Furthermore, the quadratic discriminant analysis (PROC DISCRIM) was conducted to determine the probabilities of classifying individual animals in their actual source population.
Results
Univariate analysis
Agroecological zone had a considerable effect (p < 0.05) on all morphometric traits except PG and CW (Table 2). The lowland goats showed significantly higher BW and height traits (p < 0.001) than those of their midland and highland counterparts. The midland goats had higher HdL than those reared in the other two agroecological zones. The goats in the highland agroecology had a comparatively smaller height and EL than those of the lowland and midland agroecological zones (Table 2). Relatively lower coefficients of variation (4.94–15.4%) were observed in goats reared in the highland zone, while larger CV values were observed for those of the midland (7.41–21.8%) and lowland (7.20–22.2%) agroecological zones.
Table 2. Least squares means (± SE) and coefficients of variation for body weight (kg) and linear morphometric traits (cm) of goats reared across three agroecological zones. Least square means within a row with different superscripts are significantly different (p < 0.05); CV, coefficients of variations; N, number of goats; BW, body weight; CG, chest girth; HW, height at withers; BL, body length; RH, rump length; PG, paunch girth; CW, chest width; CD, chest depth; SW, shoulder width; RL, rump length; RH, rump height; HdL, head length; HdW, head width; EL, ear length; EW, ear width and FCC, fore canon circumference.
|
Traits |
Highland (N = 194) |
CV |
Midland (N = 203) |
CV |
Lowland (N = 204) |
CV |
P values |
|
BW |
25.6b±0.45 |
15.4 |
27.2b± 0.31 |
21.8 |
28.3a±0.32 |
22.2 |
<.001 |
|
CG |
71.6a±0.49 |
6.94 |
70.8b±.0.34 |
8.59 |
72.1a± 0.35 |
9.64 |
0.020 |
|
HW |
63.9b ±0.40 |
5.28 |
66.6a±0.27 |
7.49 |
67.3a± 0.29 |
7.78 |
<.001 |
|
BL |
63.4b±0.45 |
7.20 |
64.2b ± 0.31 |
8.21 |
65.5a±0.32 |
8.82 |
0.001 |
|
RH |
64.7b±0.37 |
4.94 |
66.7a ± 0.25 |
6.93 |
66.9a±0. 26 |
6.61 |
<.001 |
|
PG |
80.0±0.74 |
8.97 |
81.2± 0.51 |
11.6 |
79.9±0.53 |
10.3 |
0.133 |
|
CW |
18.5± 0.21 |
11.2 |
18.2± 0.21 |
12.7 |
18.1±0.15 |
13.1 |
0.190 |
|
CD |
30.9a± 0.22 |
7.77 |
31.0a± 0.15 |
7.62 |
30.3b± 0.16 |
9.91 |
0.003 |
|
SW |
18.8a ± 0.17 |
7.89 |
18.9a± 0.12 |
10.5 |
17.8b± 0.12 |
12.5 |
<.001 |
|
RL |
20.0 b± 0.15 |
7.72 |
19.9b± 0.10 |
9.49 |
20.5a±0.11 |
8.62 |
<.0001 |
|
RH |
13.9b± 0.12 |
10.4 |
13.7b± 0.08 |
9.85 |
14.4a±0.09 |
11.1 |
<.001 |
|
HdL |
20.5b± 0.14 |
10.1 |
21.3a ± 0.10 |
7.54 |
20.9b± 0.10 |
7.20 |
<.001 |
|
HdW |
15.0a ± 0.15 |
12.1 |
14.5b ± 0.10 |
11.4 |
14.4b± 0.11 |
14.3 |
0.001 |
|
EL |
12.7c± 0.13 |
6.75 |
13.5b± 0.09 |
9.26 |
14.3a± 0.09 |
9.26 |
<.001 |
|
EW |
7.4a± 0.06 |
6.95 |
7.5a ± 0.04 |
7.41 |
7.2b±0.05 |
8.30 |
<.001 |
|
FCC |
7.6b±0.06 |
7.11 |
7.7b± 0.04 |
10.1 |
7.9a±0.04 |
10.3 |
<.001 |
Multivariate analyses
Prediction of live body weight
The correlation analysis has shown a strong association between CG and BW, indicating that the live weight of female and male goats could be best estimated from their CG. The equation to estimate live body weight of female and male goats is indicated in Figures 2A and B, respectively. Likewise, CG could be also used to estimate live weight in combined female and male data (Supplemental Figure 1).
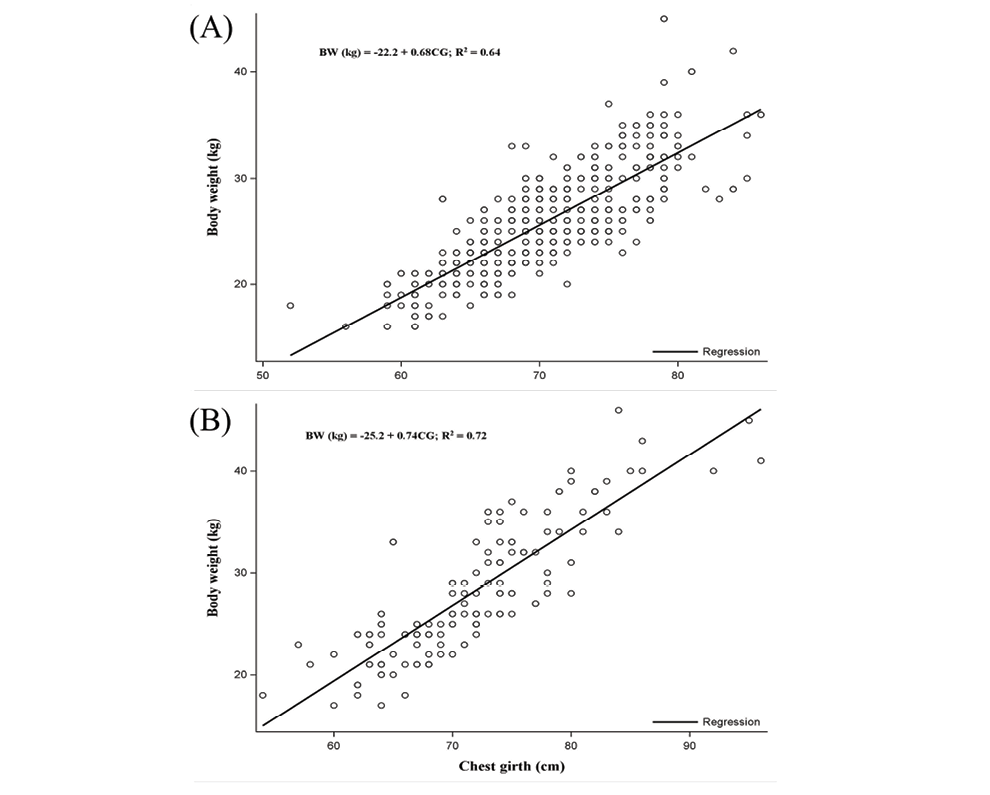
Figure 2. Linear regression plots showing the prediction equation of live body weight of female (A) and male goats (B) using morphometric traits. BW, body weight (kg); CG, chest girth (cm).
Canonical discriminant analysis
All the squared Mahalanobis distances based on morphometric traits were significant (p < 0.001), and the longest (42.3) were observed between highland and lowland agroecological zones (Table 3). Univariate analysis (ANOVA) revealed that all morphometric traits significantly (p < 0.05) contributed to the total variation, except body weight and body length (Supplemental Table 2).
As shown in Table 4, all multivariate statistics were highly significant (p < 0.001) between the three agroecological zones. The Wilk’s lambda showed 69% of the variability was due to variations between populations rather than within a population (Table 4).
Table 3. Mahalanobis distance between goat populations reared in the three agroecological zones
|
Agroecological zones |
Midland |
Highland |
Lowland |
|
Midland |
0 |
17.6 |
26.1 |
|
Highland |
- |
0 |
42.3 |
|
Lowland |
- |
- |
0 |
Table 4. Multivariate statistics and F approximation of goat populations in the three agroecological zones
|
Statistic |
Value |
F Value |
Num DF |
Den DF |
Pr > F |
|---|---|---|---|---|---|
|
Wilks' Lambda |
0.31 |
26.9 |
34 |
1,156 |
<.0001 |
|
Pillai's Trace |
0.85 |
25.3 |
34 |
1,158 |
<.0001 |
|
Hotelling-Lawley Trace |
1.69 |
28.6 |
34 |
1,035.8 |
<.0001 |
|
Roy's Greatest Root |
1.27 |
43.3 |
17 |
579 |
<.0001 |
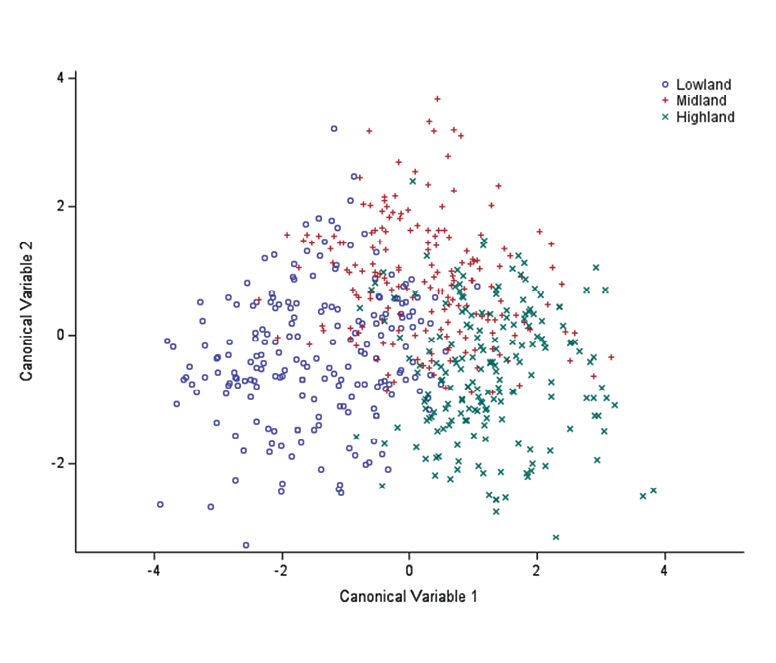
Both CAN1 and CAN2 explained 75% and 25% of the total variance, respectively (Table 5). The highest (74%) canonical correlation was observed for CAN1. The total standardized canonical coefficients indicate that CD and SW significantly contributed to CAN1, while HdL and PG contributed to CAN2 (Supplemental Table 3). Shoulder width and CD were the most important discriminating traits in CAN1, while HdL and RH were for CAN2 (Supplemental Table 4).
Figure 3 showed that CAN1 was the best at discriminating between highland and lowland goat populations, while CAN2 slightly differentiate the midland goats from the other two populations but not strongly. The distribution of the goat populations in the three agroecological zones was clear and apparent. Accordingly, the highland goat populations are distributed to the right side of the graph to CAN1 while those in the lowland were clustered to the left side of the graph to CAN1. The midland goat population occupied the centre and they overlap with both highland and lowland agroecological zones.
Table 5. Summary of canonical correlation, eigenvalue and likelihood ratio. CAN1, canonical variable 1; CAN2, canonical variable 2.
|
Function |
Canonical correlation |
Eigenvalues |
Likelihood ratio |
Approximate F-value |
Pr > F |
||
|
Eigenvalue |
Proportion |
Cumulative |
|||||
|
CAN 1 |
0.74 |
1.27 |
0.75 |
0.75 |
0.31 |
26.9 |
<.0001 |
|
CAN 2 |
0.53 |
0.41 |
0.25 |
1.00 |
0.71 |
15.0 |
<.0001 |
Figure 3. Canonical discriminant plot showing group discrimination among agroecological zones
Cluster analysis
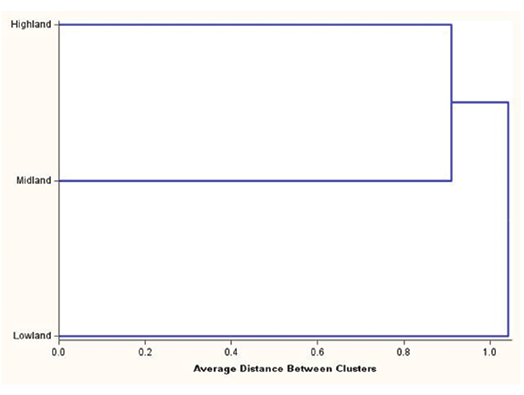
As presented in Figure 4, the dendrogram clearly clustered the goat population of the lowland agroecological zone separately as a distinct group, while those reared in the highland and midland agroecological zones were closely clustered as subclusters.
Figure 4. Dendrogram showing classification of the goat population in the three agroecological zones
Discriminant analysis
The quadratic discriminant analysis indicated that 85.6% of the goat populations in the midland agroecological zone were accurately classified into their source population while the rest (14.4%) were misclassified into highland and lowland (Table 6). About 88% of the lowland populations were correctly assigned to their source population, while about 12% of them were misclassified to the other agroecological zones. The accuracy of classification was tested with re-substitution and cross-validation options, and the classification was successful with an overall rate of 78% (Table 6).
Table 6. Percentages and numbers of individuals classified according to their source of origin based on morphometric traits.
|
Agroecological zones |
Midland |
Highland |
Lowland |
Total |
|
Midland |
85.6% (173) |
5.9% (12) |
8.4% (17) |
100% (202) |
|
Highland |
12.5% (24) |
84.9% (163) |
2.6% (5) |
100% (192) |
|
Lowland |
9.9% (20) |
2.5% (5) |
87.6% (178) |
100% (203) |
|
Error count rate |
0.14 |
0.15 |
0.12 |
0.14 |
|
Cross validation |
||||
|
Midland |
76.2% (154) |
9.9% (20) |
13.9% (28) |
100% (202) |
|
Highland |
18.8% (36) |
78.1% (150) |
3.1% (6) |
100% (192) |
|
Lowland |
16.8% (34) |
4.9% (10) |
78.3% (159) |
100% (203) |
|
Error count rate |
0.24 |
0.22 |
0.22 |
0.22 |
Discussion
Univariate analysis
Assessing the phenotypic diversity of indigenous goat populations is crucial for genetic improvement and conservation purposes. The phenotypic difference among the goat populations is due to variation in agroecological zone as a result of variability in climate and vegetation. The variation in the body size of animals could be affected by management and environmental factors (Nantongo et al, 2024), nutritional variation (Monau et al, 2018; Getahun et al, 2020), availability of feed and its type (Ofori et al, 2021), variation in rainfall pattern, vegetation and diurnal temperature (Ntonga et al, 2025), and low artificial selection intensity (Melesse et al, 2022). Morphometric traits are associated with productivity and provide important information on the suitability of animals for selection (Bousbia et al, 2021; Tenagne et al, 2023). The phenotypic variability within indigenous goats indicates ecological adaptation and is important for selection and breeding programme design tailored to specific agroecological zones and production systems. The observed high height in goats reared in the lowland and midland agroecological zones is in accordance with the results of Guyo et al (2023), who reported similar findings. The larger FCC in the lowland goat population is an indication of good skeletal development to carry their body mass while browsing in mountainous terrain and is consistent with the reports of Dea et al (2019) for the lowland agroecological zone of the Gamo-Gofa zone. The observed FCC in this study is also in line with that of Maksimović et al (2023), who reported comparable results for Serbian White and Balkan goat breeds. The long ear of the lowland goat indicates its adaptation to the hot lowland areas, in which it helps to dissipate excess heat during hot periods.
On the other hand, the smallest HW and RH observed in the highland goat population indicate that their smaller body mass is close to the ground, which might be beneficial to adapt to the cold environment. The lowest body measurements observed in the highland goat population might be attributed to a feeding regime affected by cold stress, the shrinkage of grazing area (Guyo et al, 2023) and the absence of browsing pasture. The smaller RL and RW in midland goats may indicate their slimmer body and lower meat production potential as compared with the two others. The observed difference between the three agroecological zones may result from both environmental influences and underlying genetic variations due to long-term adaptation to the respective production environments. The variability in morphometric traits among agroecological zones indicates the adaptive potential of indigenous goats and suggests their ability to survive in diverse environments.
On the other hand, based on their HW, the goat populations in the three agroecological zones could be classified into two groups as larger and smaller breed types. Goats having HW over 65cm are considered a larger breed type, while those between 51 and 65cm are classified as smaller breed types (Laouadi et al, 2020). In the current study, the HW of 66.6cm and 67.3cm observed in the midland and lowland goat populations indicates that they are larger breed types. On the other hand, goats reared in the highland agroecological zone had comparatively lower HW (63.9cm) and could be classified as smaller breed types (Laouadi et al, 2020). The CV for different traits showed relatively low variability, indicating that the goat population within each agroecological zone was characterized by possessing uniform morphometrical traits. The CV observed in the highland goats is comparable with those reported for Hararghe highland goats (Takele et al, 2021), Arsi-Bale goats (Guyo et al, 2023), central Tigray goats (Birhaniea et al, 2019), and East Gojjam goats (Getahun et al, 2020). In contrast, lower CV values were reported for indigenous goats reared in five administrative zones of Ethiopia (Melesse et al, 2022).
Multivariate analysis
Multivariate analysis of morphometric traits is effective in determining variations at phenotypic and genetic levels (Rotimi et al, 2020; Melesse et al, 2022) and is suitable for exploring breed structure and diversity (Selvan et al, 2023). Among morphometric traits, BW is an important economic trait in determining growth performance, market price and management aspects, including drug dosage in different classes of age groups. However, measuring the live weight of animals in rural areas of Africa is quite challenging (Vanvanhossou et al, 2018). This difficulty arises mainly due to the lack of adequate measuring scales under field conditions, highlighting the need for alternative methods of estimating animal weight. Purchasing weighing scales for BW measurement is much more expensive than obtaining a textile meter tape for measuring linear morphometric traits. Therefore, linear measurements can serve as indirect indicators of live weight and carcass traits (Mebratie et al, 2022). They also play a vital role in effective management and selection of replacement stock (Takele et al, 2021; Getaneh et al, 2022; Kuthu et al, 2022). For example, studies have shown that CG and BL are highly correlated with live BW in various goat breeds (Mebratie et al, 2022). Therefore, in areas where weighing equipment is not affordable, predicting the BW of goats from linear traits is not only practical but also essential for improving livestock management and supporting rural livelihoods.
In the current study, the CG was identified as a suitable variable to predict the BW of goats, in line with the reports of Hankamo et al (2020), Tade et al (2021), Takele et al (2021), and Tyasi and Tada (2023). Dea et al (2019) reported the estimation of BW from the combinations of HW, BL and CG. However, the inclusion of many traits to estimate the live BW of farm animals is impractical since measuring more than one linear morphometric trait under farm conditions is time-consuming and increases measurement error. Therefore, the current study concurs with previous findings, confirming that estimating BW from a single linear morphometric trait, such as CG, will be a viable option when there is no measuring scale available in the farmer’s conditions. Moreover, CG is a good predictor of BW due to its contribution to muscle and bone development (Okpeku et al, 2011). In addition, from a field point of view, CG is less affected by the posture and restraints of animals and is easy to measure with minimum error compared to other morphometric traits.
Canonical discriminant analysis is a statistical tool which has been increasingly used to reduce the dimensionality of data (Macena et al, 2024) and identifies the linear combination of multiple traits that provide maximum correlation between groups (Takele et al, 2021; Melesse et al, 2022). The goal of such analysis is to reduce within-population variation and maximize between-group variations, which allows understanding of genetic similarity and diversity of the studied animal populations. The values of the two CANs in the present study were comparable with the findings of Tade et al (2021) who reported that CAN1 and CAN2 explained 70% and 30% of total variation in south Gondar goats, respectively, in accordance with the current findings. The significant difference between the two canonical variables in this study aligns with previous reports on various indigenous goat populations (Takele et al, 2021; Melesse et al, 2022; Guyo et al, 2023). In contrast, Selolo et al (2015) found that only the first canonical variable was significant. CD and SW showed the highest loading values, making them key traits for differentiating goat populations. These observations are consistent with those reported by Al-Atiyat et al (2024). The value of canonical correlation (0.74) for CAN1 indicates the strength of the function to discriminate the goats reared in the three agroecological zones. This indicates that the variables associated with CAN1, such as CD and SW, are most important variables to effectively discriminate the studied goat populations. In line with this finding, this strong correlation of CAN1 was reported by Ofori et al (2021), Ali et al (2024), Takele et al (2021) and Guyo et al (2023).
The Mahalanobis distance expresses the magnitude of variations at the phenotypic level among animal breeds/populations or groups (Dauda et al, 2018; Maksimović et al, 2023). The observed significant Mahalanobis distance indicates that the goat populations reared in three agroecological zones are morphologically different. The largest distance between the highland and lowland goat populations might be associated with geographical isolations between these two goat populations and management differences practiced by the farming communities of different agroecological zones (Ofori et al, 2021). The shortest distance between the highland and midland goats may indicate that these goats are closely related in the expression of their morphometric traits, which might have resulted in admixture and gene flow in both directions. The observed Mahalanobis distance values in this study closely agree with those reported for Boer and red Sokoto goats (Muhammad et al, 2021), while they were higher than those reported for Hararghe highland goats (Takele et al, 2021). On the other hand, higher values than those observed in the current study were reported for different indigenous goat breeds reared in Indonesia (Depison et al, 2020), Serbia (Maksimović et al, 2023) and Ghana (Ofori et al, 2021). The cluster analysis showed that the highland and midland goat populations were closely clustered, which might be due to their geographical proximity, leading to potential gene flow between these two goat populations. The Wilk’s lambda is the proportion of total variability not explained by the discriminator variables between populations (Takele et al, 2021). The value of Wilk’s lambda in the current study is 31%, which indicates that 69% of the variability in the discriminating traits was due to variation between populations rather than within populations. These results are comparable with those reported by Guyo et al (2023) for Arsi-Bale goats.
The quadratic discriminant analysis showed that 86% of the total goat populations were correctly assigned to their original source, suggesting the existence of more similarity within the goat population than across the populations. A higher success rate of classification was reported for different indigenous goats of Ethiopia (Zergaw et al, 2017; Melesse et al, 2022; Guyo et al, 2023). On the other hand, a lower classification rate was reported for Hararghe highland goats (Takele et al, 2021), South Gondar goats (Tade et al, 2021) and West African Dwarf goats (Ofori et al, 2021). The observed inconsistency between classification and cross-validation may suggest the existence of a relatively heterogeneous goat population as a result of admixture and migration of animals (Takele et al, 2021; Melesse et al, 2022). The higher misclassification rate observed for goat populations raised in the midland agroecological zones might have been caused by gene flow from goats of lowland and highland agroecological zones through marketing channels and migration due to various reasons (Belayhun et al, 2023).
Conclusion
This study showed the existence of significant morphometric diversity among indigenous goat populations reared across the three agroecological zones of southeastern Ethiopia. These findings provide a foundation for designing sustainable breeding and conservation strategies to retain the observed morphometric uniformity within the population of each agroecological zone. Further studies should integrate genomic tools to validate the observed phenotypic diversities among the three agroecological zones.
Supplemental Table 1. Morphometric traits recoded
Supplemental Table 2. Univariate test statistics to identify the relative importance of each morphometric trait to discriminate the goats’ population in the three agroecologies.
Supplemental Table 3. Total-sample standardized canonical coefficients.
Supplemental Table 4. Total canonical structure.
Supplemental Figure 1. Graphical presentation of the regression equation for the estimation of male and female goats using the combined data.
Acknowledgments
The authors are grateful to Hawassa University, Office of Vice President for Research and Technology Transfer (VPRTT) for the financial support to undertake the study. We are thankful to households and development agents who assisted during data collection.
Author contributions
All authors have contributed to the conception and design of the study. Kebede Tilahun participated in data collection, data analysis and interpretation, writing the first draft and revision. Aberra Melesse contributed data analysis and interpretation and revision. Simret Betsha contributed by reviewing and editing the manuscript. All authors have read and approved the manuscript.
Conflict of interest statement
The authors declare that they have no conflict of interest.
Ethics statement
The study was reviewed and approved by the Research Ethics Review Committee (RERC) of Hawassa University (Reference No: REC 016/23).
References
Abebe, T., Korato, M. (2020). Phenotypic characterization of indigenous goats in east Arsi Zone, Oromia regional state. Global Journal of Animal Scientific Research 8 (1), 75–92. url: http://www.gjasr.com/index.php/GJASR/article/view/36.
Akounda, B., Ouédraogo, D., Soudré, A., Burger, P.A., Rosen, B.D., Van Tassell, C.P., Sölkner, J. (2023). Morphometric characterization of local goat breeds in two agroecological zones of Burkina Faso, West Africa. Animals 13, 1931.doi: https://doi.org/10.3390/ani13121931
Al-Atiyat, R. M., Suliman, G. M., Abu-Alruz, K., Al-Zyoud, F., Mamkagh, A., El-Waziry, A. M., Khan, R. U. (2024). Multivariate discriminant analysis on differentiating sheep breeds based on live body and carcass measurements. Pakistan Journal of Zoology 56(2). doi: https://dx.doi.org/10.17582/journal.pjz/20230816022706
Ali, S.S., Kuralkar, S.V., Kanadkhedkar, H.L., Bankar, P. S., Kataria, R. S., Vohra, V. (2024). Discriminant analysis reveals differences in breed structure in river buffaloes of Maharashtra (India).Tropical Animal Health and Production 56, 38. doi: https://doi.org/10.1007/s11250-024-03885-4
Aliyu, A. M., Rotimi, E. A., Galadima, N. M. (2021). Effect of age and sex on morphometric measurements of Sahelian goats in Faskari local government area of Katsina state. FUDMA Journal of Sciences 5 (1), 11-15. doi: https://doi.org/10.33003/fjs-2021-0501-507
Arsoy, D., Abdourhamane, I. M., İsfendiyaroğlu, M. (2024). Phenotypic characterization of indigenous Cyprus native hair goat breeds using quantitative and qualitative trait analysis. Revista Cientifica de la Facultade de Veterinaria, 34(1).
Belayhun, T., Getachew, T., Mustefa, A., Engdawork, A. (2023). Phenotypic characterization of goat populations of North Shoa and South Wollo zones in Amhara region. Ecological Genetics and Genomics 27,100169.doi: https://doi.org/10.1016/j.egg.2023.100169
Birhaniea, M., Alemayehu, K., Mekuriaw, G. (2019). Morphological characterization of goat populations in central zone of Tigray. Tropical Animal Science Journal 42(2), 81–89. doi: https://doi.org/10.5398/tasj.2019.42.2.81
Bousbia, A., Boudalia, S., Gueroui, Y., Hadded, K., Bouzaoui, A., Kiboub, D., Symeon, G. (2021). Use of multivariate analysis as a tool in the morphological characterization of the main indigenous bovine ecotypes in northeastern Algeria. PLoS ONE 16(7), e0255153. doi: https://doi.org/10.1371/journal.pone.0255153
Chebo, C., Melesse, A., Betsha, S. (2023). Morphological descriptors of indigenous chickens: as a selection guide. Journal of Applied Animal Research, 51(1), 729-742. doi: https://doi.org/10.1080/09712119.2023.2274956.
Chokoe, T. C., Matelele, T. C., Maqhashu, A., Ramukhithi, F. V., Mphahlele, T. D., Mpofu, T. J., Nephawe, K. A., Mtileni, B. (2020). Phenotypic diversity of South African indigenous goat population in selected rural areas. American Journal of Animal and Veterinary Sciences 15(1). doi: https://doi.org/10.3844/ajavsp.2020.59.66
Dauda, A., Abbaya, H.Y., Ebegbulem, V.N. (2018). Application of multifactorial discriminant analysis of morphostructural differentiation of sheep. Genetics and Genetic Engineering 2(2), 11-16.
Dea, D., Melesse, A., Mekasha, Y. (2019). Application of morphometric traits and body indices in assessing the type and function of local goats reared in two districts of Gamo-Gofa zone. Ethiopian Journal of Animal Production 19(1), 73–90.
Depison, D., Putra, W.P.B., Gushairiyanto, G., Alwi, Y., Suryani, H. (2020). Morphometric characterization of Kacang goats raised in lowland and highland areas of Jambi Province, Indonesia. Journal of Advanced Veterinary and Animal Research 7(4), 734–743. doi: https://doi.org/10.5455/javar.2020.g475
Deribe, B., Beyene, D., Dagne, K., Getachew, T., Gizaw, S., Abebe, A. (2021). Morphological diversity of north eastern fat-tailed and northwestern thin-tailed indigenous sheep breeds of Ethiopia. Heliyon, 7: 1-8. doi: https://doi.org/10.1016/j.heliyon.2021.e07472
Elzarei, M.F., Alhasyani, M.S., Aloufi, A.A., Mousa, E.F. (2023). Phenotypic characterization of indigenous sheep breeds in Saudi Arabia. Journal of Agricultural Science 15(8), 16–22. doi: https://doi.org/10.5539/jas.v15n8p16
FAO. (2012). Food and Agricultural Organization. Phenotypic characterization of animal genetic resources. url: https://www.fao.org/3/a1404e/a1404e.pdf.
Ganiyu, O., Osaiyuwu, O. H., Akinyemi, M. O., Salako, E. A. (2018). Genetic relationship among indigenous goat populations in Nigeria based on cellulose acetate electrophoresis systems. Scientific Papers Animal Science and Biotechnologies 51(2), 55-55.
Getahun, S., Ahmed, S., Zemene, W. (2020). Morphometric characterization of indigenous goats in East Gojjam zone, Amhara region, Ethiopia. International Journal of Advanced Research in Biological Sciences 7, 47-62. url: https://ijarbs.com/pdfcopy/2020/feb2020/ijarbs5.pdf
Getaneh, M., Taye, M., Kebede, D. (2022). Conformation trait characterization of indigenous goats in selected districts of East Gojjam zone, Amhara region, Ethiopia. Journal of Applied Animal Research 50(1), 225–238. doi: https://doi.org/10.1080/09712119.2022.2058516
Ghahri, B., Alijani, S., Rafat, S. A., Nabavi, R., Kia, H. D. (2019). Genetic appraisal of growth traits in Iranian native Ghezel sheep using random regression models. Turkish Journal of Veterinary and Animal Sciences 43(3), 372-379. doi: https://doi.org/10.3906/vet-1704-73
Guyo, M., Melesse, A., Taye, M. (2023). Multivariate analysis of morphometric traits revealed phenotypic diversity of Arsi-Bale goats reared in Bale eco-regions, Ethiopia. Agriculture Conspectus Scientificus 88(4), 325-335.url: https://hrcak.srce.hr/311921
Habimana, R., Ngeno, K., Mahoro, J., Ntawubizi, M., Shumbusho, F., Manzi, M., Okeno, T.O. (2021). Morpho-biometrical characteristics of indigenous chicken ecotype populations in Rwanda. Tropical Animal Health and Production 53, 24.doi: https://doi.org/10.1007/s11250-020-02475-4
Hankamo, A., Woldeyohannes, T., Banerjee, S. (2020). Morphometrical characterization and structural indices of indigenous goats reared in two production systems in Sidama zone, southern Ethiopia. International Journal of Animal Science and Technology 4(1), 6-16. doi: https://doi.org/10.11648/j.ijast.20200401.12
Kandoussi, A., Petit, D., Boujenane, I. (2021). Morphologic characterization of the Blanche de Montagne, an endemic sheep of the Atlas Mountains. Tropical Animal Health and Production 53, 154. doi: https://doi.org/10.1007/s11250-021-02577-7
Kitila, K.B., Aleli, A.T., Tufa, S.S. (2025). Morphological characterization of indigenous goats in selected districts of West Shewa zone, Oromia regional state, Ethiopia. PLoS One 20 (7): e0327309. doi: https://doi.org/10.1371/journal.pone.0327309
Kuthu, Z.H., Ahmed, Z., Nawaz, M., Bila, G., Zubair, M., Ahmed, I., Ikram, M. (2022). Principal component analysis of Kail sheep based on body measurements. Pakistan Journal of Science 74(4). doi: https://doi.org/10.57041/pjs.v74i4.801
Laouadi, M., Tennah, S. Moula, N., Antoine-Moussiaux, N., Kafidi, N. (2020). Morphological characterization of indigenous goats in the region of Laghouat in Algeria. Archivos de Zootecnia 69(267), 272–279.url: https://vufind-ceipa.metacatalogo.com/Record/ojs-dialnet-ART0001410169
Macena, E. C. B. da C., Costa, R. G., de Sousa, W. H., Cartaxo, F. Q., Arandas, J. K. G., Ribeiro, M. N., Ribeiro, N. L. (2024). Canonical discriminant analysis on the characterization of the goat carcass. Acta Scientiarum-Animal Sciences 46, 1–7.doi: https://doi.org/10.4025/actascianimsci.v46i1.58440
Maksimović, N., Cekić, B., Ćosić, I., Ružić Muslić, D., Caro Petrović, V., Stojiljković, N., Stanišić, N. (2023). Discriminant analysis approach in morphometric differentiation and characterization of Serbian Autochthonous goats. Animals 13(12), 1952. doi: https://doi.org/10.3390/ani13121952
Mdladla, K., Dzomba, E.F., Muchadeyi, F.C. (2017). Characterization of the village goat production systems in the rural communities of the Eastern Cape, KwaZulu-Natal, Limpopo and North West Provinces of South Africa. Tropical Animal Health and Production. 49, 515–527. doi: https://doi.org/10.1007/s11250-017-1223-x
Mebratie, W., Tekuar, S., Alemayehu, K., Dessie, T. (2022). Body weight and linear body measurements of indigenous goat population in Awi Zone, Amhara region, Ethiopia. Acta Agriculturae Scandinavica A: Animal Sciences 71(1–4), 89–97.doi: https://doi.org/10.1080/09064702.2022.2127868
Melesse, A., Yemane, G., Tade, B., Dea, D., Kayamo, K., Abera, G., Mekasha, Y., Betsha, S., Taye, M. (2022). Morphological characterization of indigenous goat population in Ethiopia using canonical discriminant analysis. Small Ruminant Research, 206.106591. doi: https://doi.org/10.1016/j.smallrumres.2021.106591
Monau, P.I., Visser, C., Nsoso, S.J. (2018). Phenotypic and genetic characterization of indigenous Tswana goats. South African Journal of Animal Science 48(5).doi: http://dx.doi.org/10.4314/sajas.v48i5.12
Muhammad, H.A., Garba, Y., Ogah, D.M. (2021). Multivariate analysis of morphometric differentiation in the Red Sokoto and Boer Goats. Advances in Animal and Veterinary Sciences 9(4),595–603.
Muluneh, T., Tadesse, W. (2022). Phenotypic characterization of indigenous goat population in southern, Ethiopia. American Journal of Life Sciences 10(3), 31. doi: https://doi.org/10.11648/j.ajls.20221003.11
Nantongo, Z., Agaba, M., Shirima, G., Mugerwa, S., Opiyo, S., Mrode, R., Munishi, L. (2024). Variability in body weight and morphology of Uganda’s indigenous goat breeds across agroecological zones. PLOS ONE, 19(1), e0296353. doi: https://doi.org/10.1371/journal.pone.0296353
Nguluma, A., Kyallo, M., Tarekegn, G. M., Loina, R., Nziku, Z., Chenyambuga, S., Pelle, R. (2022). Typology and characteristics of indigenous goats and production systems in different agro-ecological zones of Tanzania. Tropical Animal Health and Production, 54(1), 70. doi: https://doi.org/10.1007/s11250-022-03074-1 peter
Ntonga, S.P., Akinmoladun, O.F., Mpetile, Z. (2025). Phenotypic characterization of indigenous Xhosa goat ecotype in three agro-ecological zones in the Eastern Cape province, South Africa. Veterinary and Animal Science 30, 100512. doi: https://doi.org/10.1016/j.vas.2025.100512
Ofori, S. A., Hagan, J. K., Kyei, F. (2021). Morphometric characterization and differentiation of West African Dwarf goat populations in Ghana. Tropical Animal Health and Production 53,69. doi: https://doi.org/10.1007/s11250-020-02498-x
Okoro, V. M. O., Chikereuba, U., Iheanacho, G., Ogundu, A., Chukwuocha, C., Chikaodinaka, F., Ifediba, C., Kadurumba, O. E., Ogundu, U., Iloeje, M. (2023). West African Dwarf goat populations of tropical rainforest zone: application of multivariate analysis tools on their characterization using morpho-biometric traits. Tropical Animal Health and Production, 55(3), 1–24. doi: https://doi.org/10.1007/s11250-023-03641-0
Okpeku, M., Yakubu, A., Peters, S. O., Ozoje, M. O., IKEOBI, C. O. N., Adebambo, O. A., Imumorin, I. G. (2011). Application of multivariate principal component analysis to morphological characterization of indigenous goats in Southern Nigeria. Acta Agriculturae Slovenica, 98(2), 101-109.
Oladepo, A.D., Salako, A.E. (2017). Blood protein polymorphism and differentiation of selected indigenous cattle breeds in Nigeria. Nigerian Journal of Animal Production. 44:11–18.
Razgour, O., Forester, B., Taggart, J. B., Bekaert, M., Juste, J., Ibáñez, C., Manel, S. (2019). Considering adaptive genetic variation in climate change vulnerability assessment reduces species range loss projections. Proceedings of the National Academy of Sciences, 116(21), 10418-10423.
Rotimi, E.A., Momoh, O.M., Egahi, J.O., Dim, N.I. (2020). Multivariate principal component analysis of morphological traits in West African Dwarf goats. FUDMA Journal of Sience 4(1), 333 – 339.
Sako, T., Tyasi, T. L, Ng’ambi, J. (2024). Phenotypic characterization of selected African sheep breeds: A Review. Pakistan Journal of Zoology 1-13. doi: https://dx.doi.org/10.17582/journal.pjz/20230510000554
Sarma, L., Nahardeka, N., Goswami, R. N., Aziz, A., Zaman, G., Das, A., Akhtar, F. (2019). Non-genetic factors affecting pre-weaning growth and morphometric traits in Assam Hill goat. Veterinary World 12(8), 1327–1331.
SAS (Statistical Analysis System). 2016. SAS for Windows, ver. 9.4 SAS Institute, Inc., Cary, NC, USA.
Selolo, T.C., Mashiloane, M. L., Norris, D., Ng’ambi, J.W., Brown, D. (2015). Morphological differentiation of indigenous goats in different agroecological zones of vhembe district, Limpopo province, South Africa. Indian Journal of Animal Research 49(4), 527–531. doi: https://doi.org/10.5958/0976-0555.2015.00052.7
Selvan, A.S., Thangaraj, S., Dash, S., Karthikeyan, A., Karthickeyan, S. M. K. (2023). Multivariate analysis of morphometric traits of Malaimadu cattle—autochthonous draft cattle of south India. Tropical Animal Health and Production 55(6), 369. doi: https://doi.org/10.1007/s11250-023-03790-2
Sheriff, O., Alemayehu, K., Haile, A., (2021). Phenotypic ranking experiments in identifying breeding objective traits of smallholder farmers in northwestern Ethiopia. PLOS ONE 16 (3): e0248779. doi: https://doi.org/10.1371/journal.pone.0248779
Shuma, G., Mekonnen, A., Duguma, G. (2024). Phenotypic characterization of indigenous goat types in Kellem Wollega zone of Oromia Region, Ethiopia. Ethiopian Journal of Agricultural Science 34(3) 34-56.
Tade, B., Melesse, A., Betsha, S. (2021). Application of multivariate analysis for the differentiation of indigenous goat populations of South Gondar, Ethiopia. Journal of Agricuture and Environmental Siences 6(1), 19–31.
Takele, A., Melesse, A., Taye, M. (2021). Application of multivariate analysis to differentiate Hararghe Highland goat populations reared in the west Hararghe zone, Ethiopia. Chilean Journal of Agricultural and Animal Sciences 37(3), 209–220. doi:https://doi.org/10.29393/CHJAAS37-23AMAM30023
Tarekegn, G. M., Khayatzadeh, N., Liu, B., Osama, S., Haile, A., Rischkowsky, B., Mwacharo, J. M. (2021). Ethiopian indigenous goats offer insights into past and recent demographic dynamics and local adaptation in sub-Saharan African goats. Evolutionary applications 14(7), 1716-1731. doi: https://doi.org/10.1111/eva.13118
Tenagne, A., Taye, M., Dessie, T., Muluneh, B., Kebede, D., Tarekegn, G.M. (2023). Quantifying morphometric and adaptive characteristics of indigenous cattle genetic resources in northwest Ethiopia. PLOS ONE 18(3): e0280640. doi: https://doi.org/10.1371/journal.pone.0280640
Tyasi, T.L., Tada, O. (2023). Principal component analysis of morphometric traits and body indices in South African Kalahari Red goats. South African Journal of Animal Science 53(1).doi: https://doi.org/10.4314/sajas.v53i1.04
Valsalan, J., Sadan, T., Venketachalapathy, T. (2020). Multivariate principal component analysis to evaluate growth performances in Malabari goats of India. Tropical Animal Health and Production 52 (5), 2451–2460 .doi: https://doi.org/10.1007/s11250-020-02268-9
Vanvanhossou, S. F.U., Diogo, R.V.C., Dossa, L.H. (2018). Estimation of live bodyweight from linear body measurements and body condition score in the West African Savannah shorthorn cattle in North-West Benin. Cogent Food and Agriculture 4(1), 1549767. doi: https://doi.org/10.1080/23311932.2018.1549767
Velado-Alonso, E., Morales-Castilla, I., Gómez-Sal, A. (2020). Recent land use and management changes decouple the adaptation of livestock diversity to the environment. Scientific Reports, 10(1), 21035.
Whannou, H.R., Afatondji, C.U., Ahozonlin, M.C., Spanoghe, M., Lanterbecq, D., Demblon, D., et al. (2021) Morphological variability within the indigenous sheep population of Benin. PLOS ONE 16 (10): e0258761.doi: https://doi.org/10.1371/journal.pone.0258761
Worku, A., Melesse, A. (2021). Application of multivariate analysis on morphometric traits to characterize the sheep populations reared in the central rift valley of Ethiopia. Ethiopian Journal of Animal Production 21(1), 30–47.
Yamane, T. (1967). Statistics: An Introductory Analysis, 2nd edition, New York: Harper and Row.
Zergaw, N., Dessie, T., Kebede, K. (2017). Using morphometric traits for live body weight estimation and multivariate analysis in Central Highland and Woyto-Guji goat breeds, Ethiopia. African Journal of Agricultural Research 12(15),1326–1331. doi: https://doi.org/10.5897/ajar2016.11628