A public mid-density genotyping platform for North American Atlantic salmon (Salmo salar L.)
Dongyan Zhaoa,†, Josue Chinchilla-Vargasa,†, Alexander M. Sandercocka, Cristiane H. Tanigutia, Roseanna Longb, Yniv Paltib, Guangtu Gaob, Michael Pietrakc, Samuel A. Mayc‡, Kasia Heller-Uszynskad, Craig T. Beila, Moira J. Sheehana,*
aBreeding Insight, Cornell University, NY, 14853, Ithaca, USA
bNational Center for Cool and Cold Water Aquaculture Research, USDA-ARS, WV, Leetown, 25430, USA
cNational Cold Water Marine Aquaculture Center, USDA-ARS, ME, 04634, Franklin, USA
dDiversity Arrays Technology, ACT 2617, Bruce, Australia
‡Current address: The Center for Aquaculture Technologies, 8445 Camino Santa Fe Suite 104, San Diego, CA, USA
†These authors have contributed equally to this work
*Corresponding author: Moira Sheehan (moirasheehan@cornell.edu)
Abstract: Genomics-enabled selective animal breeding has become common in recent years, prompting a growing need for diverse genotyping tools that facilitate collaboration among research groups while meeting specific programme needs and objectives. Here, we report the development of a medium-density amplicon panel (DArTag) of 2,950 loci for North American Atlantic salmon. It includes loci distributed across the genome and loci useful for distinguishing the continent-of-origin, parentage, and sex determination. This mid-density panel offers more cost-effective and rapid genotyping capabilities for Atlantic salmon researchers and breeders. The open access provided by this platform facilitates comparisons and enhances data reusability across projects, institutions and countries that use different genomic tools for genotyping. This genotyping panel can make routine genotyping a viable tool for breeding and research programmes.
Keywords: Salmon, aquaculture, amplicon-sequencing, selective breeding, DArTag genotyping
Introduction
Commercial aquaculture of Atlantic salmon (Salmo salar L.) accounts for approximately 70% of the global total salmon production (Pandey et al, 2023). Atlantic salmon has long been the focus of selective breeding programmes aimed at improving production traits related to growth, disease resistance and fillet quality (Vallejo et al, 2024; Kristjánsson et al, 2020). The past two decades have witnessed a rapid adoption of molecular methods to enhance breeding programmes, particularly the application of genomic selection methods (Meuwissen et al, 2001). These molecular advancements require developing genotyping tools for various applications, most often in the form of panels of preidentified Single Nucleotide Polymorphisms (SNPs). In plant breeding, these targeted genotyping technologies can be characterized into low density (i.e. hundreds of loci), medium density (i.e. hundreds to thousands of loci) and high density (i.e. tens of thousands to millions of loci). This classification differs notably from livestock standards, where medium-density arrays typically contain around 50K markers and high-density arrays can exceed 700K markers. For aquaculture study and breeding, until recently, the majority of these resources were designed and owned by private companies (Gao et al, 2023; Kijas et al, 2017), slowing the efficiency of Atlantic salmon genomic research. Therefore, publicly accessible genomic resources are needed to facilitate open, reproducible research for Atlantic salmon, with applications in aquaculture, conservation and fisheries management.
North American Atlantic (NAA) salmon are genetically distinct from European and Baltic Atlantic strains. The common ancestor of today’s salmonids underwent a lineage-specific whole genome duplication event at ~96 million years ago (Allendorf and Thorgaard, 1984; Danzmann et al, 2008; Berthelot et al, 2014). Since that time, the re-diploidization of salmonids has proceeded independently in the Old World and the New World. Today, the genetic divergence of European and Baltic Atlantic salmon (2n = 2x = 58) from NAA salmon (2n = 2x = 54) is characterized by large structural changes and unique karyotypes that designate them as subspecies (de Boer et al, 2007; Brenna-Hansen et al, 2012). Despite high syntenic conservation, NAA salmon exhibited significant genomic differences compared to its European counterpart (Brenna-Hansen et al, 2012; Gao et al, 2020). Atlantic salmon farming in the eastern United States and Canada is limited to North American (NA) genetic stocks due to ecological and conservation concerns. Therefore, genotyping panels developed for European Atlantic salmon are less effective when applied to NA populations, underscoring the need for origin-specific genomic tools (Yáñez et al, 2016).
In the United States, the only remaining wild populations of Atlantic salmon are found in the Gulf of Maine and are listed as endangered under the Endangered Species Act (https://www.fisheries.noaa.gov/species/atlantic-salmon/protected). The USDA-ARS National Cold Water Marine Aquaculture Center (NCWMAC) has operated a selective breeding programme for the St. John River (SJR) strain of NAA salmon since 2003 for traits such as growth, fillet quality and resistance to sea lice (a major pathogen in marine aquaculture) (Peterson et al, 2020; Vallejo et al, 2024). The SJR strain, chosen for its rapid growth and suitability for captive aquaculture, undergoes a 4-year lifecycle involving specialized systems for egg incubation, fry growth, and maturation, culminating in spawning mature broodstock weighing approximately 3–8kg. Up to 150 families are cultured annually, with fish evaluated in biosecure tanks and commercial net pens for performance. In 2022, NCWMAC adopted a genomic selection index weighted 70% for growth and 30% for sea lice resistance, supported by a 50K SNP chip developed for the NA salmon genome (Gao et al, 2023; Vallejo et al, 2024).
The cost of using the 50K SNP chip remains a barrier to widespread usage. In contrast, low- or medium-density genotyping panels may meet many of the same goals at a reduced price with reduced lab equipment requirements and lower overhead. Here, we developed a multi-purpose medium-density DArTag panel with 3K markers by subsetting markers already included in the 50K NAA salmon SNP array (Gao et al, 2023). DArTag is a targeted amplicon sequencing platform developed by Diversity Arrays Technology, LLC, which provides low-cost and reproducible genotyping results across sequencing projects (Blyton et al, 2023; “DArTag,” n.d.). We validated the DArTag panel by genotyping 3,710 NAA salmon from the United States Department of Agriculture (USDA) aquaculture stock and show that (1) the 3K DArTag panel can be used to obtain high-quality SNPs across genotyped individuals, (2) the panel accurately identifies relationships between individuals, and (3) the 3K panel can be effectively used for linkage analysis comparable to the high-density array. This open-source 3K DArTag panel can increase the accessibility of genotyping for programmes without access to in-house genotyping technology or specialized labour. It may also reduce the cost of genotyping by lowering the marker density without sacrificing much information, thereby increasing breeder access to genotyping services to allow for more intensive, routine and effective usage of genomic resources in NAA salmon breeding.
Materials and methods
Selection of 3K marker loci for building the DArTag genotyping panel
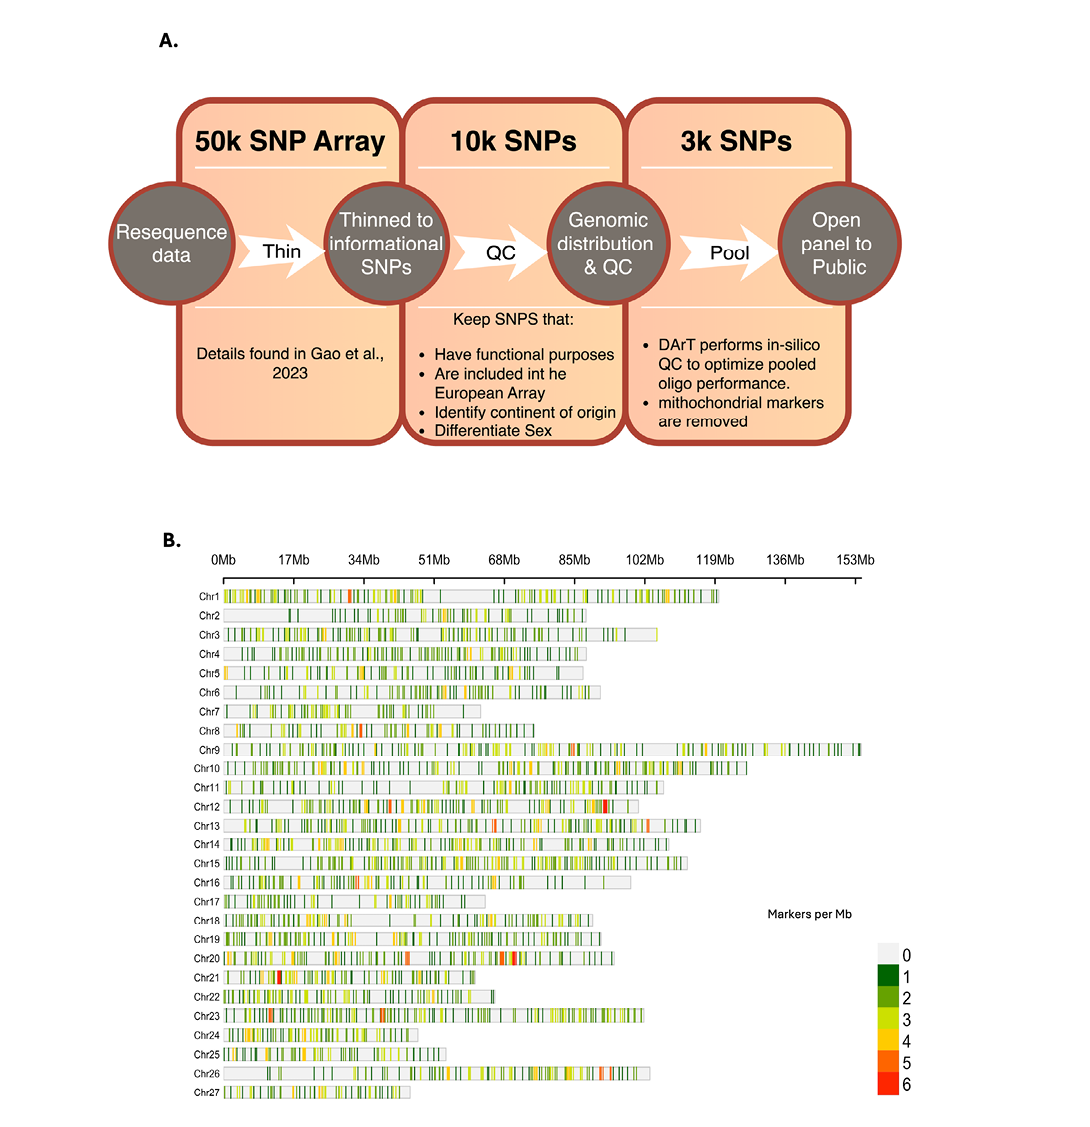
We previously published the results of the 50K SNP Affymetrix array (Gao et al, 2023) developed based on the alignment of whole-genome re-sequencing of 80 NAA salmon fish from three distinct aquaculture stocks to the NAA salmon reference genome (GenBank Accession GCA_021399835.1). From the 50K array, 10,353 SNPs were selected for their even genome distribution and functional annotations, including 8,803 SNPs from the NAA-based SNP dataset (Gao et al, 2023), 1,462 highly informative SNPs from a European-based SNP array (Houston et al, 2014), 64 SNPs for distinguishing the continent of origin (COO), 20 mitochondrial SNPs, and four sex determination SNPs. The evenly distributed 10K SNP set was submitted to Diversity Arrays Technology (DArT) for proprietary in silico quality control. DArT recommended the loci that passed quality control to produce the final 3K SNP panel. Upon initial testing of the 3K panel, it was observed that the 20 mitochondrial markers consumed ~40% of the reads per sample, indicating the abundance of mitochondrial DNA and undesirable preferential amplification. Therefore, these 20 markers were removed, leaving a final set of 2,980 genomic loci (Figure 1).
Notably, the 50K SNP dataset was initially developed based on the NAA salmon’s contig-level assembly, and Gao et al, 2023 mapped these SNPs to the final chromosome-level assembly. Among the 2,980 DArTag markers, 2,911 were assigned chromosome coordinates by Gao et al, 2023. For the remaining 69 markers, we used BLAST to align the 180bp flanking sequences to the reference genome. We confirmed the positions of 49 of the 69 markers, bringing the number of markers with known pseudomolecule physical locations in the chromosomes up to 2,950 (Supplemental Table 1). The unmapped SNPs are likely due to several factors, such as their contigs not being included in the final assembly, contig splits due to Hi-C or Bionano scaffolding, and/or error corrections at the scaffold level that altered the reference sequences.
To compare the 50K SNP array with the 3K DArTag panel, we aligned the two datasets into a consistent genomic framework, including matching target SNP positions and reference and alternative base calls. The Axiom and DArTag arrays can include probes on the plus or minus strand. Thus, correct inference of reference and alternative alleles depends upon the oligo orientation, especially for A/T and C/G (i.e. SNPs ambiguous to DNA strand) SNPs. We established contig orientation through BLAST alignment of the 180bp flanking sequences of the 3K SNPs against the reference genome. Reference and alternative bases were designated based on the contig orientations and the Axiom and DArTag probe orientations.
Methodology and procedure of the DArTag genotyping platform
The DArTag genotyping assay consists of four steps based on principles described in Krishnakumar et al, 2008 and implemented as described (Zhao et al, 2023; Sandercock et al, 2025a). Briefly, the pool of 3K NAA salmon oligos, each targeting one genetic variant plus adjacent flanking sequence, are hybridized to denatured gDNA in step 1, followed by SNP/INDEL copying into DArTag molecules by DNA polymerase in step 2. Also in step 2, amplicons are ligated to create circularized molecules. In step 3, the reaction content is treated with nucleases to remove any un-circularized molecules. DArTag products are subsequently amplified in step 4 with the simultaneous addition of sample-unique barcodes used downstream for demultiplexing. The products of the DArTag assay, after purification and quantification, are sequenced on NGS platforms (e.g. NovaSeq 6000, Illumina) with a depth of around 200x. Sequences are demultiplexed, quality controlled, and the genetic variants are detected using DArT’s proprietary analytical pipelines.
Selection of samples for validating the DArTag panel and genotyping results
The salmon 3K marker panel was tested using a set of 3,710 fish from the SJR strain reared at NCWMAC (Supplemental Table 2). This set included 118 fish from year classes (YC) fertilized in YC2009 and YC2010, 1,099 fish from YC2014, 2,487 fish from YC2018, and two individuals lacking year class information. The dataset represented three generations of fish from the SJR strain of NAA salmon. Genotyping was processed in two batches: (1) 1,105 fish from 2014 and (2) the remaining 2,605 fish. DArT provided genotypes in VCF format, read counts for all markers, dosage calls, and missing allele discovery counts (MADC) for the second batch, which contained the read count for all 54bp microhaplotype alleles discovered in the samples. Read count data for reference (Ref) and alternative (Alt) alleles from both batches underwent a 2-step quality control and filtering process. First, we removed samples with high missing data rates (≥ 95%), where a marker was considered missing if it had fewer than 10 reads. Subsequently, we filtered out marker loci that were present in < 10 samples. To enable accurate comparative analysis between the two batches, we concatenated read count data into a single file and conducted dosage calls using the updog R package (Gerard et al, 2018). The original DArTag marker IDs were converted to the chromosome-level marker IDs in the 50K array and lookup table of the DArTag vs. Axiom IDs is provided (Supplemental Table 1).
Pedigree verification and parentage testing
Before verifying parentage, duplicated IDs, individuals appearing both as male and female, and any circular dependencies in the pedigree were removed using the clean_pedigree() function from BIGr (RRID: SCR_026677; v0.3.4) (Sandercock et al, 2025a; Sandercock et al, 2025b). Parentage testing was performed with the SEEKPARENTSF90 module in BLUPF90 (Misztal et al, 2014) with an allowed maximum threshold of 1% of markers showing Mendelian errors between parent-offspring pairs proposed by pedigree. Percentages over the threshold were flagged as a pedigree error. To identify potential parents in the genotyped set of individuals, the –seektype 2 flag was used in the analysis. Additionally, within-family clustering of individuals was performed with a principal component analysis (PCA) via the Breeding Insight Genomics App (RRID v0.6.2) (Beygelzimer et al, 2019; Sandercock et al, 2025a).
Supervised clustering and K nearest neighbor (KNN)
An initial parentage verification analysis of the DArTag datasets found discordance between pedigree records and genotypes, suggesting that the individuals in batch 2 were not labelled with the correct sample IDs. A 2-step approach was implemented to estimate the correct IDs: (1) match the sample IDs between the Axiom 50K and 3K DArTag datasets based on genetic similarity, and (2) validate the estimated sample IDs through a second parentage verification analysis.
Before matching, missing genotypic data in batch 2 samples were imputed using Beagle v5.4 with the default parameters (Browning, Zhou, and Browning 2018). The 50K dataset and the 3K dataset of fish born in 2018 were filtered to retain only shared loci in both datasets. To estimate potential matches (step 1), we used the K-nearest neighbors (KNN) algorithm as implemented in the Fast Nearest Neighbor Search Algorithms and Applications (FNN) R package (v1.1.4.1) (Beygelzimer et al, 2019). The individual samples on the 50K panel were paired with the sample exhibiting the smallest genetic distance (Euclidean distance) in the 2018 DArTag dataset. This was accomplished using the knn.dist() function of the FNN package (parameter k = 1), effectively assigning the single, most likely sample ID from the 50K dataset to its counterpart in the 2018 3K dataset. To assess the accuracy of this first step, we performed the same steps above with the 50K and 3K genotype data for the 2014 salmon samples (batch 1). We found 99.8% agreement between the putative sample ID and the matched sample ID using only this initial KNN match.
Despite the assessed accuracy of step 1, several individuals in the 50K dataset did not pair with a unique sample in the 2018 3K dataset. In these cases, only the match with the lowest genetic distance was retained for step 2. Finally, a second parentage analysis (step 2) was performed using the sample IDs estimated by KNN for mislabelled individuals in the 2018 DArTag dataset. The sample IDs that passed this verification confirmed that the revised IDs were consistent with Mendelian expectations, enabling the accurate identification of the parents of the mislabelled samples. Only validated samples that passed both steps were included for genetic map construction.
Genetic map construction
To evaluate the utility of the DArTag marker panel for closed-population marker-assisted selection (MAS), a linkage map was generated using Lep-MAP3 (v0.5.0; Rastas, 2017) from the validated salmon samples. Samples were retained if they belonged to a family with at least ten individuals, resulting in 1,035 samples, 55 families, and 2,806 informative SNP loci. First, the ParentCall2 function was used to call missing parental genotypes, with halfSibs = 1 to include half-sib information. Then, Filtering2 checked SNPs for non-informative markers or non-Mendelian markers (i.e. segregation distortion), although no additional SNPs were removed due to the previous, more stringent filtering in Plink 1.9 (Purcell et al, 2007). Markers were categorized into 33 linkage groups (LGs) using SeparateChromosome2, with lodLimit = 27 set as the expected number of haploid chromosomes in NAA salmon (1n = 1x = 27). Of the 33 LGs, 27 LGs contained markers aligned with their expected physical chromosomes. The six remaining LGs contained four or fewer markers, so the markers from these six LGs were categorized as ‘single’ markers for the next step. The ‘single’ markers were added to one of the 27 LGs with a more relaxed lodLimit = 10 and lodDifference = 3. Lastly, the genomic positions of the markers within each LG were ordered with OrderMarkers2. Additional filtering was performed to remove markers with (1) a physical position that deviated significantly from the other markers in the LG and (2) a lower pairwise LOD score with closely positioned markers (Supplemental Figure 1).
Results
Creation of the 3K NAA salmon DArTag panel
The 3K DArTag panel (Salmon DArTag3K BI Cornell University (1.0)) is comprised of 514 SNPs from a European-based SNP array (Houston et al, 2014), 64 SNPs for identifying COO, 4 SNPs from the sex determination (sd) locus, and 2,418 genic SNPs from the NAA salmon SNP dataset. To enhance comparability, the 3K SNPs were mapped to the NAA salmon chromosomes, and 2,950 SNPs were assigned unambiguously to physical positions (Supplemental Table 1). The 514 European-based markers were mapped across the 27 chromosomes, with an additional small fraction (0.6%) remaining in unplaced sequences based on the NAA salmon reference genome (Supplemental Table 3). The majority of chromosomes (18/27; 66.7%) maintained moderate to high marker coverage, containing between 15 and 30 markers each, indicating robust coverage across most of the genome.
Validation of the 3K salmon DArTag panel and genotyping results
To assess the 3K panel, a validation set of 3,710 samples was genotyped in two batches using the 3K DArTag panel to: (1) construct a genetic linkage map and (2) evaluate the usefulness of the DArTag panel for downstream genetic analyses. We established a minimum threshold of ten read counts for a marker locus to be considered valid. Under this criterion, 1,077 (97%) of 1,105 samples from batch 1 and 2,470 (95%) of the 2,605 samples from batch 2 retained data for 75% of the total markers. Batch 2 showed particularly robust performance, with 2,181 (84%) samples containing data for ≥ 90% of the total markers (Supplemental Table 4).
Of the 2,950 markers, 2,495 (85%) and 2,827 (96%) were present in ≥ 50% of the samples from batches 1 and 2, respectively, suggesting they are highly conserved sequences within the NAA salmon population. Batch 2 demonstrated superior marker performance, with 2,410 (82%) markers present in ≥ 90% of the samples compared to 1,857 (63%) in batch 1 (Supplemental Table 4). This disparity in missing data rates between batches was likely due to lower DNA quality in the batch 1 samples. Overall, the panel demonstrated the robustness and applicability of the panel for high-throughput genotyping in NAA salmon populations.
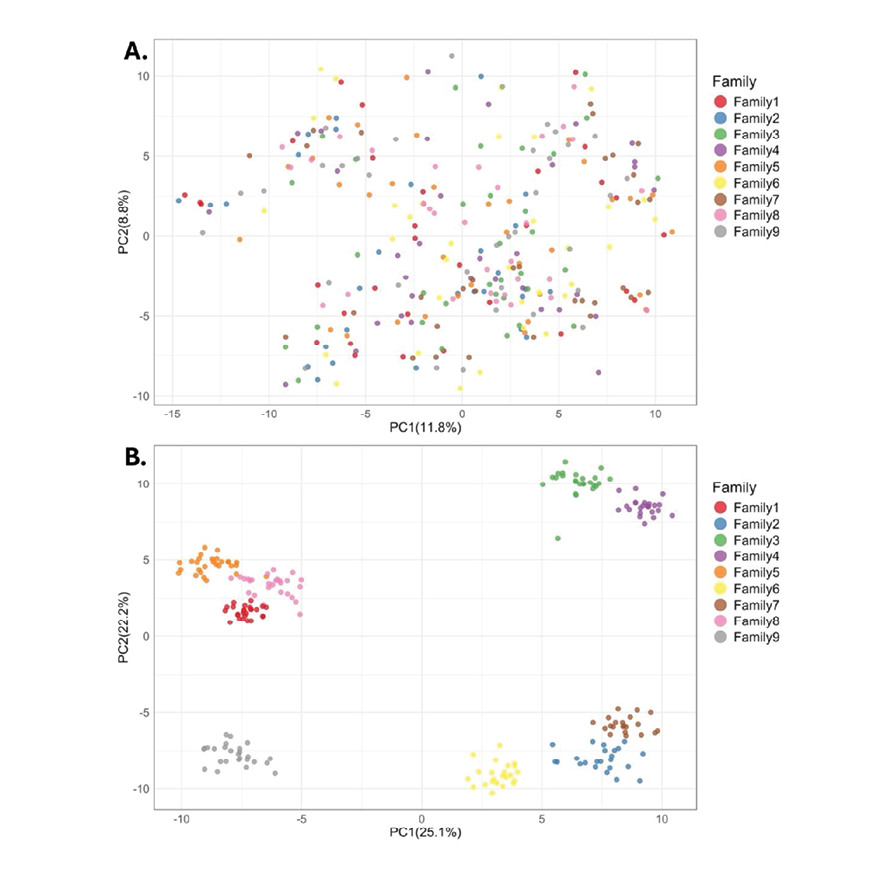
Figure 2. Principle Component Analysis (PCA) plots in the first two dimensions of the validation families. A) PCA plot of the nine full-sibling families with the largest members of 2018-born fish before parentage testing and KNN analysis. B) PCA plot of the same nine full-sibling families of 2018-born fish after pedigree correction with KNN.
For comprehensive analyses, we merge read count data from both batches. Of the 2,950 SNPs assigned to physical positions, 2,278 markers were successfully genotyped in ≥ 85% of samples. Additionally, 2,493 samples retained genotype data for ≥ 85% of the markers. The merged dataset showed lower data rates compared to batch 2 independently, reflecting the impact of batch 1’s lower performance. After filtering for missing data and concatenating the allele dosage results from both batches, 2,806 markers were retained for downstream analyses.
Pedigree verification, parentage testing, and correction via KNN analysis
An initial parentage testing run to verify pedigree accuracy showed that 99.6% of offspring-parent pairs in the dataset were erroneous. To better visualize the within-family clustering, the principal components of genotypes of 276 fish belonging to the nine families with the most siblings were plotted. No identifiable clustering by family was found (Figure 2A). This led us to identify widespread mislabeling of samples from fish born in 2018.
To identify the best-matching ID in the DArTag genotyping results, 3K genotype calls were compared to the same markers in the 50K array using KNN analysis. Genetic distances between matched samples ranged from 27.2 to 53.63, with a maximum value of 45 selected as a filtering threshold that limited the number of samples with multiple matches, retaining 1,493 fish. Parentage testing of the KNN-informed parent-offspring pairs found 992 samples (66.5%) fulfilled Mendelian expectations with their proposed parents. This two-step approach produced a set of 1,013 individuals, composed of 55 full-sib families of at least ten individuals and their respective parents, which were then used to generate the linkage map. Figure 2B shows the clustering of the nine families with the most individuals, as assigned by KNN.
Creation of a linkage map
The final salmon DArTag linkage map (Figure 3) consisted of 27 LGs with 2,642 markers and a total length of 1,983.81cM for the female map, and 927.8cM for the male map (with an average density of 1.33 markers/cM and 2.85 markers/cM, respectively).
LG length from the female map ranged from 52.44cM to 101.02cM, with an average of 73.5cM. The male map linkage group length ranged from 2.42cM to 75.3cM, with an average length of 34.4cM.
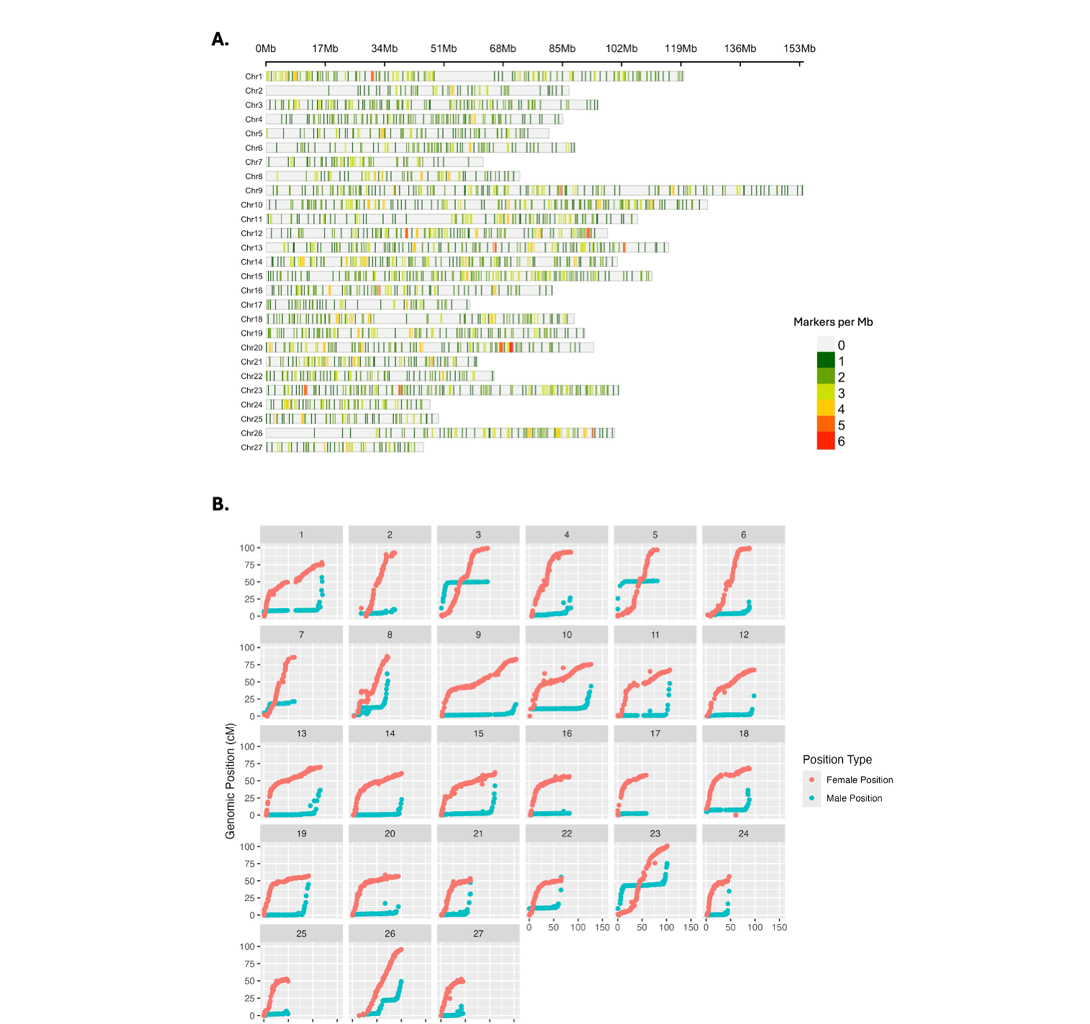
Figure 3. Genetic map of NAA salmon constructed from 1,035 individuals from 55 families. A) Distribution of 2,642 SNPs across 27 linkage groups of the North American Atlantic salmon linkage map. B) Relationship plots of physical map distance (Mb; x-axes) to genetic map distance (cM; y-axes) for each of the 27 chromosomes in the male and female genetic maps.
Consistent with findings from the same fish tested on the 50K marker panel (Gao et al, 2023), paternal and maternal recombination patterns differed (Figure 3B). In paternal chromosomes, recombination was elevated at the telomeres with strong interference near the centromere. In contrast, maternal chromosomes exhibited distinct patterns based on chromosome type: in acrocentric chromosomes, recombination was elevated around the centromere and decreased toward the telomeres, whereas in metacentric chromosomes, interference was pronounced at the centromere with comparable recombination patterns extending toward both telomeric ends. Markers were generally well distributed across the 27 LGs, with ~50% of the markers located within the first 10 LGs (Table 1). Additional mapping details are summarized in Supplemental Table 5.
Table 1. Linkage map from 1,035 fish spanning 55 families and 2,642 uniquely mapped SNPs by chromosome on the male and female maps (in cM).
|
Chromosome |
Marker Count |
Male (cM) |
Female (cM) |
|
Chr01 |
148 |
56.8 |
78.7 |
|
Chr02 |
55 |
10.1 |
92.6 |
|
Chr03 |
107 |
50.4 |
99.1 |
|
Chr04 |
90 |
26.7 |
93.7 |
|
Chr05 |
75 |
52.0 |
96.8 |
|
Chr06 |
80 |
20.8 |
99.4 |
|
Chr07 |
54 |
21.4 |
85.7 |
|
Chr08 |
75 |
61.8 |
87.2 |
|
Chr09 |
163 |
17.1 |
83.2 |
|
Chr10 |
151 |
43.6 |
75.7 |
|
Chr11 |
103 |
47.7 |
67.4 |
|
Chr12 |
114 |
29.6 |
67.3 |
|
Chr13 |
129 |
36.4 |
70.0 |
|
Chr14 |
131 |
22.8 |
60.8 |
|
Chr15 |
146 |
42.7 |
62.2 |
|
Chr16 |
93 |
5.6 |
56.6 |
|
Chr17 |
51 |
2.4 |
58.0 |
|
Chr18 |
98 |
36.3 |
68.9 |
|
Chr19 |
103 |
44.7 |
57.2 |
|
Chr20 |
113 |
17.1 |
58.5 |
|
Chr21 |
86 |
47.5 |
53.5 |
|
Chr22 |
79 |
55.3 |
53.6 |
|
Chr23 |
131 |
75.3 |
101.0 |
|
Chr24 |
64 |
34.8 |
56.2 |
|
Chr25 |
54 |
6.4 |
52.6 |
|
Chr26 |
90 |
49.2 |
95.6 |
|
Chr27 |
59 |
13.5 |
52.4 |
|
Min |
51 |
2.4 |
52.4 |
|
Max |
163 |
75.3 |
101.0 |
|
Average |
97.9 |
34.4 |
73.5 |
|
Total |
2,642 |
927.8 |
1,983.8 |
Discussion and conclusion
The NAA salmon 3K DArTag panel serves as a robust and versatile tool for genetic applications, providing reliable data for pedigree verification, parentage assignment and linkage map construction. Its mid-density design fills a gap in community resources between the high-density 50K array and the low-density option of 384 SNPs (Center for Aquaculture Technologies, personal communication). The 3K panel achieves comparable genome coverage to the 50K panel described by Gao et al (2023). Because it is a subset of loci on the 50K, it could be used for sparse testing plus imputation on higher numbers of progeny when parents are genotyped on the 50K in parent-progeny studies. The inclusion of four sex-linked markers and 68 COO markers further enhances its applicability across diverse research and breeding scenarios. We acknowledge that the fewer markers in the mid-density panel relative to the 50K array may result in a substantial loss of resolution for fine-scale mapping applications such as genome-wide association studies (GWAS), as QTL detection and mapping accuracy are highly dependent on marker density. However, the reduction in marker density is expected to have only a modest impact on genomic selection applications, where prediction accuracy may show only a slight decrease.
While the 3K panel was developed and validated for NAA salmon, its transferability to European salmon populations would need empirical validation. Importantly, the inclusion of 514 markers from a European salmon-based Affymetrix SNP array could potentially be useful for European salmon populations. The potential utility of this panel might be particularly relevant for comparative genomic studies, population structure analyses, or preliminary screening purposes for both North American and European Atlantic salmon. However, users should consider possible limitations when applying it to European populations, including: (1) potentially reduced marker polymorphism in European populations, (2) different linkage disequilibrium patterns that might affect marker informativeness, and (3) possible ascertainment bias due to the North American-focused marker selection.
The NAA salmon DArTag panel is publicly available and open for any researcher or breeder to order through DArT (https://www.diversityarrays.com), with a cost midway between the 50K high-density array and the 384-SNP low-density options. The high detection rate and repeatability make this panel suitable for genetic map construction, marker-assisted selection, whole-genome association mapping, reconstruction of recombination patterns, allele dosage estimation, and parental confirmation in NAA salmon from the Northeast US. The panel’s efficacy on breeding materials or populations outside the northeast US has not been tested.
One benefit DArTag has over fixed array platforms is the ability to update and improve the marker panel as needed. The panel is a pool of 2,950 oligos, one per locus, which are used to generate sequencing libraries from assayed material. Because the pool is created from individual oligo stocks, removing suboptimal loci or adding new loci can be quickly done by creating a new pool. Independently, as new significant trait markers and/or markers specific to other germplasm are detected, they can be included in the original pool in the panel’s next version(s).
Due to our budgetary restrictions, we created a panel of 3,000 loci; however, smaller, complementary panels can be made at lower up-front and downstream usage costs. Sub-panels of a few hundred loci may also be developed using other amplicon techniques, such as Genotyping by Thousands (GTseq), for lower genotyping costs (Campbell et al, 2015). The practical upper limit for the number of probes on a DArTag panel is 7,000 loci. However, the optimal maximum may differ by species and genome complexity, and read depth required to sufficiently call genotypes (Andrzej Kilian DArT, personal communication).
Supplemental File 1. Genotypic data in VCF format for the 1,013 individuals used to produce the linkage map
Supplemental Figure 1. Relationship plots of physical map distance (Mb; x-axes) to genetic map distance (cM; y-axes).
Supplemental Table 1. Physical position and identification of the 2950 SNPs included in the DArTag panel.
Supplemental Table 2. Accessions used in the testing of the salmon 3K DArTag panel and construction of genetic map.
Supplemental Table 3. Distribution of European Atlantic salmon array-based markers on salmon genome
Supplemental Table 4. Sample and marker missing data from two batches of DArTag genotyping.
Supplemental Table 5. Physical position, genetic distance and identification of the 2,642 SNPs included in the linkage map.
Author contributions
DZ, GG, YP and MJS contributed to experimental design and planning. GG and YP selected the diversity panel for WGS. SM contributed to writing and editing the paper. RL and MP collected and prepared all fin clip materials used in the study. DZ performed all the SNP database creation, filtering pipelines, and quality control analyses to create the 3K panel. KHU managed the panel creation at Diversity Arrays Technology. DZ, AS, JCV, AMS and CHT executed the data analyses and genetic mapping. DZ, AMS, JCV and MJS wrote the initial draft of the manuscript. CB managed experiments and communication among all authors involved. All authors contributed to reviewing the manuscript.
Acknowledgments and funding
The authors extend their thoughts to their late colleague, Guangtu Gao, with whom they had the pleasure of working on this study, and who passed away too soon. The authors also thank Dr Alex Casa for her careful review of this manuscript and her valuable feedback. Breeding Insight (RRID:SCR_026645) was funded through Cooperative Agreements between USDA-ARS and Cornell (project numbers: 8062-21000-043-004-A, 8062-21000-052-002-A, and 8062-21000-052-003-A). This study was also supported by the USDA Agricultural Research Service in-house project numbers 8030-31000-004/005 and 8082-31000-012/013.
Conflict of interest statement
The authors declare no conflicts of interest.
Data availability statement
The genotypic data in VCF format for the 1,013 individuals used to produce the linkage map are available as Supplemental File 1.
References
Allendorf, Fred W., and Gary H. Thorgaard. 1984. “Tetraploidy and the Evolution of Salmonid Fishes.” In Evolutionary Genetics of Fishes, 1–53. Boston, MA: Springer US. https://doi.org/10.1007/978-1-4684-4652-4_1.
Berthelot, Camille, Frédéric Brunet, Domitille Chalopin, Amélie Juanchich, Maria Bernard, Benjamin Noël, Pascal Bento, et al, 2014. “The Rainbow Trout Genome Provides Novel Insights into Evolution after Whole-Genome Duplication in Vertebrates.” Nature Communications 5 (1): 3657. https://doi.org/10.1038/ncomms4657.
Beygelzimer, Alina, Sham Kakadet, John Langford, Sunil Arya, David Mount, and Shengqiao Li. 2019. “FNN: Fast Nearest Neighbor Search Algorithms and Applications.” Comprehensive R Archive Network (CRAN). 2019. https://CRAN.R-project.org/package=FNN.
Blyton, Michaela D. J., Kylie L. Brice, Katarzyna Heller-Uszynska, Jack Pascoe, Damian Jaccoud, Kellie A. Leigh, and Ben D. Moore. 2023. “A New Genetic Method for Diet Determination from Faeces That Provides Species Level Resolution in the Koala,” February. https://doi.org/10.1101/2023.02.12.528172.
Boer, Johan G. de, Ryosuke Yazawa, William S. Davidson, and Ben F. Koop. 2007. “Bursts and Horizontal Evolution of DNA Transposons in the Speciation of Pseudotetraploid Salmonids.” BMC Genomics 8 (1): 422. https://doi.org/10.1186/1471-2164-8-422.
Brenna-Hansen, Silje, Jieying Li, Matthew P. Kent, Elizabeth G. Boulding, Sonja Dominik, William S. Davidson, and Sigbjørn Lien. 2012. “Chromosomal Differences between European and North American Atlantic Salmon Discovered by Linkage Mapping and Supported by Fluorescence in Situ Hybridization Analysis.” BMC Genomics 13 (1): 432. https://doi.org/10.1186/1471-2164-13-432.
Browning, Brian L., Ying Zhou, and Sharon R. Browning. 2018. “A One-Penny Imputed Genome from next-Generation Reference Panels.” The American Journal of Human Genetics 103 (3): 338–48. https://doi.org/10.1016/j.ajhg.2018.07.015.
Campbell, Nathan R., Stephanie A. Harmon, and Shawn R. Narum. 2015. “Genotyping-in-Thousands by Sequencing (GT-Seq): A Cost Effective SNP Genotyping Method Based on Custom Amplicon Sequencing.” Molecular Ecology Resources 15 (4): 855–67. https://doi.org/10.1111/1755-0998.12357.
Danzmann, Roy G., Evelyn A. Davidson, Moira M. Ferguson, Karim Gharbi, Ben F. Koop, Bjorn Hoyheim, Sigbjorn Lien, et al, 2008. “Distribution of Ancestral Proto-Actinopterygian Chromosome Arms within the Genomes of 4R-Derivative Salmonid Fishes (Rainbow Trout and Atlantic Salmon).” BMC Genomics 9 (1): 557. https://doi.org/10.1186/1471-2164-9-557.
“DArTag.” n.d. Diversity Arrays Technology. https://www.diversityarrays.com/services/targeted-genotying/.
Gao, Guangtu, Michael R. Pietrak, Gary S. Burr, Caird E. Rexroad 3rd, Brian C. Peterson, and Yniv Palti. 2020. “A New Single Nucleotide Polymorphism Database for North American Atlantic Salmon Generated through Whole Genome Resequencing.” Frontiers in Genetics 11 (February): 85. https://doi.org/10.3389/fgene.2020.00085.
Gao, Guangtu, Geoffrey C. Waldbieser, Ramey C. Youngblood, Dongyan Zhao, Michael R. Pietrak, Melissa S. Allen, Jason A. Stannard, et al, 2023. “The Generation of the First Chromosome-Level de Novo Genome Assembly and the Development and Validation of a 50K SNP Array for the St. John River Aquaculture Strain of North American Atlantic Salmon.” G3: Genes|Genomes|Genetics 13 (9). https://doi.org/10.1093/G3JOURNAL/JKAD138.
Gerard, David, Luis Felipe Ventorim Ferrão, Antonio Augusto Franco Garcia, and Matthew Stephens. 2018. “Genotyping Polyploids from Messy Sequencing Data.” Genetics 210 (3): 789–807. https://doi.org/10.1534/genetics.118.301468.
Houston, Ross D., John B. Taggart, Timothé Cézard, Michaël Bekaert, Natalie R. Lowe, Alison Downing, Richard Talbot, et al, 2014. “Development and Validation of a High Density SNP Genotyping Array for Atlantic Salmon (Salmo Salar).” BMC Genomics 15 (February): 90. https://doi.org/10.1186/1471-2164-15-90.
Kijas, J., N. Elliot, P. Kube, B. Evans, N. Botwright, H. King, C. R. Primmer, and K. Verbyla. 2017. “Diversity and Linkage Disequilibrium in Farmed Tasmanian Atlantic Salmon.” Animal Genetics 48 (2): 237–41. https://doi.org/10.1111/age.12513.
Krishnakumar, Sujatha, Jianbiao Zheng, Julie Wilhelmy, Malek Faham, Michael Mindrinos, and Ronald Davis. 2008. “A Comprehensive Assay for Targeted Multiplex Amplification of Human DNA Sequences.” Proceedings of the National Academy of Sciences 105 (27): 9296–9301. https://doi.org/10.1073/pnas.0803240105.
Kristjánsson, Ólafur H., Bjarne Gjerde, Jørgen Ødegård, and Marie Lillehammer. 2020. “Quantitative Genetics of Growth Rate and Filet Quality Traits in Atlantic Salmon Inferred from a Longitudinal Bayesian Model for the Left-Censored Gaussian Trait Growth Rate.” Frontiers in Genetics 11 (November). https://doi.org/10.3389/fgene.2020.573265.
Meuwissen, T. H., B. J. Hayes, and M. E. Goddard. 2001. “Prediction of Total Genetic Value Using Genome-Wide Dense Marker Maps.” Genetics 157 (4): 1819–29. https://doi.org/10.1093/genetics/157.4.1819.
Misztal, Ignacy, Shogo Tsuruta, Daniela Lourenco, Yutaka Masuda, Ignacio Aguilar, Andres Legarra, and Zulma Vitezica. 2014. “Manual for BLUPF90 Family of Programmes.”
Pandey, Rudresh, Frank Asche, Bård Misund, Rune Nygaard, Olugbenga Michael Adewumi, Hans-Martin Straume, and Dengjun Zhang. 2023. “Production Growth, Company Size, and Concentration: The Case of Salmon.” Aquaculture (Amsterdam, Netherlands) 577 (739972): 739972. https://doi.org/10.1016/j.aquaculture.2023.739972.
Peterson, Brian C., Gary S. Burr, Michael R. Pietrak, and Dina A. Proestou. 2020. “Genetic Improvement of North American Atlantic Salmon and the Eastern Oyster Crassostrea Virginica at the U.s. Department of Agriculture–Agricultural Research Service National Cold Water Marine Aquaculture Center.” North American Journal of Aquaculture 82 (3): 321–30. https://doi.org/10.1002/naaq.10144.
Purcell, Shaun, Benjamin Neale, Kathe Todd-Brown, Lori Thomas, Manuel A. R. Ferreira, David Bender, Julian Maller, et al, 2007. “PLINK: A Tool Set for Whole-Genome Association and Population-Based Linkage Analyses.” American Journal of Human Genetics 81 (3): 559–75. https://doi.org/10.1086/519795.
Rastas, Pasi. 2017. “Lep-MAP3: Robust Linkage Mapping Even for Low-Coverage Whole Genome Sequencing Data.” Bioinformatics (Oxford, England) 33 (23): 3726–32. https://doi.org/10.1093/bioinformatics/btx494.
Sandercock, Alexander M., Michael D. Peel, Cristiane H. Taniguti, Josué Chinchilla-Vargas, Shufen Chen, Manoj Sapkota, Meng Lin, et al, 2025a. “BIGapp: A User-Friendly Genomic Tool Kit Identified Quantitative Trait Loci for Creeping Rootedness in Alfalfa (Medicago Sativa L.).” The Plant Genome 18 (3): e70067. https://doi.org/10.1002/tpg2.70067.
Sandercock, Alexander M., Cristiane H. Taniguti, Josue Chinchilla-Vargas, Dongyan Zhao, Shufen Chen, Meng Lin, Manoj Sapkota, and Team Breeding Insight. 2025b. “Breeding Insight Genomics Functions for Polypoid and Diploid Species.” GitHub. https://github.com/Breeding-Insight/BIGr.
Vallejo, Roger L., Michael R. Pietrak, Melissa M. Milligan, Guangtu Gao, Shogo Tsuruta, Breno O. Fragomeni, Roseanna L. Long, Brian C. Peterson, and Yniv Palti. 2024. “Genetic Architecture and Accuracy of Predicted Genomic Breeding Values for Sea Lice Resistance in the St John River Aquaculture Strain of North American Atlantic Salmon.” Aquaculture 586 (May): 740819. https://doi.org/10.1016/j.aquaculture.2024.740819.
Yáñez, J. M., S. Naswa, M. E. López, L. Bassini, K. Correa, J. Gilbey, L. Bernatchez, et al, 2016. “Genomewide Single Nucleotide Polymorphism Discovery in Atlantic Salmon (Salmo Salar): Validation in Wild and Farmed American and European Populations.” Molecular Ecology Resources 16 (4): 1002–11. https://doi.org/10.1111/1755-0998.12503.
Zhao, Dongyan, Katherine Maria Mejia-Guerra, Marcelo Mollinari, Deborah Samac, Brian Irish, Katarzyna Heller-Uszynska, Craig Thomas Beil, and Moira Jane Sheehan. 2023. “A Public Mid-Density Genotyping Platform for Alfalfa (Medicago Sativa L.).” Genetic Resources 4 (8): 55–63. https://doi.org/10.46265/genresj.EMOR6509.