Biochemical characteristics of bread wheat genotypes related to SSR markers in moisture stress conditions
Fatemeh Bavandpouri*,a, Ezatollah Farshadfara, Kianoosh Cheghamirzaa and Mohsen Farshadfarb
aDepartment of Plant Production and Genetics Engineering, Faculty of Agricultural Sciences and Engineering, Razi University, Kermanshah, Iran
bForests and Rangelands Research Department, Kermanshah Agricultural and Natural Resources Research and Education Center, (AREEO), Kermanshah, Iran
Abstract: Wheat is one of the oldest and most important staple crops worldwide, facing various biotic and abiotic stresses that affect its productivity. This study examines microsatellite markers related to grain yield, biochemical traits and drought tolerance indices in 25 wheat genotypes. The experiment was set up based on the randomized complete block design with three replications under rainfed and irrigated conditions. Combined variance analysis revealed significant differences among genotypes. Principal component analysis identified drought-tolerant genotypes (6, 10, 15, 18, 13, Pishtaz) linked to superior yield, stress indices, and antioxidant activity under rainfed conditions. Polymorphic SSR markers revealed key associations: XCFD168 with catalase, XGWM350 with ascorbic peroxidase (both under rainfed conditions), and XGWM136 with yield in irrigated conditions and multiple stress indices. Marker XGWM410(a1) was associated with yield in both environments, catalase in irrigated conditions, and multiple indices. Marker XGWM2(a2) was linked to yield in irrigated conditions, ascorbic peroxidase in rainfed conditions, and abiotic tolerance index, while XGWM124(a2) was associated with yield, superoxide dismutase in rainfed conditions, and multiple indices. The study identifies these genotypes as top candidates for drought tolerance due to their high yield and optimal biochemical responses under stress. Furthermore, key molecular markers – XCFD168, XGWM350, XGWM136, XGWM124(a2), XGWM410(a1), and XGWM2(a2) – associated with biochemical and yield traits are prioritized for marker-assisted selection to enhance drought tolerance and yield stability in breeding programmes.
Keywords: Antioxidant enzymes, bread wheat, genetic variation, molecular marker
* Corresponding author: Fatemeh Bavandpouri (f.bavandpori@yahoo.com)
Introduction
Wheat (Triticum aestivum L.) contributes to approximately one-third of the global food supply. The Food and Agriculture Organization of the UN (FAO) estimates that by 2050, an annual production of around 840 million tonnes of wheat will be required (Ma et al, 2022). However, wheat production is increasingly affected by various biotic and abiotic stresses that reduce crop yield and productivity. Among these, drought stress stands out as a major abiotic challenge, posing a significant threat to global food security, especially in the context of climate change (Sunil kumar et al, 2023). As a result, there is a critical need to identify and cultivate drought-tolerant, high-yielding genotypes to ensure sustainable food production and meet the demands of a growing global population (Galal et al, 2023). Drought stress in wheat triggers morphological, physiological, biochemical and molecular changes (Gupta et al, 2024; Rashid et al, 2022). Utilizing selection factor indicators can significantly improve the identification of genotypes that perform well in both optimal and stress conditions. A promising strategy to enhance wheat drought tolerance is to improve its antioxidant defense mechanisms (Gupta et al, 2024). Antioxidant enzymes are critical in protecting plants from oxidative damage caused by various environmental stresses.
Molecular markers associated with biochemical parameters can significantly expedite the identification of tolerant genetic materials in breeding programmes. The simple sequence repeat (SSR) marker system is highly effective for detecting significant marker–trait associations in wheat germplasm (Pour-Aboughadareh et al, 2022). SSRs, also known as microsatellites, are short, tandemly repeated DNA sequences (typically 1–6 nucleotides in length) that are distributed genome-wide, exhibiting high polymorphism due to replication slippage in non-coding regions (Ellegren, 2004). Because of their multi-allelic nature, co-dominant inheritance, uniform genomic distribution and simple detection methodology, these markers are widely favoured for assessing genetic variation and analyzing population structures (Jabari et al, 2023; Ahmed et al, 2024).
Exploring the genetic foundations of quantitative traits in crops and understanding the relationship between DNA polymorphisms and phenotypic variations are essential for plant breeding programmes. Identifying quantitative trait loci (QTLs) linked to drought tolerance through marker-assisted selection is particularly important for crop improvement and represents a valuable strategy for boosting wheat yield (Zhao et al, 2023). Multivariate regression analysis (MRA) offers a fast and effective approach for establishing the association between traits and markers. A significant benefit of MRA is its capacity to pinpoint loci associated with quantitative traits. Furthermore, this method is both time-efficient and cost-effective (Vaillancourt et al, 2008) and does not require the creation of specialized populations for mapping.
The genetic diversity of 18 wheat genotypes was evaluated for drought tolerance using 25 microsatellite markers alongside morpho-physiological traits. Findings revealed that integrating these two approaches enhanced the efficiency of the screening process and provided more reliable outcomes for improving drought tolerance in wheat (Ahmed et al, 2023). A study investigating morphological, biochemical and genetic diversity for diagnosing salt tolerance in 18 wheat genotypes using SSR markers highlighted significant findings. The stepwise regression analysis emphasized the importance of root dry matter, relative turgidity and their respective contributions to shoot dry matter. Out of 23 SSR primers analyzed, 17 exhibited polymorphisms (Al-Ashkar et al, 2020). An association analysis performed on wild relatives of wheat in drought stress conditions, using 24 SSR markers, identified eight and nine significant marker-trait associations (MTAs) in control and drought stress conditions, respectively. Notably, two MTAs were consistently observed in both growth conditions (Pour-Aboughadareh et al, 2022). A study on Iranian wheat varieties and landraces employed agronomic traits and drought tolerance indices to identify significant SNP loci associated with drought-tolerance characteristics. The findings revealed that association mapping based on multiple drought tolerance indices can be highly effective in identifying critical markers for drought tolerance and uncovering linked gene networks (Rabieyan et al, 2023). Additionally, a research evaluation combining genetic and phenotypic analyses was conducted to identify drought-tolerant bread wheat genotypes using multivariate analysis techniques, including stepwise multiple linear regression. The results demonstrated that SSR markers were associated with nine agro-physio-biochemical traits, highlighting their utility as a valuable tool in the selection process for drought tolerance (Sallam et al, 2024a).
Despite these advances, very few studies have explored the association between molecular markers and biochemical traits whose activity increases in drought stress. Biochemical traits, like the accumulation of proline or antioxidants, are the measurable physiological responses of a plant to stress. Molecular markers are DNA sequences that can pinpoint the specific genes or genomic regions controlling these biochemical pathways (Oguz et al, 2022). Therefore, this research aimed to: (1) characterize bread wheat genotypes in terms of biochemical traits, grain yield, and drought tolerance indices, (2) analyze the impact of drought stress on wheat traits to enhance yield and drought tolerance, (3) evaluate the genetic diversity of wheat genotypes for drought tolerance using studied traits and SSR markers, and (4) investigate the association between the studied traits and indices with SSR markers and identify informative markers associated with grain yield, biochemical traits, and drought tolerance indices in wheat in both rainfed and irrigated conditions.
Materials and methods
Field experiment
Twenty-five bread wheat genotypes were evaluated, including two cultivars (Pishtaz and Pishgam) as controls, and 23 accessions of bread wheat (Table 1). The genotypes were sourced from the genebank of Karaj Seedling and Seed Breeding Research Institute, Iran. Field experiments were conducted during the 2018–2019 growing season using a randomized complete block design with three replications under rainfed and irrigated conditions in a cold Mediterranean climate (34°21'N, 47°9'E; altitude: 1,319m; mean annual rainfall: 430–460mm) in Iran. Each experimental plot consisted of five rows, each with a length of 2m, row spacing of 23cm, and a planting density of 400 seeds per square metre. The planting date (14 November 2018) coincided with the first irrigation, but no irrigation was provided to the rainfed plots during the growth period. The total rainfall during the experimental year was 401.51mm. For the irrigated treatment, three additional irrigations were applied: The first on 15 May, at the heading stage (50% spike emergence). The second in late May, after full spike emergence. The third on 14 June, during the seed milking stage. No chemical fertilizers were applied during the experiment, and weeding was performed manually.
Molecular experiment
For molecular evaluation of the studied genotypes, 20 pairs of SSR markers were utilized. DNA was extracted from two- to three-week-old seedlings grown from seeds using the cetyltrimethylammonium bromide (CTAB) method, based on the modified protocol of Doyle and Doyle (1987), in bulk. Genomic DNA was extracted from 50 mg of cryogenically homogenized tissue. Samples were suspended in 800μl extraction buffer (100ml containing: 4g CTAB, 16.36g NaCl, 3.15g Tris-HCl, 1.48g EDTA, and 400μl β-mercaptoethanol; pH 8.0) and incubated at 65°C for 30 min. After adding 800μl chloroform-isoamyl alcohol (24:1), samples were vortexed for 60 min, centrifuged (13,000 × g, 15 min), and the aqueous phase was transferred to fresh tubes. This phase was mixed with 500μl cold isopropanol and held at -20°C for 2 hours. Subsequent centrifugation (13,000 × g, 15 min) yielded DNA pellets, which were washed twice with 500μl cold 80% ethanol (brief centrifugation, supernatant removal). Pellets were air-dried and resuspended in 100μl nuclease-free H2O. Extracted genomic DNA was evaluated by 0.8% agarose gel electrophoresis.
Table 1. List of bread wheat planting materials used for the study. IR, Iran; US, United States of America.
|
Genotype number |
Genotype number and name |
Origin |
|
1 |
WC-4924 |
Kalat, IR |
|
2 |
WC-4582 |
Kermanshah, IR |
|
3 |
WC-4592 |
Kermanshah, IR |
|
4 |
WC-47341 |
Montana, US |
|
5 |
WC-4965 |
Kashan, IR |
|
6 |
WC-4840 |
Sarakhs, IR |
|
7 |
WC-4958 |
Badranloo, IR |
|
8 |
WC-47399 |
Bulgaria |
|
9 |
WC-4600 |
Kermanshah, IR |
|
10 |
WC-4987 |
Unknown, IR |
|
11 |
WC-47615 |
Mexico |
|
12 |
WC-4612 |
Kordestan Babrar, IR |
|
13 |
WC-5001 |
Unknown, IR |
|
14 |
WC-4994 |
Unknown, IR |
|
15 |
WC-47638 |
Peru |
|
16 |
WC-47583 |
Canada |
|
17 |
WC-47522 |
Mexico |
|
18 |
WC-47569 |
Minnesota, US |
|
19 |
Pishtaz |
Pishtaz, IR |
|
20 |
Pishgam |
Pishgam, IR |
|
21 |
WC-47640 |
Minnesota, US |
|
22 |
WC-47467 |
Mexico |
|
23 |
WC-4553 |
Kerend, IR |
|
24 |
WC-4583 |
Kermanshah, IR |
|
25 |
WC-4554 |
Kerend, IR |
Polymerase Chain Reaction (PCR) was conducted in three temperature-dependent steps. DNA samples diluted to 10ng/µl were amplified using 20 primer pairs (primer sequences are provided in Table 2). PCR was performed in 20µl reaction volumes using a Bio-Rad thermocycler.
The PCR products were electrophoresed on a 3% agarose gel in 1x TBE buffer, stained with 10µl safe stain. DNA bands were visualized using a Quantum ST4 Gel Documentation system. As not all samples were loaded on the same gel, a 100–1500bp DNA size marker (producing 11 bands) was included. Band presence was scored as ‘1’ and absence as ‘0’, compiling the data into a matrix. Alleles detected in genotypes were designated a, b, c, and d for each marker. This matrix served as the foundation for subsequent statistical analyses based on electrophoretic band pattern.
Biochemical enzyme assays
Measurement methods of the biochemical traits were carried out as follows. Extraction buffer preparation: A 200ml Tris-HCl extraction buffer (pH 8.0) was prepared by dissolving 2.428g of Tris and 0.2g of PVP in 40ml of distilled water. The solution’s pH was then adjusted to 8.0 using HCl, and the final volume was brought to 200ml with distilled water. The prepared buffer was stored at 4°C, protected from light with aluminium foil.
Enzyme extraction: Flag leaf samples were ground into a fine powder in liquid nitrogen. Subsequently, 250mg of the homogenized powder was combined with 1ml of the pre-cooled extraction buffer in a 2ml microtube. The mixture was vortexed for 30 seconds and then incubated at 4°C for 12 hours. During this incubation period, the samples underwent two additional 30-second vortexing steps at 2-hour intervals. Following incubation, the homogenate was centrifuged at 13,000 × g for 15 minutes at 4°C. The resulting clear supernatant was carefully collected for the subsequent analysis of soluble protein content and antioxidant enzyme activities (Ramachandra Reddy et al, 2004). Meanwhile, the BioTek PowerWave XS2 microplate reader was used to measure biochemical traits.
Peroxidase Activity (POD) was assayed according to the method of Chance and Maehly (1995) with slight modifications by combining 6.6μl of diluted enzyme extract (1:4) with 200μl of substrate solution [408.71μl guaiacol + 78.3μl 0.9 M H2O2 in 50mM potassium phosphate buffer (pH 7.0)]. After a 15-minute incubation, absorbance was measured at 470nm every 30s.
Superoxide Dismutase Activity (SOD) was assayed following the method of Beauchamp and Fridovich (1971). The assay solution consisted of 50 mM potassium phosphate buffer (pH 7.8), 12.26mg nitroblue tetrazolium (NBT), 387.92mg L-methionine, 1mM EDTA, and 0.04mM riboflavin (stored in light-protected containers). For the assay, 196, 197, 198, and 199μl of extraction buffer were mixed with 4, 3, 2, and 1μl of diluted enzymatic extract (1:4), respectively, to achieve 200μl reaction mixtures. These mixtures were transferred to a 96-well microplate, followed by addition of 10μl riboflavin solution under dark conditions. After 30 min illumination in a light chamber, absorbance was measured at 560nm.
Catalase Activity (CAT) was assayed according to the method of Sinha (1972) with slight modifications. The assay was performed by combining 1.5μl of diluted enzymatic extract (1:4) with 150μl of 50 mM phosphate buffer (pH 7.0). The reaction was initiated by adding 75μl of 0.32 mM hydrogen peroxide solution. At timed intervals (2, 4, 6 and 8 min post-initiation), 62μl of dichromate reagent was rapidly added to each tube with immediate vortexing. Tubes were transferred to a preheated 95°C water bath for 10 min. After chromogenic development (green-to-yellow gradient), samples were centrifuged at (10,000g, 5 min), and the supernatant absorbance was measured at 570 nm.
Ascorbic Peroxidase Activity (APX) was assayed according to the method of Nakano and Asada (1981). The reaction was initiated by adding 50μl of the enzymatic extract to 1ml of an assay solution containing 50 mM potassium phosphate buffer (pH 7.0), 0.1 mM EDTA, 0.5 mM ascorbic acid (ASA), and 0.15 mM hydrogen peroxide (H2O2). Absorbance at 290 nm was recorded every 10 s for 1 min.
Soluble Protein Concentration (PROTEIN) was determined using the method of Bradford (1976). For the assay, 1μl of the extracted sample was mixed with 200μl of freshly prepared Coomassie Brilliant Blue G-250 dye reagent. After 15 min incubation, absorbance at 595nm was measured, with dye reagent as the blank. Protein concentration was calculated from a bovine serum albumin (BSA) standard curve (0-1,500μg/ml).
Table 2. SSR primers used to assess the genetic diversity of bread wheat genotypes.
|
References |
Band size |
GC% |
TM |
(5'-3') Sequence |
Name |
No. |
|
150bp |
47.6 |
57 |
5' ACCTCATCCACATGTTCTACG 3' |
XGWM350-7D-F |
1 |
|
|
64.7 |
5' GCATGGATAGGACGCCC 3' |
XGWM350-7D-R |
||||
|
100bp |
30 |
50 |
5' AATTTCAAAAAGGAGAGAGA 3' |
XGWM334-6A-F |
2 |
|
|
30 |
5' AACATGTGTTTTTAGCTATC 3' |
XGWM334-6A-R |
||||
|
100bp |
55.6 |
58 |
5' CAATCATTTCCCCCTCCC 3' |
XGWM155-3A-F |
3 |
|
|
36.4 |
5' AATCATTGGAAATCCATATGCC 3' |
XGWM155-3A-R |
||||
|
150bp |
31.8 |
56 |
5' ATGGCATAATTTGGTGAAATTG 3' |
XGWM577-7B-F |
4 |
|
|
36.4 |
5' TGTTTCAAGCCCAACTTCTATT 3' |
XGWM577-7B-R |
||||
|
200bp |
55 |
52.5 |
5' AGTGGCTGGGAGAGTGTCAT 3' |
XGWM70-6B-F |
5 |
|
|
61.6 |
5' GCCCATTACCGAGGACAC 3' |
XGWM70-6B-R |
||||
|
180–200bp |
45 |
58 |
5' ACGGCGAGAAGGTGCTC 3' |
XGWM642-1D-F |
6 |
|
|
64.7 |
5' CATGAAAGGCAAGTTCGTCA 3' |
XGWM642-1D-R |
||||
|
250bp |
57.9 |
52 |
5' GACAGCACCTTGCCCTTTG 3' |
XGWM136-1A-F |
7 |
|
|
52.6 |
5' CATCGGCAACATGCTCAT 3' |
XGWM136-1A-R |
||||
|
200bp |
61.1 |
57.5 |
5' GCCATGGCTATCACCCAG 3' |
XGWM124-1B-F |
8 |
|
|
45 |
5' ACTGTTCGGTGCAATTTGAG 3' |
XGWM124-1B-R |
||||
|
150bp |
45 |
58.5 |
5' TGTTGCGGATGGTCACTATT 3' |
XGWM265-2A-F |
9 |
|
|
52.4 |
5' GAGTACACATTTGGCCTCTGC 3' |
XGWM265-2A-R |
||||
|
250bp |
61.6 |
51 |
5' GCTTGAGACCGGCACAGT 3' |
XGWM410-2B-F |
10 |
|
|
55 |
5' CGAGACCTTGAGGGTCTAGA 3' |
XGWM410-2B-R |
||||
|
200bp |
50 |
50.6 |
5' TGCAGTGGTCAGATGTTTCC 3' |
XGWM165-4B-F |
11 |
|
|
45 |
5' CTTTTCTTTCAGATTGCGCC 3' |
XGWM165-4B-R |
||||
|
250bp |
40 |
52.5 |
5' GCTGATGCATATAATGCTGT 3' |
XGWM4-4A-F |
12 |
|
|
47.6 |
5' CACTGTCTGTATCACTCTGCT 3' |
XGWM4-4A-R |
||||
|
100bp |
45 |
50.7 |
5' GGTTTTCTTTCAGATTGCGC 3' |
XGWM192-5D-F |
13 |
|
|
47.6 |
5' CGTTGTCTAATCTTGCCTTGC 3' |
XGWM192-5D-R |
||||
|
100bp |
26.1 |
46.7 |
5' TCAAAACATAAATGTTCATTGGA 3' |
XGWM233-7A-F |
14 |
|
|
40.9 |
5' TCAACCGTGTGTAATTTTGTCC 3' |
XGWM233-7A-R |
||||
|
250bp |
50 |
49.4 |
5' CTGCAAGCCTGTGATCAACT 3' |
XGWM2-3D-F |
15 |
|
|
35 |
5' CATTCTCAAATGATCGAACA 3' |
XGWM2-3D-R |
||||
|
200bp |
57.9 |
59.5 |
5' TGCCCTGTCCACAGTGAAG 3' |
XCFD5-5B-F |
16 |
|
|
45 |
5' TTGCCAGTTCCAAGGAGAAT 3' |
XCFD5-5B-R |
||||
|
250bp |
55 |
50.6 |
5' TCAGTGGGCAAGCTACACAG 3' |
XGWM129-5A-F |
17 |
|
|
44.4 |
5' AAAACTTAGTAGCCGCGT 3' |
XGWM129-5A-R |
||||
|
250bp |
45 |
56 |
5' CTTCGCAAATCGAGGATGAT 3' |
XCFD168-2D-F |
18 |
|
|
50 |
5' TTCACGCCCAGTATTAAGGC 3' |
XCFD168-2D-R |
||||
|
220–230bp |
50 |
54 |
5' GAGTCCTGATGTGAAGCTGTTG 3' |
XGWM234-5B-F |
19 |
|
|
55 |
5' CTCATTGGGGTGTGTACGTG 3' |
XGWM234-5B-R |
||||
|
100bp |
47.6 |
59 |
5' GGAGTCACACTTGTTTGTGCA 3' |
XGWM33-1A-F |
20 |
|
|
45.5 |
5' CACTGCACACCTAACTACCTGC 3' |
XGWM33-1A-R |
Malon-Dialdehyde (MDA) was determined according to the method of Heath and Packer (1968). Briefly, 0.25g of wheat leaves were homogenized in 500μl ice-cold 1.0% (w/v) trichloroacetic acid (TCA) using a porcelain mortar. The homogenate was centrifuged at 10,000 × g for 5 min at 4°C. Subsequently, 250μl of the supernatant was reacted with 1mL of thiobarbituric acid (TBA) reagent [0.5% (w/v) TBA in 20% (w/v) TCA]. The mixture was incubated at 95°C for 30 min in a water bath, then immediately cooled on ice and centrifuged again (10,000 × g, 10 min, 4°C). A 200μl aliquot of the resulting chromogenic supernatant was transferred to a 96-wall microplate. Absorbance was measured at 532 and 600nm.
Proline Concentration (PC) was determined according to the method of Bates et al (1973). Briefly, 0.05g of fresh leaf tissue was homogenized in 1mL of ice-cold 3% (w/v) sulfosalicylic acid using a pre-chilled mortar. The homogenate was centrifuged at 4,000 × g for 15 min (4°C). A 10μl aliquot of the resulting supernatant was then reacted with 200μl of acid-ninhydrin reagent [1.25 g ninhydrin in 30ml glacial acetic acid + 20ml 6 M phosphoric acid] and 200μl of glacial acetic acid. Tubes were incubated at 95°C for 60 min, immediately cooled on ice for 5 min, and then mixed with 400μl toluene via 30-second vortexing. After a 20-minute phase separation at 25°C, the upper toluene layer was transferred to a 96-well microplate. Absorbance was measured at 520nm with pathlength correction. Proline concentration was determined from a standard curve (0-20μg/ml).
Statistical analysis
Combined variance analysis based on the data obtained from the evaluation of 25 genotypes, including two cultivars and 23 accessions, was performed to determine the contribution of the main effects of genotype, irrigated conditions, and their interaction using SAS 9.1.3 software. A comparison of mean genotypes by the Least Significant Difference (LSD) test was performed. A bar graph related to the mean comparison was drawn in Excel. PCA was calculated based on the means of traits and genotypes. Principal components analysis was carried out using the Minitab16 software, and correlations between the studied traits and indicators were analyzed using the “corrplot” package in R-Studio version 4.5 (R Core Team, 2025). To analyze the differences among the studied genotypes using SSR molecular markers, analysis of molecular variance (AMOVA) was performed by GenAlex software version 6.502. The association between SSR markers, field-measured traits, and biochemical traits was analyzed using stepwise multiple regression in SPSS 26 software. Each quantitative trait was treated as a dependent variable, while the SSR markers served as independent variables. The studied traits and indices were measured in the field and molecular experiment section, as shown in Table 3.
Results
Analysis of combined variance and mean compression
The combined analysis of variance for grain yield and biochemical characteristics is presented in Table 4. Significant differences were observed across various irrigated conditions for all characteristics. Genotypes showed significant variation for all traits except soluble protein. Furthermore, the genotype-by-irrigated interaction effect was significant for most biochemical traits, except for grain yield and malon-dialdehyde.
The mean comparison (mean of three replications) of genotypes based on the studied traits in rainfed and irrigated conditions, presented in the form of a bar graph, is as follows. Genotype 10 showed the highest grain yield under rainfed and irrigated conditions (Figure 1, Chart GY) with values of 424.73 and 565.75, respectively. The maximum peroxidase (POD) activity in rainfed and irrigated conditions was observed in genotype 6 (0.49) and genotype 18 (0.34), respectively (Figure 1, Chart POD). For superoxide dismutase (SOD), the highest values in rainfed and irrigated conditions belonged to genotype 15 (1.02) and genotype 12 (0.64), respectively (Figure 1, Chart SOD). Catalase (CAT) activity was most significant in genotype 12 (3.01) in rainfed conditions and genotype 24 (1.56) in irrigated conditions (Figure 1, Chart CAT). The highest soluble protein content was found in genotype 14 (112.03) in rainfed conditions and genotype 12 (167.09) in irrigated conditions (Figure 1, Chart PROTEIN). Proline (PC) levels were highest in genotype 15 (10.14) in rainfed conditions and genotype 8 (7.24) in irrigated conditions (Figure 1, Chart PC). The maximum ascorbic peroxidase (APX) activity was recorded for genotype 6 (418.12) in rainfed conditions and genotype 15 (263.35) in irrigated conditions (Figure 1, Chart APX). Finally, the highest malondialdehyde (MDA) values in both conditions were observed in genotypes 23 and 24 (0.45) in rainfed conditions and genotype 23 (0.42) in irrigated conditions (Figure 1, Chart MDA). Complete information on the comparison of the mean genotypes for each trait is shown in Table 5.
Assessment of broad-sense heritability and genetic gain of studied traits in rainfed and irrigated conditions
The estimation of broad-sense heritability and genetic gain for grain yield and biochemical traits under rainfed conditions is summarized in Table 6. In rainfed conditions, the average broad-sense heritability and genetic gain for grain yield were 0.278 and 16.08%, respectively. Almost all biochemical traits exhibited heritability above 0.90, including PC (0.998), SOD (0.997), CAT (0.983), and APX (0.972). Among these, PC showed the highest heritability. For genetic gain, CAT (92.022%), SOD (89.91%), APX (67.62%), and PC (63.28%) were most significant, with CAT ranking highest. Under irrigated conditions, heritability and genetic gain for grain yield were 0.604 and 33.20%, respectively. The traits CAT (0.997), protein (0.989), PC (0.979), SOD (0.971), APX (0.966) and POD (0.929) all demonstrated high heritability (> 0.90), with CAT showing the highest value. Also, CAT exhibited the most significant genetic gain (133.7%), followed by SOD (86.9%), PC (83.19%), APX (80.39%). In both conditions, the MDA trait showed the lowest heritability and genetic gain.
Table 3. Measurement methods of the studied traits and indices.
Yi: Yield of a genotype under irrigated conditions;
Yr: Yield of a genotype under rainfed conditions;
: Mean yield of all genotypes under irrigated conditions;
: Mean yield of all genotypes under rainfed conditions;
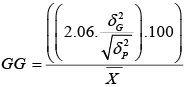
: Genotypic variance;
: Phenotypic variance;
: Overall mean of the trait;
TCP: Trait Changes Percentage;
MTIC: Mean of the trait under irrigated conditions;
MTRC: Mean of the trait under rainfed conditions.
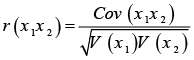
The PIC index for SSR markers was calculated based on allele frequency at each locus across all genotypes. In the calculation of the RP index, Pi refers to the proportion of genotypes that possess a particular band. Cov (x1x2): Covariance between variables x1 and x2. V(x1): variance of one trait (x1). V(x2): variance of other trait (x2).
|
Traits and Indices |
Measurement method and formulas |
|
GY: Grain Yield |
The grain weight from three 1m sections of the middle rows per plot. |
|
ATI: Abiotic Tolerance Index |
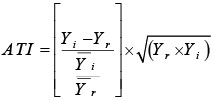
|
|
SSPI: Stress Susceptibility Percentage Index |
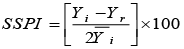
|
|
TOL: Tolerance |
|
|
MP: Mean Productivity |
|
|
GMP: Geometric Mean Productivity |
|
|
HMP: Harmonic Mean Productivity |
|
|
STI: Stress Tolerance Index |
|
|
SSI: Stress Susceptibility Index |
|
|
PEV: Press Evaluation |
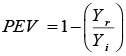
|
|
RDY: Relative Decrease in Yield |
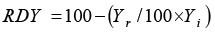
|
|
h2b.s , GG: broad-sense Heritability and |

|
|
Correlation |
|
|
TCP%: percentage of changes in the irrigated environment compared to rainfed for traits (Nourmand-moaied et al, 2001) |
|
|
Polymorphic percentage |
The number of polymorphic bands is divided by the total number of amplified bands and multiplied by 100. |
|
PIC: Polymorphic Information Content Index (Anderson et al, 1993) |
|
|
MI: Marker Index |
The number of polymorphic bands was multiplied with the PIC value. |
|
EMR: Effective Multiplex Ratio Index |
This index was obtained by multiplying the percentage of polymorphic loci by the number of polymorphic loci. |
|
RP: Resolving Power |

|
Table 4. Analysis of combined variance in both rainfed and irrigated conditions for grain yield and biochemical characteristics in 25 bread wheat genotypes. ns, not significant; *, significant at 5% probability level; **, significant at 1% probability level; S.O.V, Source of variations; Error 1, is nesting the replication in the irrigated factor; Error 2, is the total error of the experiment.
|
S.O.V |
df |
Grain yield |
Peroxidase activity |
Superoxide dismutase activity |
Catalase activity |
Soluble protein |
Proline content |
Ascorbic peroxidase |
Malon-dialdehyde |
|
Irrigated |
1 |
470283.30** |
0.37** |
2.58** |
33.22** |
32924.41** |
272.49** |
489561.60** |
0.05** |
|
Error 1 |
4 |
21490.83 |
0.0003 |
0.0002 |
0.0004 |
11.35 |
0.02 |
178.19 |
0.001 |
|
Genotype |
24 |
28250.64** |
0.02** |
0.17** |
1.42* |
1416.56ns |
16.07** |
21384.36* |
0.005** |
|
Genotype× Irrigated |
24 |
6237.08ns |
0.006** |
0.05** |
0.63** |
855.42** |
5.44** |
8793.39** |
0.001ns |
|
Error 2 |
96 |
4496.36 |
0.001 |
0.0003 |
0.005 |
25.39 |
0.04 |
153.87 |
0.001 |
|
(C.V) % |
19.74 |
8.89 |
4.08 |
6.28 |
5.07 |
3.44 |
6.39 |
10.07 |
|

Figure 1. Bar graphs related to the comparison of mean genotypes in rainfed and irrigated conditions. GY, Grain Yield; POD, Peroxidase Activity; SOD, Superoxide Dismutase Activity; CAT, Catalase Activity; PROTEIN, Soluble Protein; PC, Proline Concentration; APX, Ascorbic Peroxidase Activity; MDA, Malon-dialdehyde.
Table 5. Mean comparison of bread wheat genotypes under rainfed and irrigated conditions for the studied traits. G, genotype; R, rainfed; I, irrigated.
|
G |
Grain Yield (g m2) |
Peroxidase Activity |
Superoxide Dismutase Activity (µmol g-1FW) |
Catalase Activity (µmol min-1mg-1protein) |
Soluble Protein (mg g-1 FW) |
Proline Content (mg g-1 FW) |
Ascorbic Peroxidase (µmol min-1mg-1protein) |
Malon-dialdehyde (µmol g-1FW) |
||||||||
|
R |
I |
R |
I |
R |
I |
R |
I |
R |
I |
R |
I |
R |
I |
R |
I |
|
|
G1 |
239.38 |
322.20 |
0.32 |
0.24 |
0.79 |
0.37 |
1.48 |
0.90 |
80.06 |
98.06 |
8.38 |
2.39 |
316.01 |
151.37 |
0.37 |
0.35 |
|
G2 |
238.40 |
526.59 |
0.27 |
0.19 |
0.32 |
0.11 |
2.24 |
0.31 |
66.09 |
162.09 |
4.88 |
3.03 |
213.84 |
113.37 |
0.41 |
0.38 |
|
G3 |
262.82 |
355.60 |
0.28 |
0.26 |
0.59 |
0.29 |
1.17 |
0.12 |
69.76 |
103.06 |
6.07 |
3.60 |
251.30 |
234.07 |
0.39 |
0.37 |
|
G4 |
208.83 |
304.55 |
0.41 |
0.15 |
0.55 |
0.20 |
0.82 |
0.15 |
75.49 |
151.33 |
9.23 |
5.67 |
320.57 |
54.87 |
0.32 |
0.32 |
|
G5 |
261.51 |
353.34 |
0.29 |
0.17 |
0.39 |
0.35 |
0.88 |
0.53 |
75.09 |
120.79 |
3.27 |
1.53 |
276.49 |
175.16 |
0.36 |
0.33 |
|
G6 |
342.69 |
442.37 |
0.49 |
0.32 |
0.70 |
0.33 |
1.80 |
0.15 |
68.96 |
101.36 |
4.02 |
2.14 |
418.12 |
188.34 |
0.39 |
0.34 |
|
G7 |
277.26 |
431.71 |
0.38 |
0.24 |
0.53 |
0.27 |
0.80 |
0.33 |
100.46 |
106.23 |
8.72 |
3.23 |
187.76 |
133.83 |
0.34 |
0.34 |
|
G8 |
338.53 |
358.07 |
0.28 |
0.26 |
0.80 |
0.38 |
1.27 |
0.45 |
85.69 |
116.39 |
8.86 |
7.24 |
263.08 |
189.28 |
0.34 |
0.32 |
|
G9 |
275.12 |
410.24 |
0.37 |
0.22 |
0.55 |
0.33 |
2.71 |
1.41 |
101.79 |
110.73 |
7.59 |
3.71 |
250.79 |
143.65 |
0.34 |
0.31 |
|
G10 |
424.73 |
565.75 |
0.28 |
0.28 |
0.90 |
0.42 |
1.47 |
0.42 |
89.43 |
95.69 |
8.08 |
4.62 |
276.15 |
161.90 |
0.36 |
0.32 |
|
G11 |
201.89 |
317.21 |
0.34 |
0.25 |
0.34 |
0.19 |
0.61 |
0.25 |
90.99 |
131.69 |
3.93 |
2.75 |
176.85 |
133.93 |
0.39 |
0.34 |
|
G12 |
236.94 |
298.98 |
0.28 |
0.14 |
0.70 |
0.64 |
3.01 |
0.43 |
105.99 |
167.09 |
4.96 |
3.97 |
138.82 |
103.03 |
0.38 |
0.36 |
|
G13 |
309.49 |
508.45 |
0.36 |
0.31 |
0.98 |
0.48 |
1.73 |
0.79 |
78.27 |
95.79 |
5.05 |
4.65 |
113.31 |
110.31 |
0.41 |
0.35 |
|
G14 |
263.96 |
482.62 |
0.26 |
0.16 |
0.56 |
0.21 |
1.22 |
0.92 |
112.03 |
126.23 |
7.55 |
3.71 |
271.23 |
153.73 |
0.39 |
0.32 |
|
G15 |
372.95 |
482.01 |
0.34 |
0.23 |
1.02 |
0.32 |
2.58 |
1.22 |
67.43 |
76.73 |
10.14 |
4.28 |
304.86 |
263.35 |
0.42 |
0.40 |
|
G16 |
190.15 |
214.21 |
0.42 |
0.24 |
0.37 |
0.23 |
2.26 |
0.89 |
68.93 |
128.49 |
5.88 |
5.13 |
232.76 |
137.50 |
0.39 |
0.37 |
|
G17 |
319.10 |
354 |
0.27 |
0.25 |
0.93 |
0.43 |
1.61 |
0.86 |
81.96 |
84.19 |
7.09 |
5.86 |
370.74 |
238.03 |
0.44 |
0.36 |
|
G18 |
354.27 |
544.26 |
0.39 |
0.34 |
0.41 |
0.22 |
0.91 |
0.89 |
75.86 |
100.53 |
6.39 |
5.09 |
276.11 |
115.07 |
0.38 |
0.36 |
|
C19 |
318.70 |
492.24 |
0.48 |
0.28 |
0.53 |
0.39 |
1.22 |
0.88 |
65.59 |
76.06 |
7.91 |
1.63 |
382.05 |
96.46 |
0.39 |
0.39 |
|
C20 |
285.14 |
384.01 |
0.35 |
0.26 |
0.56 |
0.35 |
2.76 |
0.60 |
87.53 |
96.66 |
2.75 |
2.06 |
333.49 |
121.35 |
0.36 |
0.35 |
|
G21 |
303.47 |
313.97 |
0.27 |
0.22 |
0.20 |
0.17 |
2.03 |
0.58 |
94.93 |
144.13 |
8.55 |
6.72 |
184.70 |
71.20 |
0.34 |
0.31 |
|
G22 |
197.36 |
331.92 |
0.41 |
0.26 |
0.26 |
0.16 |
0.84 |
0.14 |
94.53 |
124.46 |
8.07 |
2.22 |
98.22 |
77.42 |
0.40 |
0.34 |
|
G23 |
240.30 |
403.74 |
0.33 |
0.26 |
0.56 |
0.17 |
1.87 |
1.13 |
87.19 |
116.59 |
6.76 |
5.43 |
300.27 |
109.35 |
0.45 |
0.42 |
|
G24 |
292.04 |
304.24 |
0.37 |
0.29 |
0.40 |
0.37 |
1.76 |
1.56 |
88.33 |
106.69 |
5.56 |
4.57 |
167.80 |
79.10 |
0.45 |
0.34 |
|
G25 |
293.72 |
391.08 |
0.30 |
0.21 |
0.14 |
0.14 |
0.55 |
0.14 |
101.81 |
113.89 |
10.02 |
7.09 |
155.52 |
68.74 |
0.43 |
0.39 |
|
LSD 5% |
111.12 |
109.03 |
0.06 |
0.02 |
0.02 |
0.04 |
0.16 |
0.04 |
10.94 |
4.14 |
0.19 |
0.39 |
23.50 |
16.65 |
0.06 |
0.06 |
Analysis of trait-index correlations in wheat genotypes under rainfed and irrigated conditions
The correlation patterns between studied traits and drought tolerance indices revealed distinct profiles across conditions. Yield in irrigated conditions (Yi) showed strong positive correlations (p < 0.01) with rainfed Yield (Yr; 0.71) and the indices STI (0.92), MP (0.96), GMP (0.93), HMP (0.91), SSI (0.52), TOL (0.78), ATI (0.90), SSPI (0.78), and PEV (0.52), but exhibited a significant negative association with RDY (-0.92). Similarly, Yr demonstrated strong positive correlations with STI (0.91), MP (0.88), GMP (0.91), and HMP (0.94) (p < 0.01), while having a negative correlation with RDY (-0.91).
In irrigated environments, POD activity correlated positively (p < 0.05) with its rainfed counterpart (0.44) and the indices STI (0.44), MP (0.41), GMP (0.43), and HMP (0.44), yet displayed a negative relationship with RDY (-0.44). SOD enzyme activity showed high consistency between the two conditions (irrigated vs. rainfed: 0.68; p < 0.01). Rainfed SOD further correlated positively with STI (0.43), MP (0.41), GMP (0.43), and HMP (0.44) (p < 0.05) but negatively with RDY (-0.43). CAT activity also followed this pattern with significant concordance between irrigated and rainfed conditions (0.44; p < 0.05).
For PC in irrigated conditions, inverse correlations appeared with STI (-0.50), MP (-0.48), GMP (-0.51), and HMP (-0.53) (p < 0.05/p < 0.01), in contrast to its positive linkage with RDY (0.50; p < 0.05). PC also aligned with its rainfed equivalent (0.51; p < 0.01) and showed negative associations with SSI (-0.47) and PEV (-0.47) (p < 0.05). APX and MDA activities maintained significant consistency between the two conditions (APX: 0.46, MDA: 0.69; p < 0.05/p < 0.01).
Inter-index correlations revealed tightly coupled networks: STI exhibited near-perfect positive alignment with MP (0.99), GMP (0.99), and HMP (0.99) (p < 0.01), moderate ties to ATI (0.69), TOL (0.49), and SSPI (0.49) (p < 0.05), and a complete inverse correlation with RDY (-1.00; p < 0.01). The MP, GMP, and HMP indices showed nearly identical mutual relationships (0.99–1.00; p < 0.01) and positive associations with ATI (0.64–0.74), TOL (0.44–0.56), and SSPI (0.44–0.56) (p < 0.05/p < 0.01), while uniformly opposing RDY (-0.99 to -1.00; p < 0.01).
SSI correlated strongly with PEV (1.00), TOL (0.93), SSPI (0.93), and ATI (0.80) (p < 0.01). TOL demonstrated positive linkages with SSPI (1.00), ATI (0.96), and PEV (0.93) (p < 0.01) but a negative correlation with RDY (-0.49; p < 0.05). ATI correlated positively with SSPI (0.96) and PEV (0.80) (p < 0.01) and negatively with RDY (-0.69; p < 0.01). Finally, SSPI and PEV shared a strong positive correlation (0.93; p < 0.01), while SSPI was inversely associated with RDY (-0.49; p < 0.05) (Figure 2).
Table 6. Estimation of broad-sense heritability and genetic gain for grain yield and biochemical characteristics in bread wheat genotypes in rainfed and irrigated conditions. GY, Grain Yield; POD, Peroxidase Activity; SOD, Superoxide Dismutase Activity; CAT, Catalase Activity; PROTEIN, Soluble Protein; PC, Proline Concentration; APX, Ascorbic Peroxidase Activity; MDA, Malon-dialdehyde.
|
Conditions |
Traits |
Mean |
h2bs |
GG |
|
Rainfed |
GY |
283.75 |
0.278 |
16.08 |
|
POD |
0.340 |
0.750 |
28.74 |
|
|
SOD |
0.560 |
0.997 |
89.91 |
|
|
CAT |
1.58 |
0.983 |
92.022 |
|
|
Protein |
84.57 |
0.791 |
28.044 |
|
|
PC |
6.79 |
0.998 |
63.28 |
|
|
APX |
251.23 |
0.972 |
67.62 |
|
|
MDA |
0.390 |
0.250 |
6.82 |
|
|
Irrigated |
GY |
395.75 |
0.604 |
33.203 |
|
POD |
0.240 |
0.929 |
42.18 |
|
|
SOD |
0.300 |
0.971 |
86.9 |
|
|
CAT |
0.640 |
0.997 |
133.7 |
|
|
Protein |
114.2 |
0.989 |
42.932 |
|
|
PC |
4.09 |
0.979 |
83.19 |
|
|
APX |
136.98 |
0.966 |
80.39 |
|
|
MDA |
0.350 |
0.250 |
5.373 |
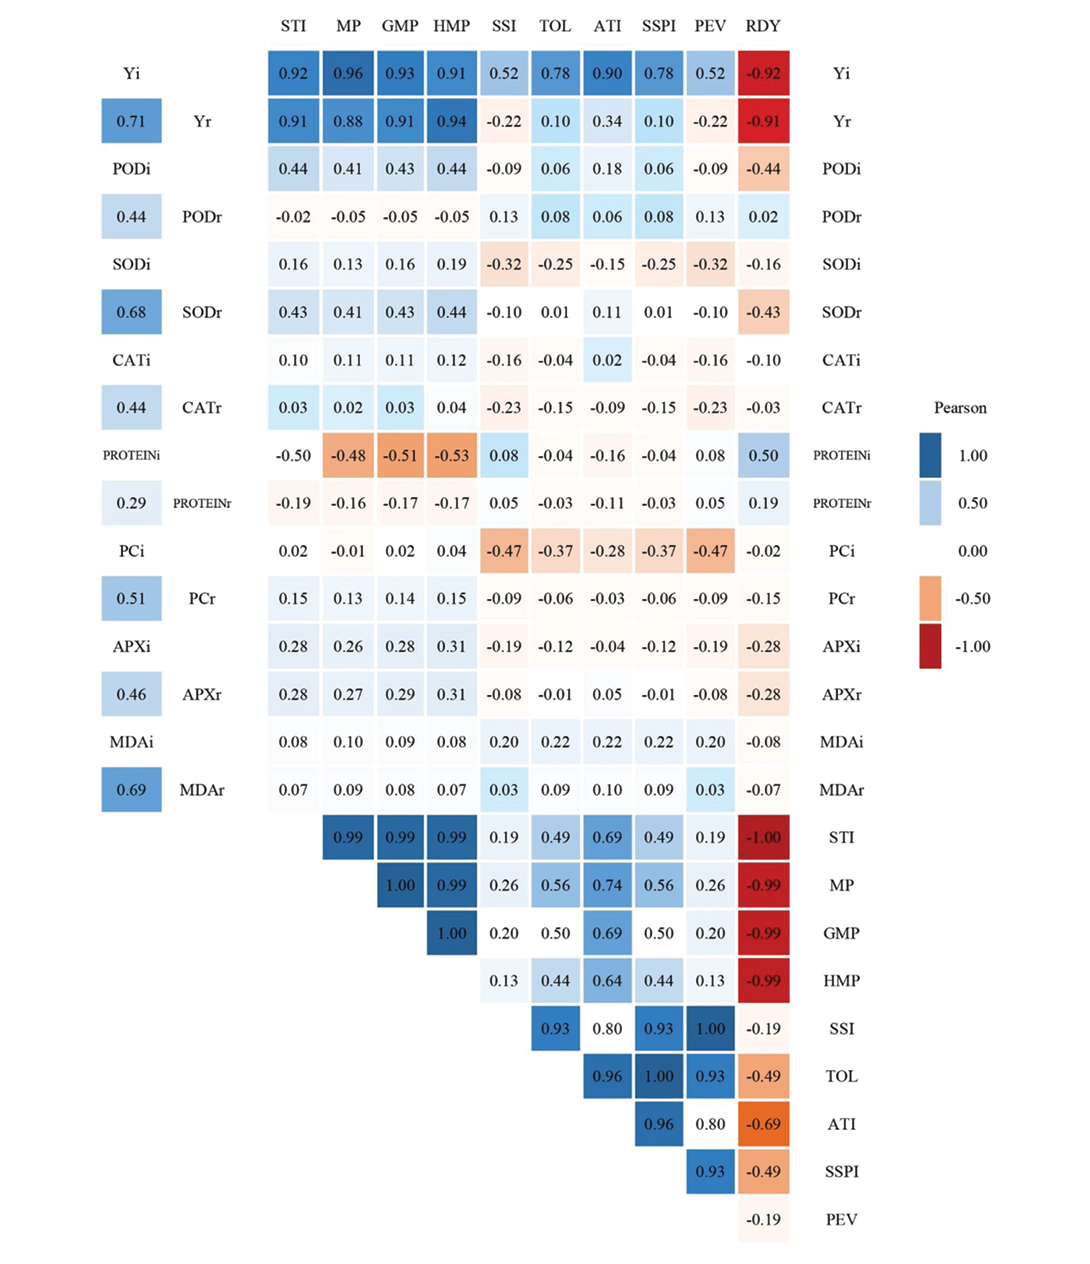
Figure 2. Heatmaps of Pearson’s correlation coefficients between the studied characteristics and drought tolerance indices in 25 wheat genotypes in rainfed and irrigated conditions. Yi, Yield in irrigated conditions; Yr, Yield in rainfed conditions; i, irrigated; r, rainfed; POD, Peroxidase Activity; SOD, Superoxide Dismutase Activity; CAT, Catalase Activity; PROTEIN, Soluble Protein; PC, Proline Concentration; APX, Ascorbic Peroxidase Activity; MDA, Malon-dialdehyde; STI, Stress Tolerance Index; MP, Mean productivity; GMP, Geometric Mean Productivity; HMP, Harmonic Mean Productivity; SSI, Stress Susceptibility Index; TOL, Tolerance; ATI, Abiotic Tolerance Index; SSPI, Stress Susceptibility Percentage Index; PEV, Press Evaluation; RDY, Relative Decrease in Yield. Negative and positive correlations are indicated by red and blue cells, respectively. Color darkness scales with correlation strength (ǀ*r*ǀ) (Significance: *r* ≥ 0.40 at *p* < 0.05*; *r* > 0.50 at **p* < 0.01).
Principal components analysis and biplot graphic display based on drought tolerance indices and studied traits in rainfed conditions
PCA is calculated based on the mean of traits and genotypes. The results of both are shown in Figure 3. The PCA result for traits is presented in Table 7. It demonstrates that the first four components, with eigenvalues greater than one, contributed the most to explaining the variance in the dataset. Specifically, the first component explained 42.303% of the variance. The second component accounted for 21.78%. The third component contributed 9.612%. The fourth component explained 7.353%. Together, these four components explained 81.05% of the variance.
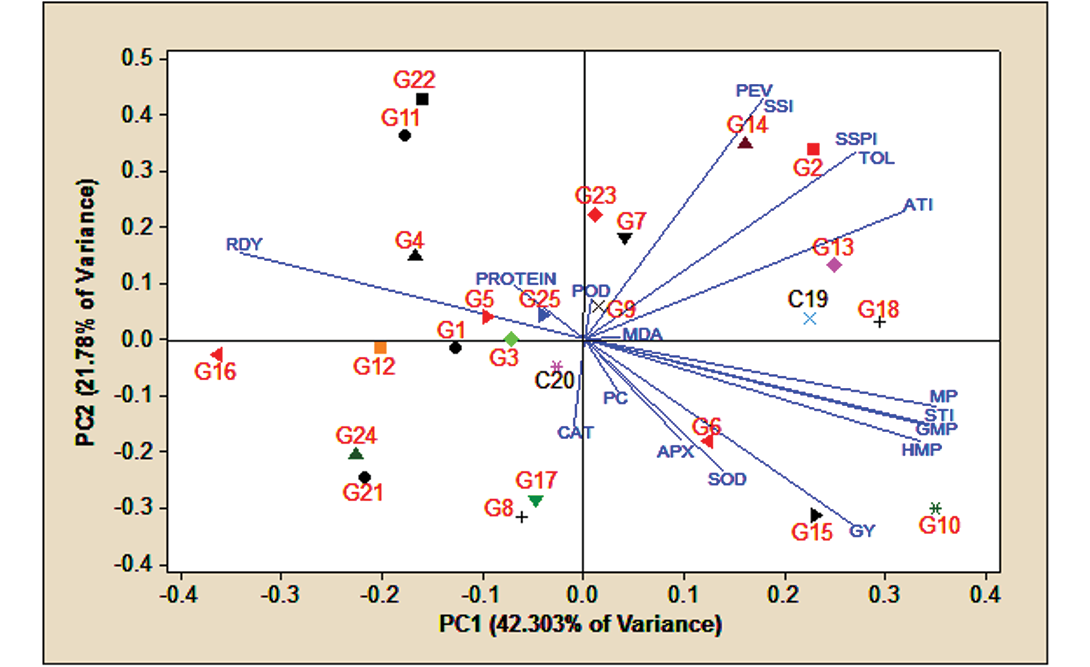
The first component was characterized by positive and high coefficients for the grain yield trait and the MP, GMP, HMP, STI, ATI, TOL and SSPI indices, as well as negative and high coefficients for the RDY index. This component was labelled the drought-tolerant PCA. The second component had positive and high coefficients for the SSI, PEV, TOL, SSPI and ATI indices, along with negative and high coefficients for grain yield and the superoxide dismutase enzyme. This component was referred to as the drought-stress PCA. The third component showed positive and high coefficients for the soluble protein and proline traits, while having negative and high coefficients for the peroxidase and ascorbic peroxidase enzymes. The fourth component was defined by positive and high coefficients for the catalase enzyme activity and malon-dialdehyde traits, and negative and high coefficients for proline and peroxidase enzyme.
According to the data, a biplot of the first two principal components was generated to analyze the traits and indicators under investigation. Based on the biplot (Figure 3), genotypes 10, 15, 6, 18, 13, and the Pishtaz cultivar, which were positioned near the vectors corresponding to the most effective drought tolerance indicators (MP, STI, GMP and HMP), demonstrated high yields in rainfed and irrigated conditions. Furthermore, in rainfed conditions, traits such as grain yield, superoxide dismutase activity, ascorbic peroxidase activity, proline content, malon-dialdehyde levels, and catalase enzyme activity were consistent with group A genotypes (those with high yield in both rainfed and irrigated conditions). Conversely, genotypes 22, 11, 4, 1, 5, 3, 12 and 16 exhibited the lowest levels of drought tolerance based on the selected indices, particularly the RDY index.
Table 7. Principal components analysis of 25 wheat genotypes in rainfed conditions. GY, Grain Yield; POD, Peroxidase Activity; SOD, Superoxide Dismutase Activity; CAT, Catalase Activity; PROTEIN, Soluble Protein; PC, Proline Concentration; APX, Ascorbic Peroxidase Activity; MDA, Malon-dialdehyde; STI, Stress Tolerance Index; MP, Mean productivity; GMP, Geometric Mean Productivity; HMP, Harmonic Mean Productivity; SSI, Stress Susceptibility Index; TOL, Tolerance; ATI, Abiotic Tolerance Index; SSPI, Stress Susceptibility Percentage Index; PEV, Press Evaluation; RDY, Relative Decrease in Yield.
|
Traits and indices |
Component 1 |
Component 2 |
Component 3 |
Component 4 |
|
GY |
0.266 |
-0.330 |
0.085 |
-0.030 |
|
POD |
0.008 |
0.070 |
-0.494 |
-0.344 |
|
SOD |
0.138 |
-0.234 |
-0.124 |
0.170 |
|
CAT |
-0.010 |
-0.153 |
-0.135 |
0.604 |
|
Protein |
-0.069 |
0.097 |
0.592 |
0.077 |
|
PC |
0.034 |
-0.092 |
0.345 |
-0.489 |
|
APX |
0.097 |
-0.178 |
-0.469 |
-0.197 |
|
MDA |
0.036 |
0.005 |
-0.064 |
0.441 |
|
STI |
0.341 |
-0.155 |
0.052 |
-0.023 |
|
MP |
0.349 |
-0.120 |
0.064 |
-0.002 |
|
GMP |
0.342 |
-0.151 |
0.064 |
-0.010 |
|
HMP |
0.334 |
-0.182 |
0.063 |
-0.018 |
|
SSI |
0.179 |
0.429 |
-0.044 |
-0.001 |
|
TOL |
0.270 |
0.332 |
-0.016 |
0.050 |
|
ATI |
0.318 |
0.227 |
-0.009 |
0.055 |
|
SSPI |
0.270 |
0.332 |
-0.016 |
0.050 |
|
PEV |
0.179 |
0.429 |
-0.044 |
-0.001 |
|
RDY |
-0.341 |
0.155 |
-0.052 |
0.023 |
|
Eigenvalues |
7.61 |
3.92 |
1.73 |
1.33 |
|
% of variance |
42.303 |
21.78 |
9.612 |
7.353 |
|
Cumulative % |
42.303 |
64.08 |
73.691 |
81.05 |
Determination of the genetic variability of wheat genotypes based on SSR markers
After evaluating 20 primer pairs across 25 bread wheat genotypes, 16 primers exhibiting high levels of polymorphism. 33 out of 35 total bands, showed high polymorphism, (93.75%). On average, each primer produced 2 bands, with a mean polymorphism of 2 bands per primer. The highest number of alleles was detected with primer XGWM136 (five). The primers XGWM155, XGWM234, XCFD168, XGWM577, XGWM642 and XCFD5 exhibited the highest polymorphic information content indices. Among the molecular indices assessed, the highest marker index values were identified for primers XGWM136, XCFD168 and XGWM350. The primers XGWM136, XGWM350, XCFD168 and XGWM165 recorded the highest Effective Multiplex Ratio. Regarding Resolving Power, the primers XGWM4, XCFD168 and XGWM350 showed the highest values (Table 8). The SSR markers banding pattern generated by the XGWM2, XGWM124, XGWM4, and XCFD5 primers for the wheat genotypes examined in this study is illustrated in Figure 4A–D.
Molecular variance analysis
The molecular variance analysis (AMOVA) for the SSR markers is presented in Table 9. Accordingly, a significant difference between the groups was observed at the 5% probability level. The proportion of variance attributed to intergroup differences was 10%, while intragroup variance accounted for 90%.
Investigating the relationship of studied characteristics and indices with SSR markers
The critical step in this process is assessing the efficiency of linkage markers associated with quantitative traits and identifying informative markers. To pinpoint alleles influencing grain yield, biochemical traits and drought tolerance indices in wheat genotypes under irrigated and rainfed conditions, an association analysis was conducted. This analysis examined the relationship between eight measured traits and ten indices (as dependent variables) and the molecular markers under study (as independent variables) using stepwise multiple regression analysis (Table 10, Table 11 and Table 12). The relationship with SSR markers was analyzed exclusively for characteristics that were statistically significant in the variance analysis.
Table 8. Molecular characteristics of more effective SSR primers in bread wheat genetic diversity in the present study.
|
Marker |
No. of polymorphic bands |
Polymorphic information content |
Marker Index |
Effective multiplex ratio |
Resolving Power |
|
XGWM350 |
3 |
0.337 |
1.011 |
3 |
3.12 |
|
XGWM155 |
1 |
0.499 |
0.499 |
1 |
0.96 |
|
XGWM577 |
2 |
0.467 |
0.934 |
2 |
1.60 |
|
XGWM642 |
1 |
0.461 |
0.23 |
0.5 |
0.72 |
|
XGWM136 |
5 |
0.352 |
1.76 |
5 |
2.32 |
|
XGWM165 |
3 |
0.324 |
0.973 |
3 |
2.96 |
|
XGWM4 |
2 |
0.211 |
0.422 |
2 |
3.52 |
|
XCFD5 |
2 |
0.442 |
0.883 |
2 |
1.76 |
|
XCFD168 |
3 |
0.489 |
1.466 |
3 |
3.20 |
|
XGWM234 |
1 |
0.493 |
0.493 |
1 |
0.88 |
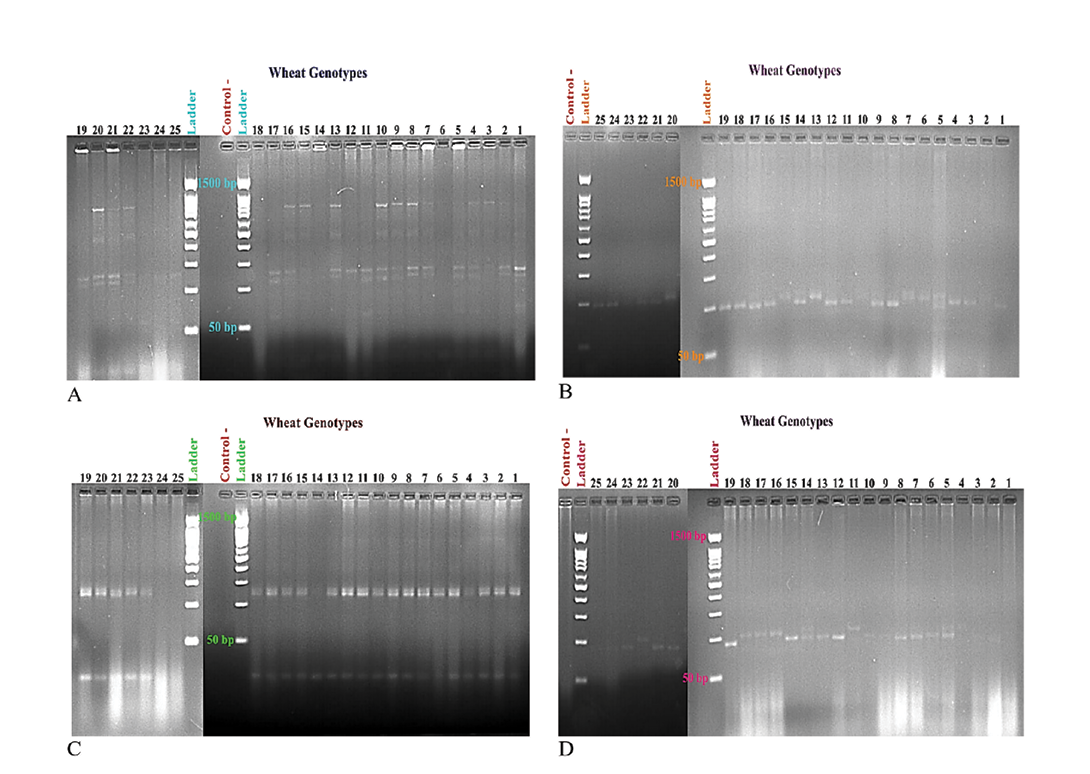
Table 9. Molecular variance analysis (AMOVA) of wheat genotypes. *, significant at 5% probability level.
|
Predicted Group |
Source of variation |
df |
SS |
MS |
Estimated variance |
Percentage of total variance |
φPT |
|
4 |
Among Groups |
3 |
25.85 |
8.62 |
0.68 |
10 |
0.039* |
|
Within Groups |
21 |
126.83 |
6.04 |
6.04 |
90 |
||
|
Total |
24 |
152.68 |
6.72 |
100 |
Grain yield and biochemical characteristics in rainfed conditions
The analysis identified two markers, XGWM124(a2) and XGWM410(a1), as significantly related to yield in rainfed conditions, explaining 34% of the variation (Table 10). Additionally, the marker XGWM124(a2) showed a strong correlation with superoxide dismutase enzyme activity in rainfed conditions, accounting for 12% of the variation. The catalase enzyme activity was notably associated with the marker XCFD168(a3), contributing 16% to the observed variance. Similarly, the ascorbic peroxidase enzyme activity displayed significant associations with three markers (XGWM2(a1), XGWM234(a1), and XGWM350(a2)), collectively explaining 52% of the variance. Moreover, a single locus amplified by the marker XGWM155(a1) was significantly associated with the malon-dialdehyde trait, accounting for 18% of the total variation. Overall, eight gene loci were identified as being associated with yield and biochemical characteristics in rainfed conditions. Notably, the XGWM124(a2) marker was shared between grain yield and the superoxide dismutase enzyme activity, highlighting its importance.
Grain yield and biochemical characteristics in irrigated conditions
The analysis revealed that grain yield was significantly correlated with seven amplified loci, including XGWM577(a2, a1), XGWM136(a3, a4), XGWM265(a1), XGWM410(a1), and XGWM2(a2) (Table 11). Among these, the loci XGWM136(a3), XGWM577(a2), and XGWM410(a1) demonstrated the most significant and positive effects. The marker XCFD5(a2) was significantly associated with the superoxide dismutase trait in irrigated conditions, explaining 17% of the variation. For the catalase enzyme activity, the marker XGWM410(a1) contributed 13% to the total variance. Altogether, nine gene loci were identified as being linked to yield and biochemical characteristics in irrigated conditions. Notably, the XGWM410(a1) marker was shared between grain yield and the catalase enzyme activity, underlining its importance.
Table 10. Markers association with grain yield and biochemical characteristics in rainfed conditions. *, significant at 5% probability level; **, significant at 1% probability level; † a1, a2, a3, a4, and a5 are the average alleles 1, 2, 3, 4, and 5, respectively.
|
Traits |
Marker† |
Regression coefficient (B) |
Standard error (SE) |
t-value |
Significance level |
R2 |
Adjusted R2 |
|
Grain Yield |
Constant |
320.44 |
17.871 |
17.931 |
** |
0.397 |
0.342 |
|
XGWM124(a2) |
-68.482 |
20.944 |
-3.27 |
** |
|||
|
XGWM410(a1) |
52.57 |
22.02 |
2.39 |
* |
|||
|
Ascorbic Peroxidase |
Constant |
84.99 |
43.78 |
1.94 |
ns |
0.583 |
0.523 |
|
XGWM2(a1) |
120.18 |
30.36 |
3.96 |
** |
|||
|
XGWM234(a1) |
-80.304 |
24.72 |
-3.25 |
** |
|||
|
XGWM350(a2) |
114.60 |
44.99 |
2.55 |
* |
|||
|
Malon-dialdehyde |
Constant |
0.402 |
0.009 |
43.67 |
** |
0.217 |
0.183 |
|
XGWM155(a1) |
-0.034 |
0.013 |
-2.53 |
* |
|||
|
Catalase Activity |
Constant |
1.24 |
0.197 |
6.27 |
** |
0.193 |
0.158 |
|
XCFD168(a3) |
0.62 |
0.264 |
2.35 |
* |
|||
|
Superoxide Dismutase Activity |
Constant |
0.716 |
0.086 |
8.34 |
** |
0.161 |
0.124 |
|
XGWM124(a2) |
-0.212 |
0.101 |
-2.1 |
* |
Table 11. Markers association with grain yield and biochemical characteristics in irrigated conditions. *, significant at 5% probability level; **, significant at 1% probability level; † a1, a2, a3, a4, and a5 are the average alleles 1, 2, 3, 4, and 5, respectively..
|
Traits |
Marker† |
Regression coefficient (B) |
Standard error (SE) |
t-value |
Significance level |
R2 |
Adjusted R2 |
|
Grain Yield |
Constant |
374.72 |
12.76 |
29.37 |
** |
0.885 |
0.838 |
|
XGWM577(a2) |
145.7 |
19.04 |
7.653 |
** |
|||
|
XGWM136(a3) |
171.744 |
33.4 |
5.143 |
** |
|||
|
XGWM265(a1) |
-122.541 |
26.084 |
-4.7 |
** |
|||
|
XGWM410(a1) |
89.64 |
18.29 |
4.902 |
** |
|||
|
XGWM2(a2) |
-62.8 |
18.43 |
-3.41 |
** |
|||
|
XGWM577(a1) |
-58.85 |
16.294 |
-3.612 |
** |
|||
|
XGWM136(a4) |
-79.04 |
29.13 |
-2.713 |
* |
|||
|
Superoxide Dismutase Activity |
Constant |
0.233 |
0.036 |
6.513 |
** |
0.206 |
0.171 |
|
XCFD5(a2) |
0.113 |
0.046 |
2.44 |
* |
|||
|
Catalase Activity |
Constant |
0.55 |
0.089 |
6.13 |
** |
0.163 |
0.126 |
|
XGWM410(a1) |
0.39 |
0.183 |
2.12 |
* |
Drought tolerance indices
The analysis identified a significant correlation between the ATI index and six amplified loci: XGWM136(a3, a4), XGWM577(a2), XGWM2(a2), XGWM410(a1) and XGWM265(a1), collectively explaining 84% of the total variance (Table 12). The TOL and SSPI indices were significantly associated with the markers XGWM136(a3, a4), XGWM265(a2), XGWM577(a2) and XGWM165(a2), accounting for 72% of the variation. Additionally, the MP, GMP and HMP indices demonstrated strong associations with three loci amplified by the markers XGWM124(a2), XGWM410(a1) and XGWM165(a1), explaining 57%, 57% and 56% of the total variation, respectively. The SSI and PEV indicators were significantly linked to the markers XGWM136(a3, a4) and XGWM265(a2), accounting for 51% of the variance. Furthermore, the STI and RDY indices showed significant associations with two loci amplified by the markers XGWM124(a2) and XGWM410(a1), each explaining 48% of the variation. Among these, the XGWM410(a1) marker exhibited the most substantial positive effect on the STI index, while the XGWM124(a2) marker had the strongest impact on the RDY index. Overall, 35 gene loci were identified for the drought tolerance indicators, with 10 gene loci being common across all measured indices.
Discussion
Significant differences in most of the studied characteristics highlighted the genetic diversity among wheat genotypes. This diversity suggests the potential to select superior cultivars based on grain yield and biochemical characteristics in rainfed and irrigated conditions. In addition, based on the percentage of changes in the irrigated environment compared to rainfed (TCP%), grain yield and soluble protein increased under irrigated conditions and decreased with stress. But on the other hand, the activity of peroxidase, superoxide dismutase, catalase, proline content, ascorbic peroxidase and malon-dialdehyde increased with stress, and the increase in the activity of these biochemical compounds aligns with enhanced stress resistance and reduced stress-induced damage. Therefore, the presence of a better antioxidant enzyme system, as evidenced by higher POD, SOD, CAT and APX activities in drought-tolerant wheat genotypes, could indicate that these genotypes are more efficient in removing superoxide anions produced in plants due to drought stress. Similarly, Saed-Moucheshi et al (2019) reported significant differences among genotypes for all yield and biochemical traits in triticale under regular irrigation and drought stress conditions. Furthermore, they observed significant increases in proline, malon-dialdehyde, protein content and antioxidant enzyme activities in response to drought stress, which aligns with the findings of this study. In a study by Pour-Aboughadareh et al (2022) evaluating biochemical traits in wild relatives of wheat under drought stress, ANOVA results revealed significant variations across growth conditions, except for dry matter in control and drought stress environments. Additionally, the activities of all antioxidant enzymes increased compared to the control conditions, which is consistent with current research.
Table 12. Markers association with drought tolerance indices of wheat genotypes. *, significant at 5% probability level; **, significant at 1% probability level; †, a1, a2, a3, a4, and a5 are the average alleles 1, 2, 3, 4, and 5, respectively. STI, Stress Tolerance Index; MP, Mean productivity; GMP, Geometric Mean Productivity; HMP, Harmonic Mean Productivity; SSI, Stress Susceptibility Index; TOL, Tolerance; ATI, Abiotic Tolerance Index; SSPI, Stress Susceptibility Percentage Index; PEV, Press Evaluation; RDY, Relative Decrease in Yield.
|
Indices |
Marker† |
Regression coefficient (B) |
Standard error (SE) |
t-value |
Significance level |
R2 |
Adjusted R2 |
|
ATI |
Constant |
21398.56 |
2357.34 |
9.08 |
** |
0.881 |
0.841 |
|
XGWM136(a3) |
38568.94 |
6801.55 |
5.67 |
** |
|||
|
XGWM577(a2) |
23254.62 |
3825.74 |
6.08 |
** |
|||
|
XGWM2(a2) |
-18557.49 |
3870.85 |
-4.79 |
** |
|||
|
XGWM410(a1) |
16573.71 |
3837.98 |
4.32 |
** |
|||
|
XGWM265(a1) |
-17499.84 |
5480.78 |
-3.19 |
** |
|||
|
XGWM136(a4) |
-17941.44 |
5977.63 |
-3 |
** |
|||
|
SSPI |
Constant |
17.01 |
2.07 |
8.23 |
** |
0.775 |
0.716 |
|
XGWM136(a3) |
26.8 |
4.25 |
6.31 |
** |
|||
|
XGWM136(a4) |
-13.24 |
3.5 |
-3.79 |
** |
|||
|
XGWM265(a2) |
-4.67 |
2.1 |
-2.22 |
* |
|||
|
XGWM577(a2) |
5.81 |
2 |
2.91 |
** |
|||
|
XGWM165(a2) |
-5.56 |
2.22 |
-2.5 |
* |
|||
|
TOL |
Constant |
134.65 |
16.35 |
8.24 |
** |
0.775 |
0.716 |
|
XGWM136(a3) |
212.14 |
33.63 |
6.31 |
** |
|||
|
XGWM136(a4) |
-104.84 |
27.68 |
-3.79 |
** |
|||
|
XGWM265(a2) |
-36.93 |
16.6 |
-2.23 |
* |
|||
|
XGWM577(a2) |
46 |
15.81 |
2.91 |
** |
|||
|
XGWM165(a2) |
-43.99 |
17.59 |
-2.502 |
* |
|||
|
MP |
Constant |
393.77 |
17.393 |
22.64 |
** |
0.619 |
0.565 |
|
XGWM124(a2) |
-87.581 |
20.85 |
-4.201 |
** |
|||
|
XGWM410(a1) |
61.89 |
21.85 |
2.833 |
** |
|||
|
XGWM165(a1) |
-72.78 |
34.633 |
-2.101 |
* |
|||
|
GMP |
Constant |
386.27 |
16.91 |
22.85 |
** |
0.619 |
0.565 |
|
XGWM124(a2) |
-84.36 |
20.27 |
-4.163 |
** |
|||
|
XGWM410(a1) |
59.544 |
21.24 |
2.804 |
* |
|||
|
XGWM165(a1) |
-73.03 |
33.67 |
-2.17 |
* |
|||
|
HMP |
Constant |
378.97 |
16.64 |
22.78 |
** |
0.613 |
0.558 |
|
XGWM124(a2) |
-81.242 |
19.94 |
-4.074 |
** |
|||
|
XGWM410(a1) |
57.29 |
20.89 |
2.742 |
* |
|||
|
XGWM165(a1) |
-73.24 |
33.13 |
-2.211 |
* |
|||
|
SSI |
Constant |
1.11 |
0.121 |
9.16 |
** |
0.575 |
0.514 |
|
XGWM136(a3) |
1.36 |
0.262 |
5.2 |
** |
|||
|
XGWM136(a4) |
-0.824 |
0.231 |
-3.56 |
** |
|||
|
XGWM265(a2) |
-0.309 |
0.147 |
-2.1 |
* |
|||
|
PEV |
Constant |
0.314 |
0.034 |
9.16 |
** |
0.575 |
0.514 |
|
XGWM136(a3) |
0.386 |
0.074 |
5.2 |
** |
|||
|
XGWM136(a4) |
-0.233 |
0.065 |
-3.57 |
** |
|||
|
XGWM265(a2) |
-0.087 |
0.042 |
-2.1 |
* |
|||
|
STI |
Constant |
0.968 |
0.081 |
11.89 |
** |
0.526 |
0.483 |
|
XGWM124(a2) |
-0.416 |
0.095 |
-4.36 |
** |
|||
|
XGWM410(a1) |
0.294 |
0.1 |
2.93 |
** |
|||
|
RDY |
Constant |
-1416.28 |
127.5 |
-11.11 |
** |
0.526 |
0.483 |
|
XGWM124(a2) |
650.93 |
149.42 |
4.36 |
** |
|||
|
XGWM410(a1) |
-460.43 |
157.09 |
-2.93 |
** |
In a study on 20 bread wheat cultivars under water stress and non-stress conditions, water stress caused a significant 54.9% reduction in grain yield and reductions in all studied traits except grain protein content (Al-Naggar et al, 2020), contrasting with the present study regarding protein content. Similarly, Firouzian et al (2023) reported that stress reduced yield components, physiological traits, and ultimately decreased grain yield by about 25% in bread wheat, while, in the present study, drought stress reduced grain yield by 28.3%. In a study investigating terminal heat stress effects on wheat cultivars, variance analysis of phenological traits, grain yield and biochemical traits showed significant variations in genotypes, environments, and genotype × environment interactions (for grain yield, SOD, POD, APX, CAT and proline) (Kumar et al, 2023a). In the present study, variance analysis also revealed significant variations for grain yield and all biochemical traits in the environment effect, for all traits except soluble protein in the genotype effect, and for all traits except grain yield and malon-dialdehyde in the interaction effects. Similarly, in a study by Mkhabela et al (2019) investigating drought-tolerant wheat genotypes under drought stress and non-stress conditions, the effects of genotype, stress condition, and genotype × stress condition interaction were significant for the tested traits, indicating differential genotypic responses to selection, in agreement with this study.
Estimating heritability helps plant breeders identify elite genotypes (Farshadfar, 2010). Likewise, genetic advancement reflects the mean genotypic value relative to the parental population and serves as an indicator of the genetic gain achieved through selection (Kumar et al, 2023b). High broad-sense heritability suggests that the trait is minimally influenced by environmental factors. However, modifying such a trait may be less beneficial, as broad-sense heritability encompasses the total genetic variance, including additive (fixable), dominance and epistasis (non-fixable) variances. On the other hand, high genetic advance or genetic gain indicates that the trait is primarily governed by additive genes, making selection a practical approach for improvement. Conversely, low genetic advance or gain suggests that the trait is controlled by non-additive genes, in which case heterosis breeding would be a more effective strategy (Farshadfar, 2010; Kaur et al, 2023). Traits with heritability (h² > 60.0%) and genetic gain (GG > 20.0%) indicate that the observed variation is predominantly due to genetic factors, thereby making these traits reliable candidates for selection (Faysal et al, 2022; Kaur et al, 2023), which in the present study also included most biochemical traits with heritability above 90% and genetic gain above 30%. This indicates the high influence of genetic factors and aligns with the aforementioned findings. In summary, this study showed that broad-sense heritability and genetic gain for catalase, superoxide dismutase activity, proline content and ascorbic peroxidase activity were high under both irrigated and rainfed conditions, and were lowest for malon-dialdehyde. Therefore, it is recommended to use these traits as ideal criteria, along with yield, to select high-yielding genotypes in breeding programmes. In research on bread wheat genotypes, moderate heritability values and high genetic gain for grain yield were recorded, suggesting these traits are promising targets for improvement through favorable selection (Amare, 2023). In the present study, moderate broad-sense heritability and genetic gain were obtained for grain yield. Similarly, in the study by Saed-Moucheshi et al (2019), grain yield showed heritability values of 32.14% and 29.62% under normal irrigation and drought stress conditions, respectively, indicating environmental influence. Additionally, SOD and MDH showed the highest heritability under both conditions, while in the present study, CAT, SOD, PC and APX showed the highest heritability, and MDA the lowest heritability in both environmental conditions. The heritability of grain yield was 27.8% and 60.4% in rainfed and irrigated conditions, respectively. In studies by Shah et al (2019) on bread wheat under rainfed conditions and Sallam et al (2024b) on bread wheat under heat stress, the traits grain protein content, proline and catalase, respectively, showed high heritability and genetic gain, consistent with the study. Additionally, various researchers have utilized broad-sense heritability (Li et al, 2023; Sowadan et al, 2024) and genetic gain (Yusuf et al, 2021; Dukamo et al, 2023) to examine genetic variability and identify suitable traits for breeding programmes, aligning with the study’s findings regarding the importance of these parameters.
These indices are used to calculate the level of drought tolerance in plants. Different indices are designed based on different traits that are related to grain yield. These indices are used in different agronomic, biochemical, molecular and even cytogenetic categories to select the best genotype. The correlation heatmaps were created to analyze the relationships between studied traits and drought tolerance indices in rainfed and irrigated conditions. Based on the nature of the indicators, it was observed that most of the studied traits showed a highly significant correlation with indices such as STI, MP, GMP, HMP and RDY. These indicators were identified as the most effective for selecting drought-tolerant and high-performing genotypes. Additionally, these indices had a strong influence on the first principal component, which was identified as the drought tolerance component. Similar to the present study, Reddy et al (2023), used correlation heatmaps to examine the relationship between phenotypic traits and drought tolerance indices such as STI, MP, and GMP. Also, in the study by Giovenali et al (2023), Pearson correlation coefficients were analyzed using heatmaps to investigate the relationships between yield-related traits, physiological parameters and biochemical parameters, and significant positive and negative correlations were obtained. In a related study, correlation heatmaps were employed to explore the relationships between phenological, physiological and biochemical variables in optimal conditions, heat stress conditions, prolonged heat stress conditions, and a combined environment. In optimal conditions, the correlation between seed yield and the APX and CAT traits was positive but not statistically significant. In heat stress conditions, a positive and significant correlation was observed between seed yield and the traits proline and SOD. When heat stress was prolonged, the correlation between seed yield and CAT became negative and was not significant. However, in high-temperature conditions, seed yield demonstrated a positive and significant correlation with proline, SOD and POD, while its relationship with APX remained positive but non-significant (Kumar et al, 2023a). In the present study, CAT and APX did not show statistically significant correlations with any of the drought tolerance indices. Under irrigation conditions, there was a significant negative correlation between PC and the SSI and PEV indices. There was also a significant positive correlation between POD and the STI, MP, GMP and HMP indices, and a significant negative correlation with the RDY index. Under rainfed conditions, the correlation of SOD with the STI, MP, GMP and HMP indices was positive and significant, and with the RDY index was negative and significant.
Principal component analysis (PCA), a multivariate statistical method, serves as an efficient approach to data reduction by identifying strong correlations among variables to derive clear conclusions. In this study, PCA and biplot visualization were applied to analyze traits across 25 bread wheat genotypes under rainfed conditions. The first two principal components (PC1 and PC2) accounted for 64.08% of the total variation in drought tolerance indices and studied traits. Biplot visualization revealed considerable genetic diversity among genotypes in response to drought stress. These findings align with existing literature: Pour-Aboughadareh et al (2022) reported PC1 and PC2 explaining 64.52% of biochemical variation in wild wheat species under drought (PC1 = 47.86%; PC2 = 16.66%). Sallam et al, (2024a) identified four principal components (eigenvalues >1) capturing 89.79% of variance across 30 agro-physio-biochemical traits. PC1 correlated with 24 traits (e.g. grain yield, catalase, peroxidase, superoxide dismutase and proline), PC2 with five traits (e.g. soluble protein), PC3 showed no significant associations, and PC4 linked to glycine betaine. Similarly, in the present study, the first four principal components explained 81.05% of total variance: PC1 (grain yield and drought-tolerance indices), PC2 (drought-stress indices), PC3 (soluble protein and proline), and PC4 (catalase activity and malon-dialdehyde).
Of the 20 SSR markers tested, 16 showed significant polymorphism. Genetic diversity assessment of bread wheat genotypes utilizing SSR markers revealed XCFD168, XGWM350 and XGWM136 as fully polymorphic (100%). These markers demonstrated the highest allele counts and superior performance across key genetic indices: polymorphism information content (PIC), marker index (MI), effective multiplex ratio (EMR), and resolving power (RP) (Table 8). Consequently, these represent optimal candidates for advanced wheat genetic analyses. Notably, the significant discriminatory power achieved with limited primer sets confirms that highly polymorphic SSRs efficiently differentiate both individual accessions and population subgroups. These findings corroborate prior research identifying the same three markers as exceptionally informative. For instance, the marker XGWM136 was similarly highlighted by Budak et al (2013) and Kaur et al (2016), while Khan et al (2021) identified XGWM136 and XCFD168, and Haque et al (2020) emphasized XGWM350, collectively supporting their utility as reported in this study. In genomic diversity research on bread wheat using SSR markers, markers XGWM136, XCFD168, XGWM2, XGWM155, XCFD5, XGWM165, XGWM33 and XGWM129 were used (Ahmed et al, 2020), consistent with the marker selection in this study. Additionally, research on bread wheat genetic diversity revealed high PIC and marker index, showing greater diversity in the A and B genomes compared to the D genome (Feltaous, 2019). In the present study, more diversity was observed in the B genome, followed by D and A. In another study, 17 bread wheat genotypes evaluated with 16 SSR markers showed only 11 markers with high polymorphism and reproducibility (Kara et al, 2020). Similarly, a study assessing the genetic diversity and population structure of wheat genotypes employed ten SSR markers to characterize diversity across 22 genotypes (Hassan et al, 2025). Here, 25 bread wheat genotypes examined with 20 SSR markers revealed 16 with significant polymorphism. Regarding PIC values and marker utility, these findings align with prior reports. For example: in SSR evaluation of bread wheat, the PIC ranged from 0.276 to 0.541 (average: 0.384), using primers XGWM192 and XGWM642 (Islam et al, 2012). Three subsequent studies (El-Rawy and Hassan, 2021; Ahmed et al, 2024; Bavandpouri et al, 2025) reported a PIC range of 0.20–0.50 (average: 0.33). El-Rawy and Hassan (2021) utilized primers XGWM165, XGWM155, and XGWM577, with XGWM577 showing superior performance. Bavandpouri et al (2025) introduced three markers – namely XCFD168, XGWM350, and XGWM136 – as the most significant; while Ahmed et al (2024) highlighted XGWM642. In a separate analysis of ten bread wheat genotypes using ten SSR markers, Kumari et al (2025) detected 64 polymorphic bands, where alleles per locus ranged from 1 to 4 (highest for XGWM2 and XGWM265). In the present study, 33 out of 35 bands were polymorphic. The highest number of alleles (five) was observed for primer XGWM136, while the lowest number (two alleles) was recorded for primers XGWM155, XGWM410 and XGWM234. Collectively, these findings confirm SSR markers as reliable indirect selection tools for more efficient cultivar improvement.
Genetic structure within populations is commonly analyzed through variance analysis, where the variance between and within groups is determined based on the genetic distances among individuals. AMOVA is particularly effective in partitioning variance in wild species and among groups of cultivars originating from different regions (Farshadfar, 2023). The results of AMOVA revealed that the observed grouping of bread wheat genotypes could, to some extent, be explained by the diversity in SSR marker bands. The φPT statistic is employed as a criterion to test the assumption of population differentiation at the relevant level. In this experiment, AMOVA indicated that the φPT statistic was low due to the high genetic diversity observed within the populations. Similar findings were reported in a study investigating the genetic diversity of bread wheat using ISSR and SSR markers, where AMOVA for both types of markers revealed that genetic variation within species surpassed the genetic diversity among them (Jabari et al, 2023). Additionally, in another study, AMOVA results demonstrated that 19% of the total genetic variation occurred among subpopulations, while the remaining 81% was attributed to individual differences within each subpopulation (Sowadan et al, 2024).
In drought tolerance research, pinpointing QTLs linked to drought-responsive traits is pivotal for deciphering their genetic mechanisms (Sallam et al, 2019). To identify relevant SSR markers, regression analysis was conducted between grain yield and biochemical traits under rainfed and irrigated conditions, with ten drought tolerance indices as dependent variables and marker gene locations as independent variables. Results revealed significant trait–primer relationships. A key advantage of this multivariate regression approach is its efficiency in QTLs detection, reducing time and cost while eliminating the need for mapping populations (Ruan et al, 2009). This study specifically aimed to identify alleles correlated with grain yield and biochemical traits as informative markers. Outcomes supporting this objective are detailed in Table 10, Table 11 and Table 12. Critical associations include: XCFD168 marker showing strong correlation with catalase activity under rainfed conditions; XGWM350 linked to ascorbic peroxidase activity (rainfed); and XGWM136 associated with yield under irrigated conditions and ATI, TOL, SSPI, SSI and PEV indices. Notably, XGWM410(a1) correlated with yield in both environments, catalase activity under irrigation, and multiple indices; XGWM2(a2) tied to irrigated yield, rainfed ascorbic peroxidase activity, and ATI; while XGWM124(a2) demonstrated associations with yield, rainfed superoxide dismutase activity, and several indices. In a study investigating associations between biochemical traits and stress tolerance indices in wheat under drought using 24 SSR markers, two markers were linked to APX and three to CAT in control conditions, whereas under drought stress, two markers associated with APX and one with POD, alongside two markers significantly correlated with the STI index. These results suggest genomic regions governing growth and developmental characteristics across conditions (Pour-Aboughadareh et al, 2022). Comparatively, in the current study, biochemical trait analysis revealed one marker correlated with SOD and one with CAT under irrigation, while under rainfed conditions, one marker associated with SOD, one with CAT, three with APX and one with MDA. Regarding STI index, consistent with Pour-Aboughadareh et al (2022), two markers showed significant correlations. In a linkage mapping study for photosynthesis and yield traits under moisture stress and drought indices (SSI and STI) in winter bread wheat, 28 linkages were identified for drought tolerance indices, with one marker consistently associated across two seasons (Saeed et al, 2017). Here, 35 linkages emerged for drought indices, four of which were associated with both SSI and STI. El-Rawy and Hassan (2021) reported SSR markers XGWM260 and XGWM573 as specific to drought-tolerant bread wheat genotypes (low DSI values), suggesting marker-trait associations for drought tolerance. In contrast, our study identified XGWM136 and XGWM265 as significantly associated with SSI. Negisho et al (2022) detected 184 marker-trait associations (MTAs) for drought indices in Ethiopian durum wheat, with six MTAs (on chromosomes 2B, 3B, 4A, 5B and 6B) positively affecting GY-GMP. Notably, 41 MTAs (22.28%) associated with ≥ 2 indices, of which 16 (39.02%) linked to GMP and STI. Similarly, we identified an MTA positively affecting GMP on chromosome 2B, along with 35 gene loci for drought indices –10 (28.57%) common to all indices, with 30% of stable MTAs associated with GMP and STI. Across these studies, a positive regression coefficient indicates that selecting genotypes harbouring such alleles may enhance yield and drought tolerance.
The association between individual markers and multiple traits may arise from pleiotropic effects or overlapping QTLs influencing diverse characteristics. Primers such as XGWM136, XGWM234 and XCFD168 – previously used to investigate grain yield and agronomic traits relationships via SSR markers with potential for heat-tolerance breeding (Khan et al, 2021) – were similarly employed in this study, with XCFD168 and XGWM136 emerging as superior markers. Consistent with our findings, numerous studies report significant yield-marker associations: Maccaferri et al (2011) established XGWM410–yield relationships; Amalova et al (2024) documented correlations between grain yield and XGWM124. Bavandpouri et al (2025) reported significant relationships between XGWM265 and grain yield under irrigated conditions, and between XGWM410, XGWM577, and XGWM124 markers and grain yield under both rainfed and irrigated conditions, while Eldemery et al (2022) and Firouzian et al (2023) observed XGWM577–yield linkages under heat stress. Concurrently, XGWM165 – also utilized here – showed notable associations with SSPI, TOL, MP, GMP, and HMP indices, aligning with our results and collectively reinforcing these outcomes. Ultimately, this research confirms that molecular markers exhibiting strong regression coefficients for biochemical traits and drought tolerance indicators offer breeders actionable insights. Such markers enable selection of environmentally stable QTLs linked to yield and drought tolerance, accelerating the development of superior genotypes. Moreover, the identified MTAs hold direct utility in wheat breeding programmes targeting drought stress, particularly for marker-assisted selection and gene pyramiding strategies.
Conclusion
Molecular markers linked to biochemical traits can accelerate the identification of drought-tolerant germplasm, enhancing breeding efficiency. Significant genotypic variance confirmed substantial genetic diversity and differential drought stress responses. Key biochemical traits – catalase (CAT), superoxide dismutase (SOD) activity, proline content (PC), and ascorbate peroxidase (APX) activity – exhibited high heritability (> 90%) and genetic advance (> 30%) under both irrigated and rainfed conditions, unlike malon-dialdehyde (MDA). Thus, these traits are recommended for selecting high-yielding genotypes. Principal component analysis (PCA, 64.08% variance explained) and correlation identified stress tolerance index (STI), mean productivity (MP), geometric mean productivity (GMP), harmonic mean productivity (HMP), and relative decrease in yield (RDY) as the most effective drought tolerance indices, strongly correlated with grain yield and biochemical traits. Genotypes 6, 10, 15, 18, 13, and Pishtaz demonstrated superior drought tolerance, high yield potential, and optimal biochemical performance (SOD, APX, PC, MDA, CAT) under stress. Among 20 SSR markers, 16 showed significant polymorphism. Markers XCFD168 (rainfed-CAT), XGWM350 (rainfed-APX), XGWM124(a2) (yield, rainfed-SOD, multiple indices), XGWM136 (irrigated yield, ATI, TOL, SSPI, SSI, PEV), XGWM410(a1) (yield in both environments, irrigated-CAT, multiple indices), and XGWM2(a2) (irrigated yield, rainfed-APX, ATI) exhibited significant trait associations. These markers are strongly recommended for marker-assisted breeding to improve yield and drought tolerance.
Acknowledgments
We gratefully acknowledge the administration of Razi University, Kermanshah, for providing the laboratory and field facilities necessary to conduct this research. We also extend our thanks to the Karaj Seed and Plant Improvement Institute for supplying the plant seeds. It is important to note that while Razi University provided the research infrastructure, it did not provide specific funding for the publication of this article.
Author contributions
Conceptualization: Ezatollah Farshadfar, Kianoosh Cheghamirza; Data curation: Fatemeh Bavandpouri; Methodology: Fatemeh Bavanpouri; Formal analysis: Fatemeh Bavandpouri, Mohsen Farshadfar; Investigation: Ezatollah Farshadfar; Funding acquisition: Ezatollah Farshadfar, Mohsen Farshadfar; Project administration: Fatemeh Bavanpouri, Kianoosh Cheghamirza; Visualization: Fatemeh Bavanpouri, Mohsen Farshadfar; Supervision: Ezatollah Farshadfar, Kianoosh Cheghamirza; Resources: Fatemeh Bavandpouri, Mohsen Farshadfar; Writing – original draft preparation: Fatemeh Bavanpouri; Writing – review and editing: Fatemeh Bavandpouri, Ezatollah Farshadfar. All authors have read and agreed to the published version of the manuscript.
Conflict of interest statement
The authors have declared that no competing interests exist.
Data availability statement
The datasets collected and analyzed for this study are available upon reasonable request.
References
Ahmed, H. G. M. D., Kashif, M., Rashid, M. A. R., Sajjad, M., and Zeng, Y. (2020). Genome wide diversity in bread wheat evaluated by SSR markers. International Journal of Agriculture & Biology 24, 263–272. doi: https://doi.org/10.17957/IJAB/15.1433
Ahmed, Sh. F., Ahmed, J. U., Hasan, M., and Mohi-Ud-Din, M. (2023). Assessment of genetic variation among wheat genotypes for drought tolerance utilizing microsatellite markers and morpho-physiological characteristics. Heliyon 9, e21629. doi: https://doi.org/10.1016/j.heliyon. 2023.e21629
Ahmed, H. Gh. M. D., Yang, T., Akram, M. I., Iqbal, R., AlGhamdi, A. A., and Al Farraj, D. A. (2024). Molecular marker based analysis of allelic variation in the spring wheat genome. Genetic Resources and Crop Evolution 1–17. doi: https://doi.org/10.1007/s10722-024-02274-y
Al-Ashkar, I., Alderfasi, A., Romdhane, W. B., Seleiman, M. F., El-Said, R. A., and Al-Doss, A. (2020). Morphological and genetic diversity within salt tolerance detection in eighteen wheat genotypes. Plants 9(287), 1–21. doi: https://doi.org/10.3390/plants9030287
Al-Naggar, A. M. M., El-Shafi, M. A. E. M. A., El-Shal, M. H., and Anany, A. H. (2020). Evaluation of Egyptian wheat landraces (Triticum aestivum L.) for drought tolerance, agronomic, grain yield and quality traits. Plant Archives 20(1), 3487–3504. url: https://www.researchgate.net/publication/340284945
Altintas, S., Toklu, F., Kafkas, S., Kilian, B., Brandolini, A., and Ozkan, H. (2008). Estimating genetic diversity in durum and bread wheat cultivars from turkey using AFLP and SAMPL markers. Plant breeding 127, 9–14. doi: https://doi.org/10.1111/j.1439-0523.2007.01424.x
Amalova, A., Griffiths, S., Abugalieva, S., and Turuspekov, Y. (2024). Genome-wide association study of yield-related traits in a nested association mapping population grown in Kazakhstan. Agronomy 14, 1848. doi: https://doi.org/10.3390/agronomy14081848
Amare, A. (2023). Genetic variability, correlation and path coefficient analysis of bread wheat (Triticum aestivum L.) genotypes under irrigation in Raya Azebo district, south Tigray. International Journal of Novel Research in Interdisciplinary Studies 10(6), 1–6. doi: https://doi.org/10.5281/zenodo.10074538
Anderson, J. A., Churchill, G. A., Autrique, J. E., Tanksley, S. D., and Sorrells M. E. (1993). Optimizing parental selection for genetic linkage maps. Genome 36(1), 181–186. doi: https://doi.org/10.1139/g93-024
Bates, L., Waldren, R., and Teare, I. (1973). Rapid determination of free proline for water-stress studies. Plant and Soil 39, 205–207. doi: https://doi.org/10.1007/BF00018060
Batool, N., Ilyas, N., Shahzad, A., Hauser, B. A., and Arshad, M. (2018). Quantitative trait loci (QTLs) mapping for salt stress tolerance in wheat at germination stage. Pakistan Journal of Agricultural Sciences 55(1), 47–55. doi: https://doi.org/10.21162/PAKJAS/18.5426
Bavandpouri, F., Farshadfar, E., Cheghamirza, K., Farshadfar, M., Bihamta, M. R., Mahdavi, A. M., and Jelodar, N. B. (2025). Identification of molecular markers associated with genomic regions controlling agronomic traits in bread wheat genotypes under different moisture conditions. Plant molecular biology reporter 43, 631-651. doi: https://doi.org/10.1007/s11105-024-01494-x
Beauchamp, C., and Fridovich, I. (1971). Superoxide dismutase: improved assays and an assay applicable to acrylamide gels. Analytical Biochemistry 44, 276–287. doi: https://doi.org/10.1016/0003-2697(71)90370-8
Bouslama, M., and Schapaugh, W. (1984). Stress tolerance in soybeans. I. evaluation of three screening techniques for heat and drought tolerance. Crop Science 24, 933–937. doi: https://doi.org/10.2135/cropsci1984.0011183X002400050026x
Bradford, M. M. (1976). A rapid and sensitive method for the quantitation of microgram quantities of protein utilizing the principles of protein Dye binding. Analytical Biochemistry 72, 248–254. doi: https://doi.org/10.1006/abio.1976.9999
Budak, H., Kanter, M., and Kurtoglu, K. Y. (2013). Drought tolerance in modern and wild wheat. The Scientific World Journal 15(2013), 548246. doi: https://doi.org/10.1155/2013/548246
Chance, B., and Maehly A. C. (1995). Assay of catalase and peroxidase. In: Culowic SP, & Kaplan NO, eds. Methods in enzymology, Vol 2. New York: Academic Press Inc., 764–765.
Choudhary, R. C., Sharma, N. K., Kumar, R., and Kumar, M. (2016). SSR-based genetic diversity assessment among hexaploid wheat (Triticum aestivum L.) cultivars. Indian Journal of Plant Genetic Resources 29(2), 137–143. doi: https://doi.org/10.5958/0976-1926.2016.00019.X
Doyle, J. J., and Doyle, J. L. (1987). A rapid DNA isolation procedure for small quantities of fresh leaf tissue. Phytochemical Bulletin 19, 11–15.
Dukamo, B. H., Gedebo, A., Tesfaye, B., and Degu, H. D. (2023). Genetic diversity of Ethiopian durum wheat (T. turgidum subsp. Durum) landraces under water stressed and non-stressed conditions. Heliyon 9(e18359), 1–17. doi: https://doi.org/10.1016/j.heliyon.2023.e18359
El-demery, S. M. M., Bakry, B. A., Younis, A. E-S. M., Sayed, M. A., and Abdellatif, K. F. (2022). QTL analysis of grain yield-related traits for terminal heat stress tolerance in wheat using SSR markers. Pakistan Journal of Biological Sciences 25(6), 516–530. doi: https://doi.org/10.3923/pjbs.2022.516.530
Ellegren, H. (2004). Microsatellites: simple sequences with complex evolution. Nature Reviews Genetics 5(6), 435–445. doi: https://doi.org/10.1038/nrg1348
El-Rawy, M. A., and Hassan, M. I. (2021). Assessment of genetic diversity in durum and bread wheat genotypes based on drought tolerance and SSR markers. Plant Breeding and Biotechnology 9(2), 89–103. doi: https://doi.org/10.9787/PBB.2021.9.2.89
Emre, I., Ozgur, T., Fatma, A. T., and Muzaffer, T. (2011). Determination of tolerance level of some wheat genotypes to post-anthesis drought. Turkish Journal of Field Crops 19(1), 59–63.
Farshadfar, E. (2010). New topics in biometric genetics. Islamic Azad University publications, 722p.
Farshadfar, M. (2023). Molecular plant breeding. Payam Noor University press, 424p.
Faysal, A. S. M., Ali, L., Azam, M. G., Sarker, U., Ercisli, S., Golokhvast, K. S., and Marc, R. A. (2022). Genetic variability, character association, and path coefficient analysis in transplant Aman rice genotypes. Plants 11, 2952. doi: https://doi.org/10.3390/plants11212952
Feltaous, Y. M. (2019). Genetic diversity among some Egyptian bread wheat cultivars based on morphological characters and SSR markers. Assiut Journal of Agricultural Sciences 50(4), 35–50. doi: https://doi.org/10.21608/ajas.2020.70069
Fernandez, G. C. (1992). Effective selection criteria for assessing plant stress tolerance. Proceedings of the international symposium on adaptation of vegetables and other food crops in temperature and water stress, AVRDC publication, Tainan, Taiwan, 257–270.
Firouzian, A., Shafeinia, A., Ghaffary, S. M. T., Mohammadi, V., and Sadat, S. (2023). Terminal heat tolerance in bread wheat determined by agronomical traits and SSR markers. Journal of Plant Growth Regulation 42(3), 1–12. doi: https://doi.org/10.1007/s00344-022-10680-8
Fischer, R., and Maurer, R. (1978). Drought resistance in spring wheat cultivars. I. grain yield responses. Crop and Pasture Science 29, 897–912. doi: https://doi.org/10.1071/AR9780897
Galal, A. A., Safhi, F. A., El-Hity, M. A., Kamara, M. M., El-Din, E. M. G., Rehan, M., Farid, M., Behiry, S. I., El-Soda, M., and Mansour, E. (2023). Molecular genetic diversity of local and exotic durum wheat genotypes and their combining ability for agronomic traits under water deficit and well-watered conditions. Life 13(2293), 1–20. doi: https://doi.org/10.3390/life13122293
Giovenali, G., Kuzmanovi´c, L., Capoccioni, A., and Ceoloni, C. (2023). The response of chromosomally engineered durum wheat-Thinopyrum ponticum recombinant lines to the application of heat and water-deficit stresses: effects on physiological, biochemical and yield-related traits. Plants 12(704), 1–29. doi: https://doi.org/10.3390/plants12040704
Gupta, A. K., Agrawal, M., Yadav, H., Mishra, G., Gupta, R., Singh, A., Katiyar, D., Singh, P., and Srivastava A. (2024). Drought stress and its tolerance mechanism in wheat. International Journal Environment and Climate Chang 14(1), 529–544. url: https://doi.org/10.9734/ijecc/2024/v14i13866
Halder, T., Liu, H., Chen, Y., Yan, G., and Siddique, K. H. M. (2023). Chromosome groups 5, 6 and 7 harbor major quantitative trait loci controlling root traits in bread wheat (Triticum aestivum L.). Frontiers in Plant Science 14, 1092992. doi: https://doi.org/10.3389/fpls.2023.1092992
Haque, M. Sh., Saha, N. R., Islam, M. T., Islam, M. M., Kwon, SJ., Roy, S. K., and Woo, SH. (2020). Screening for drought tolerance in wheat genotypes by morphological and SSR markers. Journal of Crop Science and Biotechnology 1-14. doi: https://doi.org/10.1007/s12892-020-00036-7
Hassan M. Z, Hasanuzzaman, M., Uddin, M. J., Alomgir, M. B., Akter, M. S., Mohanto, A. Ch., and Kayess, M. O. (2025). Assessing genetic diversity and population structure of f4:f5 wheat genotypes using morphological and microsatellite markers under heat stress. Discover Agriculture 3: 14. doi: https://doi.org/10.1007/s44279-025-00161-3
Heath, R. L., and Packer, L. (1968). Photoperoxidation in isolated chloroplasts: I. kinetics and stoichiometry of fatty acid peroxidation. Archives of Biochemistry and Biophysics 125, 189–198. doi: https://doi.org/10.1016/0003-9861(68)90654-1
Heidari, B., Barjoyifard, D., Mazal-Mazraei, T., and Govindan, V. (2024). Assessment of genetic biodiversity and association of micronutrients and agronomic traits using microsatellites and staining methods which accelerates high micronutrients variety selections within different wheat groups. Scientific Reports 14, 27419. doi: https://doi.org/10.1038/s41598-024-78964-5
Ilyas, N., Amjid, M. W., Saleem, M. A., Khan, W., Wattoo, F. M., Rana, R. M., Maqsood, R. H., Zahid, A., Shah, G. A., Anwar, A., Ahmad, M. Q., Shaheen, M., Riaz, H., and Ansari, M. J. (2020). Quantitative trait loci (QTL) mapping for physiological and biochemical attributes in a Pasban90/Frontana recombinant inbred lines (RILs) population of wheat (Triticum aestivum) under salt stress condition. Saudi Journal of Biological Sciences 27(1), 341–351. doi: https://doi.org/10.1016/j.sjbs.2019.10.003
Islam, S., Haque, M. S., Emon, R. M., Islam, M. M., and Begum, S. N. (2012). Molecular characterization of wheat (Triticum aestivum L.) genotypes through SSR markers. Bangladesh Journal of Agricultural Research 37(3), 389–398. doi: https://doi.org/10.3329/bjar.v37i3.12082
Jabari, M., Golparvar, A., Sorkhilalehloo, B., and Shams, M. (2023). Investigation of genetic diversity of Iranian wild relatives of bread wheat using ISSR and SSR markers. Journal of Genetic Engineering Biotechnology 21(73), 1–16. doi: https://doi.org/10.1186/s43141-023-00526-5
Kara, K., Rached-Kanouni, M., Mnasri, S., Khammar, H., and Ben Naceur, M. B. (2020). Genetic variability assessment in bread wheat (Triticum aestivum) grown in Algeria using microsatellites SSR markers. Biodiversitas 21, 2638–2644. doi: https://doi.org/10.13057/biodiv/d210635
Kaur, V., Singh, S., and Behl, R. K. (2016). Heat and drought tolerance in wheat: integration of physiological and genetic platforms for better performance under stress. Ekin Journal of Crop Breeding and Genetics 2(1), 1-14. url: https://www.ekinjournal.com
Kaur, S. J., Talekar, N., Delvadiya, I., Singh, S. K., and Raut, A. (2023). Genetic profiling of bread wheat (Triticum aestivum L.): analyzing variation, associations, path analysis, and diversity to revolutionize crop enhancement. Journal of Food Chemistry and Nanotechnology 9(S1), S21–S27. doi: https://doi.org/10.17756/jfcn.2023-s1-005
Kearsey, J. M., and Pooni. S. H. (1996). The genetic analysis of quantitative traits. 1st ed. Chapman and Hall, London. doi: https://doi.org/10.1007/978-1-4899-4441-2
Khan, A., Ahmad, M., Ahmed, M., Gill, K. S., and Akram, Z. (2021). Association analysis for agronomic traits in wheat under terminal heat stress. Saudi Journal of Biological Sciences 28, 7404–7415. doi: https://doi.org/10.1016/j.sjbs.2021.08.050
Kumar, P., Gupta, V. K., Misra, A. K., Modi, D. R., and Pandy, B. K. (2009). Potential of molecular markers in plant biotechnology. Plant Omics Journal 2(4), 141–162. url: https://www.pomics.com/Pradeep_2_4_2009_141_162.pdf
Kumar, H., Chugh, V., Kumar, M., Gupta, V., Prasad, S., Kumar, S., Singh, Ch. M., Kumar, R., Singh, B. K., Panwar, G., and Kumar, M. (2023a). Investigating the impact of terminal heat stress on contrasting wheat cultivars: a comprehensive analysis of phenological, physiological, and biochemical traits. Frontiers in Plant Science 14(1189005), 1–17. doi: https://doi.org/10.3389/fpls.2023.1189005
Kumar, R., Kumar, S., Azad, C. S., and Baranwal, D. (2023b). Genetic variability, correlation and path coefficient analysis for yield components and grain minerals in wheat (Triticum aestivum L.). The Pharma Innovation Journal 12(9), 1140–1144. url: https://www.thepharmajournal.com
Kumari, M., Sharma, H., Dadeech, A., and Dashora, A. (2025). Molecular characterization and genetic diversity assessment of bread wheat [Triticum aestivum (L.) em. Thell] genotypes using SSR markers. International Journal of Current Microbiology and Applied Sciences 14(05), 139–147. doi: https://doi.org/10.20546/ijcmas.2025.1405.014
Li, Y., Tao, F., Hao, Y., Tong, J., Xiao, Y., He, Zh., and Reynolds, M. (2023). Variations in phenological, physiological, plant architectural and yield-related traits, their associations with grain yield and genetic basis. Annals of Botany 131, 503–519. doi: https://doi.org/10.1093/aob/mcad003
Maccaferri, M., Sanguineti, M. C., Demontis, A., El-Ahmed, A., L. Moral, G., Maalouf, F., Nachit, M., Nserallah, N., Ouabbou, H., Rhouma, S., Royo, C., Villegas, D., and Tuberosa, R. (2011). Association mapping in durum wheat grown across a broad range of water regimes. Journal of Experimental Botany 62(2), 409–438. doi: https://doi.org/10.1093/jxb/erq287
Ma, J., Zhao, D., Tang, X., Yuan, M., Zhang, D., Xu, M., Duan, Y., Ren, H., Zeng, Q., Wu, J., Han, D., Li, T., and Jiang, L. (2022). Genome-wide association study on root system architecture and identification of candidate genes in wheat (Triticum aestivum L.). International Journal of Molecular Sciences 23, 777–790. doi: https://doi.org/10.3390/ijms23031843
Mallick, N., Jha, S. K., Agarwal, P., Mall, A., M., N., Kumar, S., Choudhary, M. K., Bansal, S., Saharan, M. S., Sharma, J. B., and Vinod. (2022a). Marker-assisted improvement of bread wheat variety HD2967 for leaf and stripe rust resistance. Plants 11, 1152. doi: https://doi.org/10.3390/plants11091152
Mallick, N., Jha, S. K., Agarwal, P., Kumar, S., Mall, A., M., N., Choudhary, M. K., Chandra, A. K., Bansal, S., Saharan, M. S., Sharma, J. B., and Vinod. (2022b). Marker-assisted transfer of leaf and stripe rust resistance from Triticum turgidum var. durum cv. Trinakria to wheat variety HD2932. Frontiers in Genetics 13, 941287. doi: https://doi.org/10.3389/fgene.2022.941287
Miller, P. A., Williams, J. C., Robinson, H. F., and Comstock, R. I. (1958). Estimates of genotypic and environmental variances and covariance in upland cotton and their implications in selection. Agronomy Journal 50(3), 126–131. doi: https://doi.org/10.2134/agronj1958.00021962005000030004x
Mkhabela, S. S., Shimelisa, H., Odindoa, A. O., and Mashilo, J. (2019). Response of selected drought tolerant wheat (Triticum aestivum L.) genotypes for agronomic traits and biochemical markers under drought-stressed and non-stressed conditions. Acta Agriculturae Scandinavica, Section B — Soil & Plant Science 69(8), 674–689. doi: https://doi.org/10.1080/09064710.2019.1641213
Mohammadi, S. A., and Prasanna, B. M. (2003). Analysis of genetic diversity in crop plants: salient statistical tools and considerations. Crop Science 43, 1235–1248. doi: https://doi.org/10.2135/cropsci2003.1235
Moosavi, S., Yazdi Samadi, B., Naghavi, M., Zali, A., Dashti, H., and Pourshahbazi, A. (2008). Introduction of new indices to identify relative drought tolerance and resistance in wheat genotypes. Desert 12, 165–178. doi: https://doi.org/10.22059/jdesert.2008.27115
Nakano, Y., and Asada, K. (1981). Hydrogen peroxide is scavenged by ascorbate-specific peroxidase in spinach chloroplasts. Plant and cell physiology 22, 867–880. doi: https://doi.org/10.1093/oxfordjournals.pcp.a076232
Naroui Rad, M. R., Abdul Kadir, M., Rafii, M. Y., Jaafar, H. Z. E., and Naghavi, M. R. (2012). Bulked segregant analysis for relative water content to detect quantitative trait loci in wheat under drought stress. Genetics and Molecular Research 11(4), 3882–3888. doi: http://dx.doi.org/10.4238/2012.November.12.5
Negisho, K., Shibru, S., Matros, A., Pillen, K., Ordon, F., and Wehner, G. (2022). Association mapping of drought tolerance indices in Ethiopian durum wheat (Triticum turgidum ssp. Durum). Frontiers in Plant Science 13(838088), 1–15. doi: https://doi.org/10.3389/fpls.2022.838088
Nourmand-moaied, F., Rostami. M. A., and Ghannadha, M. R. (2001). A study of morpho-physiological traits of bread wheat (Triticum aestivum L.) relationship with grain yield under normal and drought stress conditions. Iranian Journal of Agricultural Science 32(4), 785–794. url: https://sid.ir/paper/436197/fa
Oguz, M. C., Aycan, M., Oguz, E., Poyraz, I., and Yildiz, M. (2022). Drought stress tolerance in plants: interplay of molecular, biochemical and physiological responses in important development stages. Physiologia 2, 180–197. doi: https://doi.org/10.3390/physiologia2040015
Pour-Aboughadareh, A., Jadidi, O., Shooshtari, L., Poczai, P., and Mehrabi, A. A. (2022). Association analysis for some biochemical traits in wild relatives of wheat under drought stress conditions. Genes 13, 1–14. doi: https://doi.org/10.3390/genes13081491
R Core Team (2025). R: A language and environment for statistical computing. R Foundation for Statistical Computing, Vienna, Austria. url: https://www.R-project.org/.
Rabieyan, E., Bihamta, M. R., Esmaeilzadeh Moghaddam, M., Alipour, H., Mohammadi, V., Azizyan, K., and Javid, S. (2023). Analysis of genetic diversity and genome-wide association study for drought tolerance related traits in Iranian bread wheat. BMC Plant Biology 23(431), 1–27. doi: https://doi.org/10.1186/s12870-023-04416-3
Ramachandra Reddy, A., Chaitanya, K. V., Jutur, P. P., and Sumithra, K. (2004). Differential antioxidative responses to water stress among five mulberry (Morus alba L.) cultivars. Environmental and experimental botany 52(1), 33–42. doi: https://doi.org/10.1016/j.envexpbot.2004.01.002
Rashid, U., Yasmin, H., Hassan, M. N., Naz, R., Nosheen, A., Sajjad, M., Ilyas, N., Keyani, R., Jabeen, Z., Mumtaz, S., Alyemeni, M. N., and Ahmad, P. (2022). Drought-tolerant Bacillus megaterium isolated from semi-arid conditions induces systemic tolerance of wheat under drought conditions. Plant Cell Reports 41(3), 549–569. doi: https://doi.org/10.1007/s00299-020-02640-x
Reddy, S. S., Saini, D. K., Singh, G. M., Sharma, S., Mishra, V. K., and Joshi, A. K. (2023). Genome-wide association mapping of genomic regions associated with drought stress tolerance at seedling and reproductive stages in bread wheat. Frontiers in Plant Science 14(1166439), 1–17. doi: https://doi.org/10.3389/fpls.2023.1166439
Rosewarne, G. M., Herrera-Foessel, S. A., Singh, R. P., Huerta-Espino, J., Lan, C. X., and He, Z. H. (2013). Quantitative trait loci of stripe rust resistance in wheat. Theoretical Applied Genetics 126(10), 2427–2449. doi: https://doi.org/10.1007/s00122-013-2159-9
Rossielli, A., and Hamblin, A. (1981). Theorical aspects of selection for stress and non-stress environment. Crop Science 21, 1441–1446. doi: https://doi.org/10.2135/cropsci1981.0011183X002100060033x
Ruan, C. J., Li, H., and Mopper, S. (2009). Characterization and identification of ISSR markers associated with resistance to dried-shrink disease in Sea Buckthorn. Molecular Breeding 24(3), 255–268. doi: https://doi.org/10.1007/s11032-009-9288-5
Saed-Moucheshi, A., Razi, H., Dadkhodaie, A., Ghodsi, M., and Dastfal, M. (2019). Association of biochemical traits with grain yield in triticale genotypes under normal irrigation and drought stress conditions. Australian Journal of Crop Science 13, 272–281. doi: https://doi.org/10.21475/ajcs.19.13.02.p1403
Saeed, I., Chen, X., Bachir, D. G., Chen, L., and Hu, Y-G. (2017). Association mapping for photosynthesis and yield traits under two moisture conditions and their drought indices in winter bread wheat (Triticum aestivum L.) using SSR markers. Australian Journal of Crop Science 11(03), 248–257. doi: https://doi.org/10.21475/ajcs.17.11.03pne252
Sallam, A., Alqudah, A. M., Dawood, M., Baenziger, P. S., and Borner, A. (2019). Drought stress tolerance in wheat and barley: advances in physiology, breeding and genetics research. International Journal of Molecular Sciences 20, 1–36. doi: https://doi.org/10.3390/ijms20133137
Sallam, M., Ghazy, A., Al-Doss, A., and Al-Ashkar, I. (2024a). Combining genetic and phenotypic analyses for detecting bread wheat genotypes of drought tolerance through multivariate analysis techniques. Life 14, 183. doi: https://doi.org/10.3390/life14020183
Sallam, M., Al-Ashkar, I., Al-Doss, A., Al-Gaadi, K. A., Zeyada, A. M., and Ghazy, A. (2024b). Assessing heat stress tolerance of wheat genotypes through integrated molecular and physio-biochemical analyses. Agronomy 14, 1999. doi: https://doi.org/10.3390/agronomy14091999
Sinha, A. K. (1972). Colorimetric assay of catalase. Analytical Biochemistry 47, 389–394. doi: https://doi.org/10.1016/0003-2697(72)90132-7
Shah, A. A., Bhat, R. A., Bhat, B. A., and Mondal, S. K. (2019). Genetic evaluation of winter wheat genotypes under rainfed conditions. International Journal of Chemical Studies 7(1), 1064–1071. url: https://www.chemijournal.com/archives/2019/vol7issue1/PartS/6-4-853-700.pdf
Sowadan, O., Xu, S., Li, Y., Muleke, E. M., Sitoe, H. M., Dang, X., Jiang, J., Dong, H., and Hong, D. (2024). Genome-wide association analysis unravels new quantitative trait loci (QTLs) for eight lodging resistance constituent traits in rice (Oryza sativa L.). Genes 15(105), 1–18. doi: https://doi.org/10.3390/genes15010105
Sunil kumar, V. P., Krishna, H., Devate, N. B., Manjunath, K. K., Chauhan, D., Singh, S., Sinha, N., Singh, J. B., Prakasha, T. L., Pal, D., Sivasamy, M., Jain, N., Singh, G. P., and Singh, P. K. (2023). Marker-assisted selection for transfer of QTLs to a promising line for drought tolerance in wheat (Triticum aestivum L.). Frontiers in Plant Science 14(1147200), 1–13. doi: https://doi.org/10.3389/fpls.2023.1147200
Vaillancourt, A., Nkongolo, K., Michael, P., and Mehes, M. (2008). Identification, characterization, and chromosome locations of rye and wheat specific ISSR and SCAR markers useful for breeding purposes. Euphytica 159(3), 297–306. doi: https://doi.org/10.1007/s10681-007-9492-5
Yusuf, Z., Mohammed, W., Zeleke, H., Hussein, Sh., and Arno, H. (2021). Coheritability and genetic advances of agromorphological and oil quality traits in groundnut (Arachis hypogaea L.) genotypes from Ethiopia. International Journal of Agronomy 5148772(5). doi: https://doi.org/10.1155/2021/5148772
Zhao, J., Sun, L., Gao, H., Hu, M., Mu, L., Cheng, X., Wang, J., Zhao, Y., Li, Q., Wang, P., Li, H., and Zhang, Y. (2023). Genome-wide association study of yield-related traits in common wheat (Triticum aestivum L.) under normal and drought treatment conditions. Frontiers in Plant Science 13(1098560), 1–20. doi: https://doi.org/10.3389/fpls.2022.1098560