Phenotypic variability of tarwi (Lupinus mutabilis S.) in Peruvian germplasm collections
Kevin Ortega-Quispea,b,*, Eunice Peña-Elmea, Carolina Girón-Aguilara, Nery Amaro-Camarenaa, Claudia Rios-Chavarríac, Bertha Lopez-Parionaa, Francis Cerrón-Mercadoa, Steve Camargo-Hinostrozab, Samuel Pizarrod
a Estación Experimental Agraria Santa Ana, Dirección de Recursos Genéticos y Biotecnología, Instituto Nacional de Innovación Agraria (INIA), Carretera Saños Grande – Hualahoyo Km 8 Santa Ana, Huancayo, Junín 12007, Peru
b Escuela Académico Profesional de Ingeniería Ambiental, Universidad Continental, Huancayo 12001, Peru
c Faculty of Forestry, University of Sopron, Bajcsy-Zsilinszky u. 4, 9400, Sopron, Hungary
d Centro de Investigación en Geomática Ambiental (CIGA), Instituto de Investigación para el Desarrollo Sustentable de Ceja de Selva (INDES-CES), Universidad Nacional Toribio Rodríguez de Mendoza de Amazonas, Chachapoyas 01001, Peru.
* Corresponding author: Kevin Ortega-Quispe (kevinorqu@gmail.com)
Abstract: The growing global loss of genetic diversity, phenotypic characterization becomes essential for identifying resilient varieties capable of diversifying and strengthening the agricultural production of underutilized crops such as tarwi (Lupinus mutabilis S.). This study aimed to characterize the phenotypic variability of 41 tarwi accessions conserved in the germplasm bank of the National Institute of Agricultural Innovation (INIA) of Peru. The accessions were evaluated over two consecutive agricultural seasons at the Santa Ana Agrarian Experimental Station under local conditions. Thirty morphological descriptors (17 qualitative and 13 quantitative) were used following IBPGR guidelines. Data were analyzed using descriptive statistics, principal component analysis, hierarchical clustering and correlation analysis for quantitative descriptors, as well as frequency tables and the Shannon-Weaver diversity index for qualitative descriptors. The results revealed high phenotypic variability, particularly in traits related to yield, plant architecture and floral attributes. The accessions were grouped into three morpho-agronomic types: (1) highly productive accessions, (2) accessions with vigorous vegetative development, and (3) short-cycle plants with moderate yields. Yield per plant was significantly associated with the total pod number, total seed mass in hundred seeds and seed thickness. The study revealed considerable phenotypic diversity, characterized by significant correlations among key agronomic traits, the delineation of three distinct phenotypic clusters, and the identification of valuable qualitative attributes, which reinforces their potential for conservation and breeding programmes. However, expanded germplasm evaluation and multi-environment trials are required to validate genotype stability and refine selection criteria. However, additional accessions and further analyses are needed to validate the observed patterns.
Keywords: Germplasm, accessions, conservation, Leguminosae, descriptors
Agriculture and global food security faces unprecedented challenges due to climate change (Morales-Casco & Zúniga-González, 2016), environmental degradation (Palacios-López, 2024) and the growing dependence on a limited number of commercial crops for food, mainly staple cereals such as wheat, rice and maize, which has led to the neglect of a wide range of genetic resources and potentially valuable agronomic traits (Massawe et al, 2015). According to the Food and Agriculture Organization of the UN (FAO), more than 75% of agricultural genetic diversity has been lost over the past century, thereby increasing the vulnerability of agri-food systems to pests, diseases and extreme weather events (FAO, 2019). In this context, the agromorphological characterization of underutilized crops, such as Andean legumes, becomes an essential strategy to identify resilient varieties that can diversify agricultural production and improve nutrition (Ojuederie et al, 2023).
The Andean region is considered one of the most important centres of origin and diversification of crops worldwide, due to its climatic and cultural variability (Flores et al, 2003). Over time, traditional crops such as tarwi (Lupinus mutabilis S.), which for centuries played a central role in Andean agriculture, have been gradually displaced by introduced species of greater commercial interest, such as faba bean (Vicia faba L.). This shift is driven not only by economic dynamics but also by sociocultural factors, as tarwi has historically been undervalued and associated with social stigmas often perceived as ‘poor people's food’ or ‘indigenous food’, which contributed to its progressive abandonment in agricultural systems (Chalampuente et al, 2021).
Lupinus mutabilis S. is a leguminous species of the Fabaceae family native to the Andes and is known by several vernacular names reflecting the linguistic diversity of its distribution range: 'chocho' (Colombia, Ecuador, northern Peru), 'tarwi' or 'tarhui' in Quechua (central and south-central Peru), 'tauri' in Aymara (south of Lake Titicaca, Peru and Bolivia), and 'chuchus muti' (Cochabamba, Bolivia) (Tapia, 2015). The species exhibits outstanding adaptability to diverse geographic regions, demonstrating promising agronomic performance and genetic variability not only across South American ecosystems but also in Mediterranean climates in Europe, where its cultivation potential has been successfully evaluated (Guilengue et al, 2019). Traditionally cultivated in small-scale farming systems, it stands out for its high nutritional value, with a protein content exceeding 40%, along with essential oils and key minerals important for human nutrition. In recent years, it has been recognized as a biofortified food due to the notable concentrations of micronutrients such as iron, zinc and boron present in its seeds. These attributes position it as a strategic crop in addressing food security and nutrition challenges in rural areas. Furthermore, the flour obtained from debittered tarwi exhibits favourable physicochemical properties: 9.20% moisture, 2.03% ash, 20.01% fat, 51.65% protein, 9.04% fiber and 8.10% carbohydrates, reinforcing its potential as a functional ingredient for the development of value-added food products (Caligari et al, 2000; Enrique Quispe, 2022; Vera-Vega et al, 2022), Additionally, through its nitrogen-fixing based on symbiosis with Rhizobium spp., combined with high tolerance to poor soils and optimal adaptation to elevations between 2,000 and 3,800m a.s.l. in temperate to cold climates, tarwi contributes significantly to soil improvement (Tapia, 2015).
Several studies in countries such as Ecuador and Bolivia have highlighted the notable phenotypic plasticity of tarwi (Camarena et al, 2012; Peralta et al, 2013; Aguilar Angulo, 2015; Cano et al, 2022). Nonetheless, in Peru, systematic comparisons of accessions from different regions remain lacking. Although novel debittering techniques have been developed, most efforts have focused on reducing alkaloid content or improving productivity, without integrating the selection of high-yielding genotypes, limiting the effectiveness of genetic improvement programmes (Gulisano et al, 2022). This gap underscores the current weaknesses and the urgent need to conserve and characterize tarwi’s genetic diversity within germplasm banks, as a strategic foundation for the development of sustainable and nutritious cropping systems that contribute to food security. Given the increasing global demand for sustainable plant-based foods, it is essential to prioritize the generation of standardized data for the description and comparison of germplasm collections, in order to promote the conservation and use of underutilized crops like tarwi within food sovereignty strategies (FAO, 2010; Padulosi et al, 2011).
Additionally, there is a need to provide farmers and stakeholders with agromorphological information on well-adapted varieties and accessions to reduce production risks, inform public food security policies, and establish a replicable methodology based on standardized qualitative and quantitative descriptors by the International Board for Plant Genetic Resources (IBPGR, 1981). This information aims to complement the global efforts of germplasm banks and research institutes for the conservation and improvement of plant genetic resources (Gresta et al, 2017), positioning tarwi as a sustainable alternative for high-Andean agri-food systems.
Accordingly, this research aimed to characterize the phenotypic diversity of 41 tarwi accessions from the Germplasm Bank of the Peruvian National Institute of Agrarian Innovation (INIA), using descriptors established by IBPGR protocols, evaluated over two consecutive seasons under the agroecological conditions of the central highlands at the Santa Ana Agricultural Experiment Station (hereafter EEA Santa Ana). Ultimately, the study seeks to expand current knowledge on tarwi morphology and generate a positive impact on the agricultural sector by promoting the conservation of plant genetic resources and supporting progress toward the UN Sustainable Development Goals (SDGs) (Seyedsayamdost, 2020).
Materials and methods
Plant material
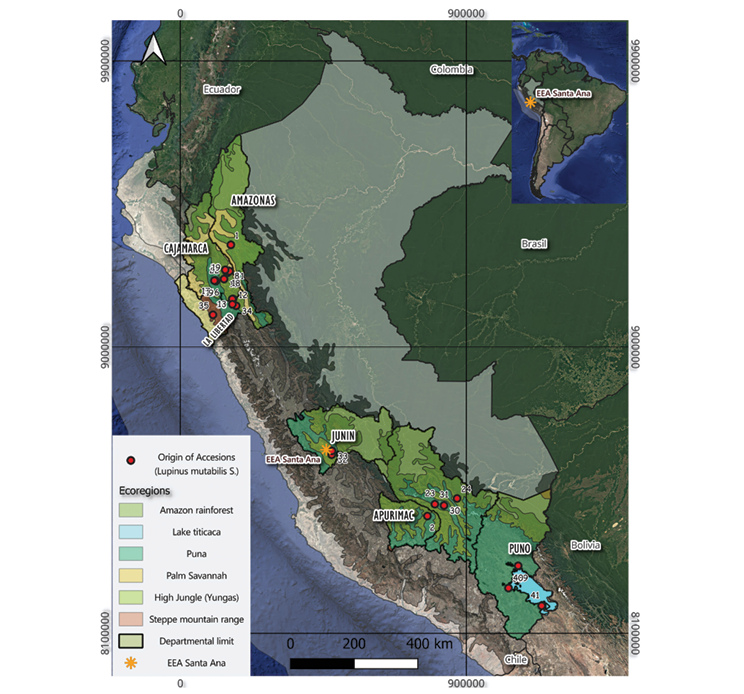
The research was carried out using a total of 41 tarwi accessions, which are part of the INIA Germplasm Bank. The accessions were originally collected across diverse regions of Peru during 1979 and 1981 and have since been maintained through periodic regeneration following protocols established by the Sub-Directorate of Genetic Resources, contributing to national conservation efforts for Andean crop genetic diversity.
The collection sites, number of accessions, and their altitudinal range of origin were determined based on passport data recorded in the national tarwi collection (Table 1), where each accession has a unique international identification code ‘PER’. The full information on the tarwi accessions, as well as the base material used in this study, is available on Zenodo (https://doi.org/10.5281/zenodo.15740283).
Table 1. List of tarwi accessions evaluated in the 2022–2023 and 2023–2024 agricultural campaigns.
|
Department of Peru |
Code |
# of Accessions |
% |
Altitudinal range (m a.s.l) |
|
Amazonas |
PER1006833 |
1 |
2.43 |
2,770 |
|
Apurímac |
PER1006006 |
1 |
2.43 |
3,500 |
|
Cajamarca |
PER1006664; PER1006673 |
20 |
48.78 |
2,600–3,460 |
|
PER1006676; PER1010656 |
||||
|
PER1010657; PER1010658 |
||||
|
PER1006722; PER1010659 |
||||
|
PER1006734; PER1006807 |
||||
|
PER1010661; PER1010662 |
||||
|
PER1010663; PER1010664 |
||||
|
PER1006827; PER1010666 |
||||
|
PER1006921; PER1006922 |
||||
|
PER1006934; PER1010667 |
||||
|
Cusco |
PER1006116; PER1006157 |
9 |
21.95 |
2,651–3,391 |
|
PER1006216; PER1006223 |
||||
|
PER1006276; PER1006299 |
||||
|
PER1006310; PER1006382 |
||||
|
PER1010654 |
||||
|
Junín |
PER1006446; PER1006495 |
2 |
4.87 |
3,209–3,507 |
|
La Libertad |
PER1006523; PER1006549 |
4 |
6.98 |
2,600–4,000 |
|
PER1006811; PER1006815 |
||||
|
Puno |
PER1006555; PER1006570 |
4 |
11.63 |
3,035–3,895 |
|
PER1006571; PER1006590 |
||||
|
Total accessions |
- |
41 |
100 |
- |
Study area
The study was conducted at the EEA Santa Ana, located in the district of El Tambo, province of Huancayo, Junín region (12°00’42.36” S, 75°13’17.60” W), in the southeastern part of the Mantaro Valley, an important agricultural area in the Peruvian Andes (Figure 1). The station is situated between 3,303 and 3,325m a.s.l., on an alluvial fan with predominantly flat topography (Enriquez et al., 2025).
During the evaluation period (2022–2024), temperatures ranged from 5.56°C to 22.42°C; relative humidity varied between 60.35% and 86.07%, while monthly precipitation fluctuated between 11.8mm (October 2024) and 145.9mm (February 2024), according to data from the National Meteorology and Hydrology Service (SENAMHI, 2024).
The research was carried out in plots No. 22 and 24 of EEA Santa Ana over two consecutive growing seasons (2022–2023 and 2023–2024), located at an average altitude of 3,295m a.s.l. (12°00’16” S, 75°13’16” W). Sowing took place on clay-loam soils with slightly acidic pH (6.2–6.6), electrical conductivity ranging from 2.4 to 5.4mS/m, and organic matter content between 1.5% and 3.09%, under controlled rigation conditions.
Methodology
Soil preparation and cultivation of plants
Land preparation in both growing seasons involved the formation of four furrows per plot, each 5m in length. Each plot was sown with 96 seeds per accession, placing three seeds per planting site, establishing a spatial arrangement of 0.80m between plants and 1.0m between rows. Two-meter-wide alleys were left between plots, in which maize (Zea mays) was planted to prevent cross-pollination, facilitate evaluations and ensure the genetic representativeness of each accession.
Regarding cultural or agronomic management, seeds were disinfected with a 0.5% solution of Vitamax 300 (Carboxin 200g/Kg + Captan 200g/Kg) to prevent disease. Manual weeding was carried out between 35 and 45 days after sowing. To ensure plant establishment, four flood irrigations were applied, and soil moisture was monitored in later stages, taking advantage of seasonal rainfall from December to May.
Fertilization was applied at two stages: 50% at sowing and the remaining 50% during hilling. The nutrient ratio used was 20-80-40 of N, P2O5 and K2O, ensuring adequate nutrient supply for optimal crop development. Routine weeding and irrigation were carried out as needed throughout the season.
A total of 41 plots, each measuring 20m² and consisting of four rows, were established and evaluated. During each growing season, five plants were randomly selected from the central rows of each plot to minimize edge effects, individually labelled, and subjected to agromorphological characterization. The total area allocated to the experiment was approximately 1,000m² per agricultural season.
Morphological characterization
A total of 30 agromorphological descriptors were evaluated; of these, 26 were adopted from IBPGR (1981) as reference, while the remaining 4 were proposed by the researchers based on local agroecological conditions and the priorities of the conservation and breeding programme. Of the 30 descriptors, 17 were qualitative and 13 quantitative. During flowering, evaluations were conducted when more than 50% of the plants per accession displayed flowers. The intensity of flower colour was observed, and a general qualitative assessment was recorded through observation of the entire plot. Days to harvest were evaluated as the number of days from sowing until 50% of the pods per accession reached physiological maturity and were suitable for harvest.
Qualitative descriptors
Table 2 presents the qualitative descriptors used in the agromorphological characterization of tarwi throughout the crop's phenological cycle. Evaluation considered various plant structures, including morphological characteristics of the stem, leaves, flowers, inflorescences, pods, and seeds.
Table 2. Qualitative morphological traits evaluated in the study, with their respective descriptors and categories according to the scoring scale. *, Variables proposed by the researchers of EEA Santa Ana.
|
Acronym |
Morphological descriptor |
Categories |
|
PGPE* |
Pigmentation of petioles |
0 Absent, 1 Present |
|
IFBCJBO |
Intensity of flower bud colour just before opening |
1 Very Light*, 3 Light, 5 Medium, 7 Dark, 9 Very dark* |
|
FWCJBO |
Flower wing colour just before opening |
1 White, 2 Yellow, 3 Orange, 4 Pink, 5 Red, 6 Green, 7 Blue, 8 Purple, 9 Brown, 10 Lilac* |
|
CCSSJOF |
Colour of central spots of standard of just opened flower |
0 Absent central spots, 1 White, 2 Yellow, 3 Orange, 4 Pink, 5 Red, 6 Green, 7 Blue, 8 Purple, 9 Brown, 10 Lilac* |
|
IRCSJOF |
Intermediate region colour of standard of just opened flower |
0 Absent intermediate region, 1 White, 2 Yellow, 3 Orange, 4 Pink, 5 Red, 6 Green, 7 Blue, 8 Purple, 9 Brown, 10 Lilac* |
|
IFKCJBO |
Intensity of flower keel colour just before opening |
1 Very light*, 3 Light, 5 Medium, 7 Dark, 9 Very dark* |
|
FWCJBW |
Flower wing colour just before wilting |
1 White, 2 Yellow, 3 Orange, 4 Pink, 5 Red, 6 Green, 7 Blue, 8 Purple, 9 Brown, 10 Lilac* |
|
MBCSFJBW |
Marginal band colour of standard of flower just before wilting |
0 Absent marginal band, 1 White, 2 Yellow, 3 Orange, 4 Pink, 5 Red, 6 Green, 7 Blue, 8 Purple, 9 Brown, 10 Lilac* |
|
CCSSFJBW |
Colour of central spots of standard of flower just before wilting |
0 Absent central spots, 1 White, 2 Yellow, 3 Orange, 4 Pink, 5 Red, 6 Green, 7 Blue, 8 Purple, 9 Brown, 10 Lilac* |
|
IRCSFJBW |
Intermediate region colour of standard of flower just before wilting |
0 Absent intermediate region, 1 White, 2 Yellow, 3 Orange, 4 Pink, 5 Red, 6 Green, 7 Blue, 8 Purple, 9 Brown, 10 Lilac* |
|
FKCJBW |
Flower keel colour just before wilting |
1 White, 2 Yellow, 3 Orange, 4 Pink, 5 Red, 6 Green, 7 Blue, 8 Purple, 9 Brown, 10 Lilac* |
|
UFP |
Uniformity of flowering of the plot |
0 None, 3 Little, 5 Medium, 7 Very Much |
|
MPP |
Mature pod pubescence |
0 Absent, 3 Slight, 5 Medium, 7 Strong |
|
SSH |
Seed shape |
1 Spherical, 2 Flattened spherical or lenticular, 3 Oval, 4 Flattened oval, 5 Cuboid, 6 Flattened cuboid |
|
SL |
Seed luster |
1 Mate, 2 Brilliant |
|
PSC |
Primary seed colour |
1 White, 2 Yellow, 3 Orange, 4 Pink, 5 Red, 6 Green, 7 Blue, 8 Purple, 9 Brown, 10 Lead*, 11 Bayo*, 12 Black* |
|
IPSC |
Intensity primary seed colour |
1 Very Light*, 3 Light, 5 Medium, 7 Dark, 9 Very Dark* |
Quantitative descriptors
For the agromorphological characterization, ten quantitative descriptors were used, specifically selected according to the guidelines established by IBPGR (1981) for lupins (Table 3), of which three descriptors were proposed by researchers from EEA Santa Ana. These descriptors made it possible to evaluate phenotypic variations related to plant development and morphology, such as yield per plant, yield per plot, days to harvest, among others, contributing to a better understanding of the genetic diversity present in the evaluated material.
Table 3. Quantitative morphological characteristics observed in the study, descriptors and unit of measurement. *, Variables proposed by the researchers of EEA Santa Ana.
|
Acronym |
Morphological descriptor |
Unit |
|
ST |
Stem thickness |
mm |
|
NPB |
Number of primary branches |
Number branches per plant |
|
LNS |
Leaflets number per leaf |
Number |
|
LI |
Length of inflorescences |
cm |
|
NPCA |
Number of pods per central axis |
Number per central axis |
|
TNPP |
Total number of pods per plant |
Number per plant |
|
PLMS |
Pod length on the main stem |
cm |
|
PWMS |
Pod width on the main stem |
cm |
|
TSWHS |
Total seed mass in hundred seeds |
g |
|
YPLA |
Yield per plant |
g |
|
YPLO* |
Yield per plot |
kg/ha |
|
STH* |
Seed thickness |
mm |
|
DH* |
Days to harvest |
days |
Field evaluations
Field observations began during the seedling stage, ten days after sowing (DAS), once at least 50% of the cotyledons had emerged in an accession. During the flowering stage (110 to 150 DAS), evaluations were conducted when 50% of the plants had flowers. Traits recorded included stem thickness, number of primary branches, number of leaflets per leaf, and days to reach 50% flowering. For the flowers, the colour and intensity of the floral bud before opening were assessed, as well as the colour and intensity of the wings and keel of the newly opened flower. The colouration of the marginal band, central spot and intermediate zone of the standard petal was also described, both in the open flower and before wilting. In addition, the length of the main inflorescence was measured.
The maturation phase was evaluated when more than 50% of the plants showed mature pods. At this stage, the colour and intensity during pod formation and maturity (green stage), presence of pubescence on mature pods, number of pods on the main axis and per plant, as well as pod dimensions (length and width) were recorded.
Finally, seed evaluation was conducted after harvest (210–295 DAS), assessing seed shape, dimensions (length, width, thickness), brightness, colour and its intensity, weight of 100 seeds (with moisture content below 12%), and yield per plant and plot.
Statistical analysis
Statistical analyses were performed using combined data from two consecutive agricultural seasons (2022–2023 and 2023–2024), processed with R software version 4.3.3 (R Core Team, 2023). For the quantitative descriptors, a multivariate approach was applied in four stages. First, descriptive statistics (mean, range, standard deviation and coefficient of variation) were calculated to assess phenotypic variability among accessions. Second, a principal component analysis (PCA) was conducted using the FactoMineR package (Lê et al, 2008) and factoextra (Kassambara & Mundt, 2020), to reduce the dimensionality of the dataset and visualize the multivariate distribution of the accessions.
Based on the principal components, a hierarchical cluster analysis (HCA) was carried out using Euclidean distance and Ward’s method (Everitt et al, 2011), allowing the identification of homogeneous morphological groups, which were represented by a dendrogram. A heatmap was then generated to simultaneously visualize the similarity between accessions and the correlations among variables, facilitating the exploration of phenotypic variation patterns (Wilkinson & Friendly, 2009). Finally, Pearson correlation analysis (Pearson, 1895) was applied to assess associations among structural, reproductive and productive traits, identifying significant relationships between key variables.
For the analysis of qualitative descriptors, the most representative data per plot were considered. A frequency analysis was conducted, and the Shannon-Weaver diversity index (H′) was incorporated to evaluate the phenotypic diversity of each trait. The standardized value of H′ was calculated using its corresponding formula:
The Shannon-Weaver diversity index (H′) is a metric that helps to understand the variety of traits within a group. Its calculation requires n, the total number of different categories or traits observed for a specific descriptor, and Pi, which represents the relative proportion of individuals exhibiting a particular trait. The calculation also involves ln, the natural logarithm.
According to Eticha et al (2005), the index values are interpreted as follows: low diversity (0.10 ≤ H ≤ 0.40), intermediate diversity (0.40 ≤ H ≤ 0.60), and high diversity (H ≥ 0.60).
Results and discussion
Quantitative variables of the tarwi collection
Descriptive analysis and Shannon-Weaver diversity index
The descriptive analysis of 13 quantitative variables revealed notable genetic variability among the tarwi accessions (Table 4), as evidenced by the wide range of observed values. Yield per plant (YPLA) stood out, with a broad range from 22 to 276g and an average of 40.63 ± 2.6g/plant. This variation suggests a strong genetic component, with at least seven accessions exceeding 100g/plant, consistent with findings reported by Mujica et al (2021).
Yield per plot (YPLO) also showed high variability, ranging from 65.5 to 1697.5kg/ha. Among the reproductive traits, the total number of pods per plant (TNPP) showed the greatest dispersion, followed by the number of pods on the central axis (NPCA) and the number of primary branches (NPB), reflecting significant structural differences between accessions. In contrast, pod length (PLMS) and pod width (PWMS) were more stable, with averages of 9.48cm and 1.59cm, respectively, values that fall within the ranges reported by Gulisano et al (2019) for tarwi accessions evaluated under Andean conditions.
Other traits, such as inflorescence length (LI), number of leaflets per leaf (LNS) and stem thickness (ST), exhibited moderate variation. The most stable variables were days to harvest (DH) and seed thickness (STH), suggesting stronger genetic regulation.
Table 4. Descriptive statistics and analysis of 13 quantitative morphological traits of tarwi accessions (Grouped values from 2022-2024).
|
Acronym |
Descriptor |
Min |
Max |
Range |
Mean ± SE |
|
DH |
Days to harvest |
211 |
295 |
84 |
259.8 ± 2.21 |
|
LI |
Length of inflorescences |
13 |
65 |
52 |
36.74 ± 0.41 |
|
LNS |
Leaflets number per leaf |
7 |
10 |
3 |
8.42 ± 0.04 |
|
NPB |
Number of primary branches |
4 |
27 |
23 |
15.4 ± 0.21 |
|
NPCA |
Number of pods per central axis |
6 |
34 |
28 |
16.3 ± 0.2 |
|
PLMS |
Pod length on the main stem |
5.92 |
12 |
6.08 |
9.48 ± 0.04 |
|
PWMS |
Pod width on the main stem |
1.2 |
2.2 |
1 |
1.59 ± 0.01 |
|
ST |
Stem thickness |
4.35 |
11.05 |
6.7 |
7.09 ± 0.05 |
|
STH |
Seed thickness |
3.69 |
8.31 |
4.62 |
5.33 ± 0.03 |
|
TNPP |
Number of pods per plant |
10 |
280 |
270 |
68.93 ± 1.87 |
|
TSWHS |
Total seed mass in hundred seeds |
21.84 |
39.82 |
17.98 |
28.58 ± 0.44 |
|
YPLA |
Yield per plant |
22 |
276 |
254 |
40.63 ± 2.6 |
|
YPLO |
Yield per plot |
65.5 |
1697.5 |
1652 |
409.81 ± 34.41 |
Correlation analysis
Figure 2 illustrates the interrelationships among various agromorphological traits, highlighting particularly strong associations. A notable example is the high correlation observed between the number of primary branches (NPB) and the number of leaflets per leaf (LNS, r = 0.84), suggesting that plants with greater branching tend to develop more abundant foliage. This trait indicates a more vigorous and well-developed plant architecture, an essential aspect that previous studies on the diversity and agronomic performance of tarwi have positively linked to the crop's productive potential (Gulisano et al, 2022).
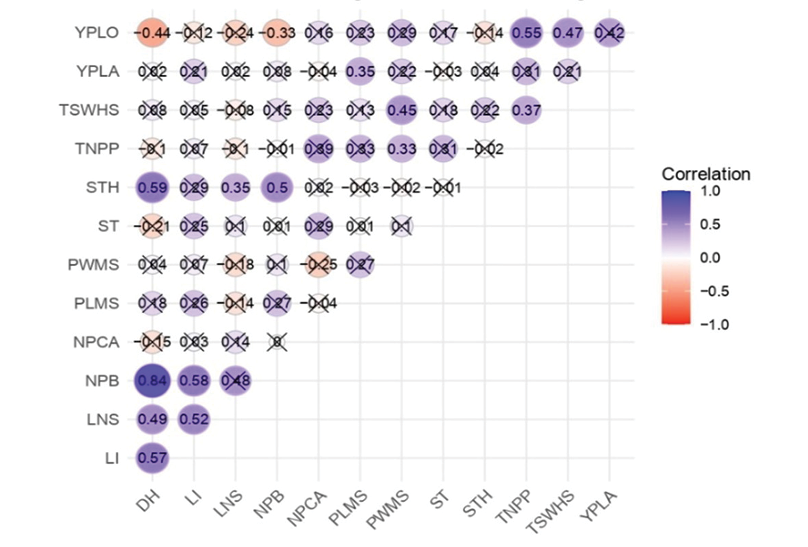
Figure 2. Pearson correlation matrix among the quantitative agromorphological variables evaluated in tarwi accessions. The colour intensity and size of the circles represent the strength and direction of the correlation: blue for positive correlations and red for negative ones. Only statistically significant correlations (p < 0.05) are displayed with coloured circles, while non-significant correlations are marked with an ‘X’. Trait abbreviations are as in Table 3.
Another important finding is that yield per plant (YPLA) is significantly associated with reproductive traits such as the total number of pods (TNPP, r = 0.47), 100-seed weight (TSWHS, r = 0.45), and seed thickness (STH, r = 0.45). In other words, plants that produce more and better seeds tend to yield more, which is logical and has been confirmed in other studies on legumes (Saxena, 2018).
It was also observed that yield per plot (YPLO) shows a negative relationship with several individual traits, such as days to harvest (DH, r = -0.44). Additionally, adverse factors such as water or heat stress may further exacerbate these losses by affecting the phenological development of the plants. In this context, mechanisms such as phenological escape, the ability of some plants to complete their life cycle before unfavourable climatic conditions occur, can play a key adaptive role by indirectly reducing the number of days to harvest (Blum, 2011).
Principal component analysis (PCA)
The PCA shown in Figure 3 allowed for the synthesis of the multivariate variability present among the accessions, facilitating the identification of the most relevant traits in terms of phenotypic diversity.
In the contribution of variables to PC1 (Figure 3c), the most influential traits were days to harvest (DH), number of primary branches (NPB) and inflorescence length (LI), followed by number of leaflets per leaf (LNS) and seed thickness (STH). These variables are mainly associated with morphological and vegetative development aspects, indicating that PC1 reflects differences in plant growth and architecture. These traits are critical for adaptation to diverse agroecological conditions, as documented by Lizarazo et al (2010) in studies of Lupinus species adapted to temperate and Andean regions.
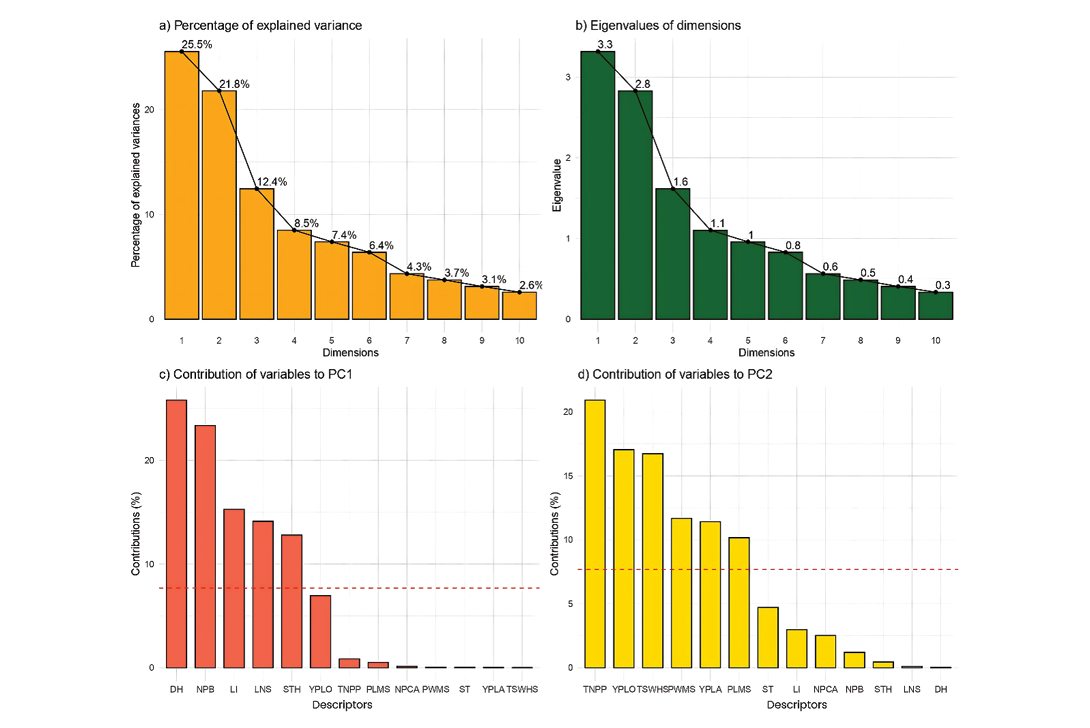
Figure 3. (a) Proportion of variance (%) of top ten principal components (PCs) , (b) eigenvalues of top 10 PCs, (c) contribution of variables to PC1 (%), and (d) contribution of variables to PC2 (%) derived from principal component analysis (PCA). Red dashed lines across bar plots are the reference lines, and the variable bars above the reference lines are considered important in contributing to the respected PCs. Trait abbreviations are as in Table 3.
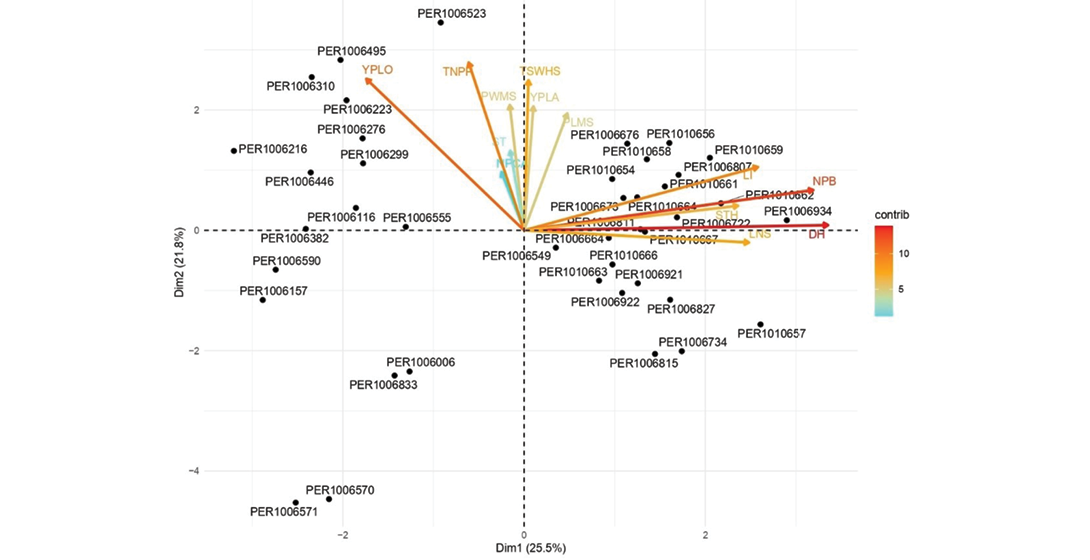
Figure 4. Principal component analysis (PCA) biplot of quantitative traits, illustrating the relative distribution of accessions (black dots) and the contribution of each trait (coloured vectors) to the first two principal components: Dim1 (25.5%) and Dim2 (21.8%), which together explain 47.3% of the total variation. The direction and length of each vector indicate the strength and influence of that trait in shaping the multivariate space, while the colour gradient from blue (low contribution) to red (high contribution) represents the relative importance of each variable in the PCA. Trait abbreviations are as in Table 3.
Meanwhile, PC2 was strongly influenced by yield-related variables, such as total number of pods per plant (TNPP), yield per plot (YPLO), 100-seed weight (TSWHS) and pod width on the main stem (PWMS). This dimension appears to group variables directly related to productivity, which is of great interest for breeding programmes. According to Chalampuente et al (2023), these traits are highly selectable and directly related to yield potential under different agroclimatic conditions. The inclusion of the variables YPLA (yield per plant) and PLMS (pod length) in this dimension further reinforces the predictive value of these variables as complementary indicators of reproductive performance, as also suggested by Galloni et al (2007) in yield studies of Mediterranean legumes.
Figure 4 presents a biplot derived from the PCA, summarizing the multivariate variation of the accessions based on the first two principal components (PC1 and PC2), which together explain 47.3% of the total variability (25.5% and 21.8%, respectively). This representation allows for the simultaneous visualization of the relative distribution of accessions and the influence of quantitative variables on that distribution (Jollife & Cadima, 2016).
The analysis reveals three well-defined patterns, each with distinct phenotypic and agronomic characteristics. The first pattern, located mainly in quadrant III (negative values on both dimensions), includes accessions such as PER1006570, PER1006571, PER1006006, and PER1006833, which are associated with low values for most variables, especially those with high factor loadings such as DH (days to harvest), NPB (number of primary branches) and LI (inflorescence length).
The second pattern, found in quadrant I (positive PC1 and positive PC2), groups accessions such as PER1010662, PER1010659, PER1010664, PER1010671, PER1010656, PER1006934 and PER1010661. These are associated with variables strongly loaded on PC1, such as DH, NPB, LI and STH (seed thickness), indicating a prominent morpho-structural profile and relevant agronomic potential, especially in contexts where these traits provide adaptive or productive advantages (Mohammadi & Prasanna, 2003).
The third pattern, in quadrant II (negative PC1 and positive PC2), includes accessions such as PER1006495, PER1006523, PER1006310, PER1006216 and PER1006299, which are related to yield-related variables such as YPLO (yield per plot), TNPP (total number of pods per plant), TSWHS (100-seed weight) and PWMS (pod width). This profile suggests high productive potential, valuable for yield-oriented selection programmes (Bustos-Korts et al 2019)
Variables such as TSWHS, TNPP, LI, NPB, DH and YPLO stand out for their strong contribution to the total variability, positioning them as key factors in structuring the multivariate space. Moreover, the proximity and shared direction of vectors such as PLMS (pod length) and YPLA (yield per plant) suggest collinearity, possibly indicative of functional relationships or redundance.
Cluster dendrogram of hierarchical clustering
Figure 5 presents a dendrogram generated through hierarchical cluster analysis (HCA) using Euclidean distance and the complete linkage method, from which three phenotypically distinct clusters were identified. The first group (green) comprises the majority of the accessions, which show smaller hierarchical distances among themselves, suggesting high phenotypic similarity and possibly lower genetic divergence.
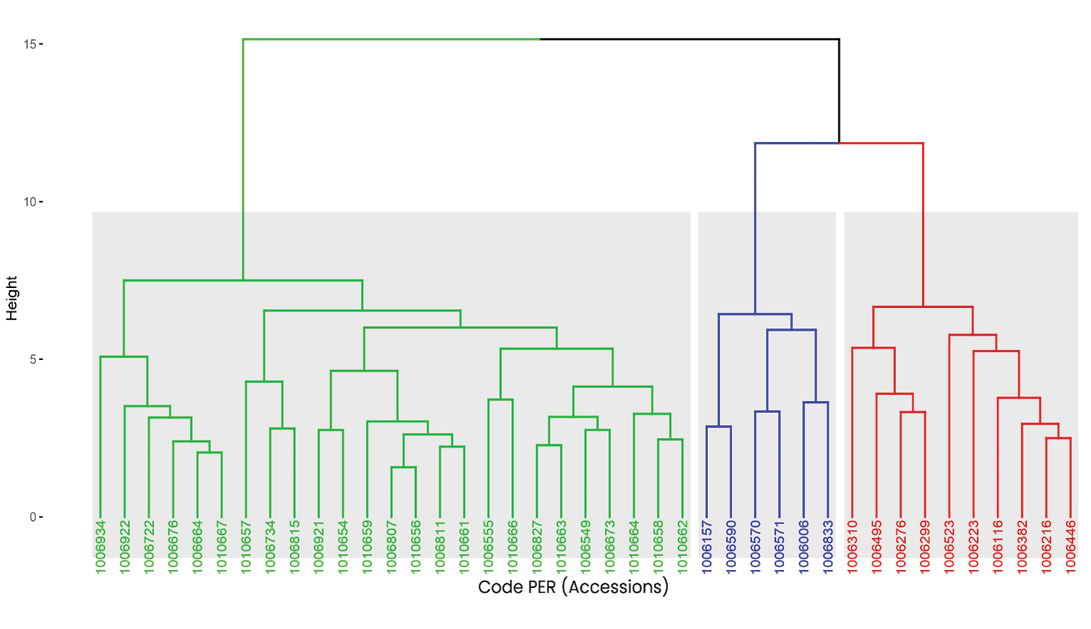
Figure 5. Dendrogram derived from Hierarchical Cluster Analysis of tarwi accessions, based on Euclidean distance and the complete linkage method. The analysis reveals three main clusters, represented by green, blue, and red branches. Each group reflects varying levels of phenotypic similarity, with shorter branch lengths indicating greater similarity among accessions.
The second group (blue) includes accessions such as PER1006157, PER1006570, and PER1006590, which are characterized by a distinct configuration, possibly influenced by extreme values in certain agronomic variables.
The third group (red) comprises accessions such as PER1006495, PER1006523 and PER1006310, which show greater hierarchical distance from the other groups, indicating significant divergence in the evaluated traits. This clustering pattern supports the structure observed in PCA, reinforcing the existence of subgroups with distinct agronomic profiles.
The combined use of PCA and dendrogram analysis has been widely validated in genetic diversity and germplasm characterization studies of various agricultural species, such as common bean (Özkan et al, 2022), garlic (Pasupula et al, 2024) and rice (Nascimento et al, 2011), proving useful for optimizing parent selection in breeding programmes. Moreover, this hierarchical organization provides a basis for both in situ and ex situ conservation planning and the identification of promising genotypes for breeding, as highlighted in quinoa studies by Delgado et al (2024).
Heat map clustering
Figure 6 presents a hierarchical clustering analysis classifying the 41 accessions into three main clusters based on standardized trait values. Cluster 1 (blue bar) comprises accessions such as PER1006934, PER1006862, PER1006722 and PER1010664, characterized by intermediate to high values across structural and yield-related traits. Cluster 2 (pink bar) shows greater phenotypic heterogeneity, with elevated DH and PLMS, while Cluster 3 includes accessions PER1006310, PER1006495, PER1006299 and PER1006523, distinguished by high TNPP and TSWHS.
The heatmap reveals cluster-dependent trait associations. While some accessions show coordinated high expression of TNPP, YPLA and YPLO, consistent with productivity models in grain legumes (Clements & Cowling, 1994), this pattern is not universal. Several genotypes exhibit high TNPP without proportionally elevated yield, indicating that pod number alone does not determine productivity. This decoupling likely reflects compensatory effects related to seed weight, pod fill efficiency, or seed abortion rates.
Morphological traits (LI, LNS) exhibit independent patterns from yield variables, suggesting that vegetative vigour and reproductive output are not strongly linked in this germplasm, consistent with observations in other legumes (Mousavi-Derazmahalleh et al, 2018). DH displays considerable variation with no clear association with productivity traits. Notably, several early-maturing accessions demonstrate competitive yields, indicating that earliness and productivity are not mutually exclusive, with important implications for breeding programmes in high-Andean regions with short growing seasons (Tohme et al, 1995)
Figure 6 complements the global correlation analysis (Figure 2) by revealing cluster-specific trait relationships, providing valuable insights for targeted germplasm selection based on specific breeding objectives.
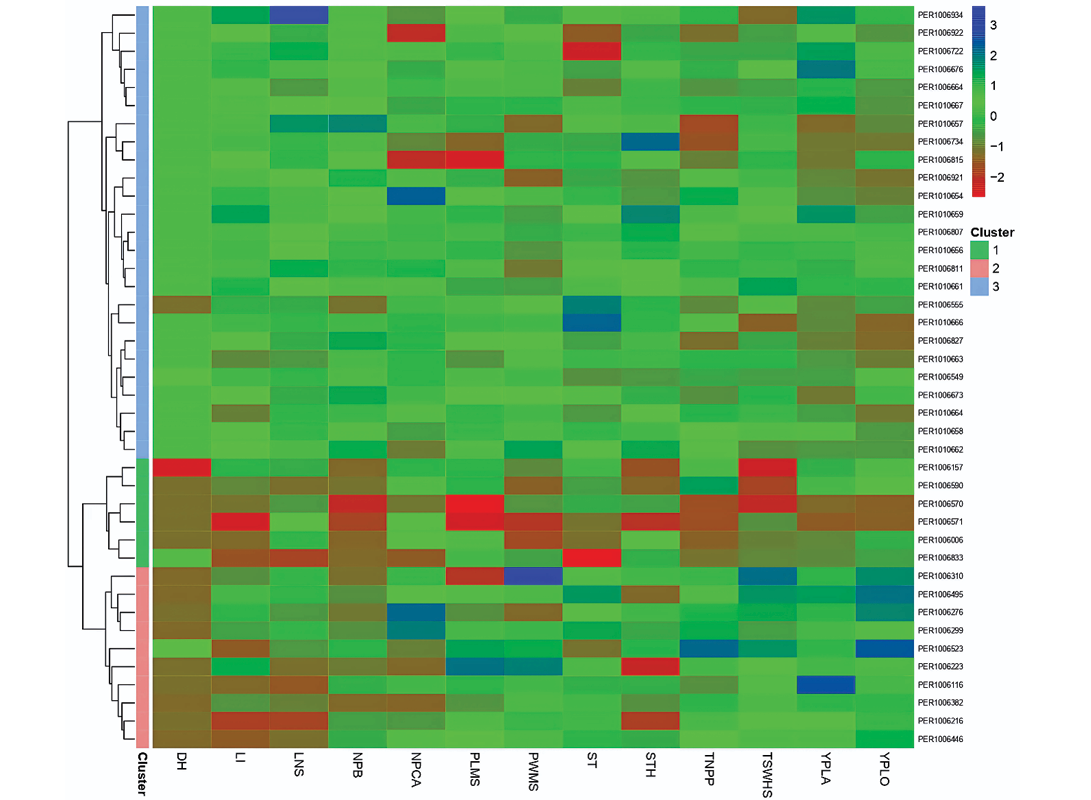
Figure 6. Heatmap with hierarchical clustering of tarwi accessions based on quantitative traits. The dendrogram classifies 41 accessions into three main clusters (coloured bars: blue, Cluster 1; pink, Cluster 2; green, Cluster 3). The heatmap displays standardized values (z-scores) of 14 morphological and agronomic variables. The colour scale ranges from blue (low values) through green (intermediate) to red (high values), revealing cluster-specific trait associations.
Group description
The comparison among the three clusters (Table 5) reveals clearly differentiated phenotypic profiles among the evaluated tarwi accessions.
Cluster 2 includes the most productive accessions, with high values for yield per plant (78.73g), yield per plot (746.4kg/ha), and number of pods per plant (82.01), positioning them as promising candidates for yield-oriented breeding programmes. Similar clustering approaches have been successfully applied in other crops, such as cucumber (Cucumis sativus), to identify high-yielding genotypes (Serhiienko et al, 2023).
Cluster 3, in contrast, includes accessions with enhanced vegetative growth, characterized by a longer crop cycle (269.68 days), taller plants, and a greater number of branches and pods. Although their yields are moderate, these traits offer advantages in sustainable agricultural systems, especially in the Andean highlands, where long-cycle crops help maintain soil cover, increase organic matter inputs, and promote biological nitrogen fixation. These features make them particularly valuable in crop rotation schemes or in degraded soils (Jacobsen & Mujica, 2006).These accessions exhibit a more robust plant architecture, characterized by tall stature, greater number of primary branches, and an extended vegetative period, consistent with findings reported by Camarena (2012).
Cluster 1 includes early maturing accessions (243.58 days) with smaller plant size and lower yield. Nonetheless, these accessions could be strategically important in environments affected by abiotic stress, functioning as escape-type varieties that complete their life cycle before the onset of critical stress periods, a strategy also observed in cereals such as wheat and barley (Tambussi, 2006).
Altogether, these results highlight the functional diversity of the studied materials and provide valuable information for selecting accessions according to different production goals.
Regarding the comparison of the three clusters using analysis of variance, we found that the majority of morphological descriptors exhibited clear differences among groups. Of the 13 traits evaluated, eleven were statistically different among clusters, while only two remained relatively uniform. This suggests that the three groups represent truly morphologically distinct entities, each with its own characteristic profile.
The most determinant descriptors, such as NPB, exhibited the most pronounced differences among groups, with a progressive and consistent increase: Cluster 1 with 10.63, Cluster 2 with 12.97, and Cluster 3 with 17.51 (p < 0.001). This pattern demonstrates clear differentiation in plant architecture, possibly reflecting distinct adaptation strategies.
Descriptor DH also clearly differentiated the groups. Plants in Cluster 3 required significantly more time to reach maturity, approximately 270 days, compared to Clusters 1 and 2, which reached maturity in 243–245 days (p < 0.001). LI exhibited a similar pattern, progressively increasing from Cluster 1 (32.17) to Cluster 3 (38.81), indicating changes in foliar morphology (p < 0.001).
In terms of yield components, TSWHS was higher in Cluster 2 (30.87) compared to the other groups (p < 0.001), suggesting superior reproductive quality in this cluster. YPLO showed greater variability, with Cluster 2 being significantly superior (746.4) to Clusters 1 and 3 (p < 0.001). YPLA also differentiated the groups, with Cluster 2 showing considerably higher values (p < 0.001).
Interestingly, NPCA and ST showed no significant variation among clusters (p > 0.05), indicating that these traits remain relatively stable in the population regardless of cluster assignment, suggesting that these characteristics are less influenced by the factors that determine cluster differentiation.
Table 5. Cluster means and ANOVA for different descriptors. Cluster means based on the grouping generated in Figure 5. ***, p < 0.001; **, p < 0.01; *, p < 0.05; ns, not significant. DH, days to harvest; LI, inflorescence length; LNS, number of leaflets per leaf; NPB, number of primary branches; NPCA, number of pods on the central axis; PLMS, pod length; PWMS, pod width; ST, stem thickness; STH, seed thickness; TNPP, total number of pods per plant; TSWHS, total seed mass in hundred seeds; YPLA, yield per plant; YPLO, yield per plot.
|
Descriptor |
Cluster 1 (n = 6) |
Cluster 2 (n = 10) |
Cluster 3 (n = 25) |
F-value |
p-value |
Significance |
|
DH |
243.58 ± 12.38 |
244.85 ± 7.97 |
269.68 ± 5.65 |
46.594 |
0.0000 |
*** |
|
LI |
32.17 ± 2.53 |
34.35 ± 3.47 |
38.81 ± 2.21 |
27.631 |
0.0000 |
*** |
|
LNS |
8.22 ± 0.29 |
8.14 ± 0.22 |
8.58 ± 0.32 |
3.333 |
0.0463 |
* |
|
NPB |
10.63 ± 1.26 |
12.97 ± 1.24 |
17.51 ± 1.88 |
66.852 |
0.0000 |
*** |
|
NPCA |
15.91 ± 1.44 |
16.65 ± 2.16 |
16.18 ± 1.6 |
0.823 |
0.4464 |
ns |
|
PLMS |
9.18 ± 0.7 |
9.55 ± 0.53 |
9.52 ± 0.35 |
4.246 |
0.0216 |
* |
|
PWMS |
1.49 ± 0.05 |
1.65 ± 0.11 |
1.59 ± 0.06 |
5.181 |
0.0102 |
* |
|
ST |
6.68 ± 0.59 |
7.28 ± 0.4 |
7.12 ± 0.47 |
1.924 |
0.1598 |
ns |
|
STH |
5.07 ± 0.29 |
5.18 ± 0.32 |
5.45 ± 0.23 |
3.420 |
0.0430 |
* |
|
TNPP |
57.08 ± 21.8 |
82.01 ± 13.89 |
65.95 ± 14.4 |
7.777 |
0.0014 |
** |
|
TSWHS |
24.66 ± 1.83 |
30.87 ± 2.19 |
28.6 ± 1.85 |
22.310 |
0.0000 |
*** |
|
YPLA |
36.02 ± 19.52 |
78.73 ± 28.99 |
59.3 ± 33.35 |
11.150 |
0.0001 |
*** |
|
YPLO |
334.83 ± 222.45 |
746.4 ± 175.05 |
325.97 ± 154.76 |
23.747 |
0.0000 |
*** |
Qualitative variables of the tarwi collection
Phenotypic characteristics of flowers and seeds of representative accessions grouped by clusters
Figure 7 illustrates the relationship between the evaluated phenotypic traits, highlighting that Cluster 1 was composed exclusively of accessions with white seeds and blue flowers. Among these, the most representative were PER1006833 and PER1006006, indicating high uniformity in these descriptors.
Similarly, Cluster 2 comprised only accessions with white seeds. However, although most (n = 9) had blue flowers, one particular accession (PER1006310) exhibited pink flowers, revealing a slight variation in this floral trait.
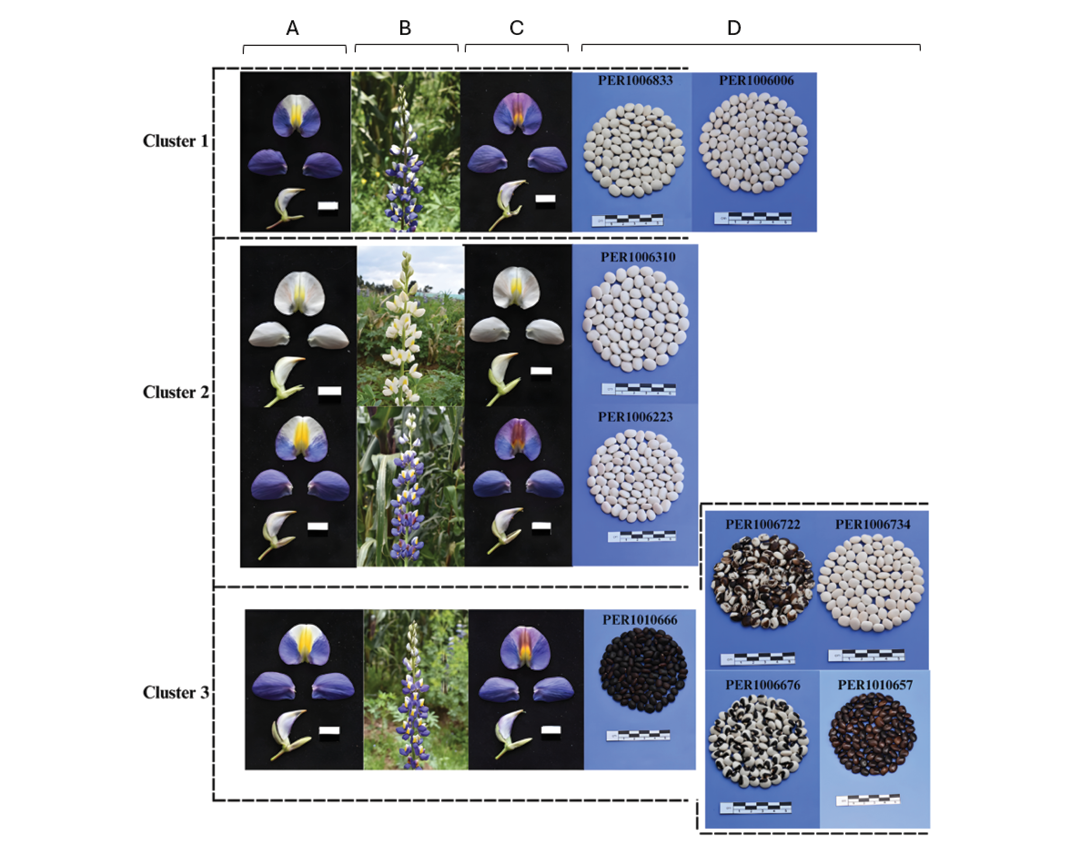
In contrast, Cluster 3 was characterized by greater variability in seed colour, including accessions with white, black, brown, and dark-toned seeds. Of the 25 accessions in this cluster, 8 showed seed colours other than white, while 17 retained the white colour. Despite this seed colour diversity, all accessions in Cluster 3 shared the same flower colour, blue.
Frequency analysis and Shannon index
The qualitative traits of tarwi are presented in Table 6, where 14 descriptors were evaluated. Three traits (SL, CCSSJOF and IRCSJOF) were excluded due to being monomorphic and not contributing to morphological variability. The results included the conversion of phenotypic classes and their estimated diversity using the Shannon index (H′), revealing significant variability among the analyzed traits, particularly in flower colour, pubescence of mature pods, and seed shape.
For petiole pigmentation (PGPE), 92.68% of the accessions showed pigment presence. Regarding the intensity of the flower bud colour before opening (IFBCJBO), the ‘medium’ class was predominant (51.22%), followed by ‘dark’ (21.95%), ‘light’ (14.63%), and ‘very dark’ (12.20%). This distribution corresponds to the colour of the flower wing before opening (FWCJBO), which was blue in 97.56% of the accessions and pink in only one (2.44%).
The flower keel before opening (IFKCJBO) predominantly exhibited pale tones, with 70.73% of the ‘very light’ category. Upon wilting, the colour of the flower wing (FWCJBW), the marginal band of the standard petal (MBCSFJBW), and the flower keel (FKCJBW) remained blue or purple in almost all accessions, while the colour of the central spot of the standard (CCSSFJBW) was more diverse: purple (82.93%), lilac (14.63%) and white (2.44%).
The colour of the intermediate region of the standard petal after wilting (IRCSFJBW) was mostly orange (56.10%), followed by brown (39.02%) and yellow (4.88%). Flowering uniformity (UFP) was high, with 68.29% of accessions classified as ‘very uniform’.
Regarding pubescence in mature pods (MPP), moderate pubescence was most frequent (68.29%), while the rest showed either light (12.20%) or strong pubescence (19.51%). Seed shape (SSH) was mostly oval (92.68%), with some lenticular or flattened oval variants. The primary seed colour (PSC) was predominantly white (80.49%), while the remaining accessions exhibited black (14.63%) and brown (4.88%) seeds. For seed colour intensity (IPSC), the ‘medium’ class predominated (80.49%).
H′ was used to quantify phenotypic variability in the descriptors. High diversity (H′ > 0.60) was observed in variables such as IFBCJBO, IRCSFJBW, MPP, IFKCJBO, UFP and PSC, indicating good potential for genetic improvement programmes. Intermediate diversity (0.40 < H′ ≤ 0.60) was found in CCSSFJBW and IPSC, while low diversity (0.10 ≤ H′ ≤ 0.40) was recorded in SSH, PGPE and several floral descriptors (FWCJBO, FWCJBW, MBCSFJBW, FKCJBW), suggesting uniformity in these traits similar to the findings of Azam et al (2024) in pea genotypes.
Table 6. Descriptor states, and frequency of qualitative traits, Shannon Weaver diversity index (H′), descriptor states and frequency of qualitative traits. *, A total of 14 descriptors were evaluated, as three were excluded for being monomorphic and not contributing to genetic variability.
|
Traits |
Morphological descriptor |
Rank |
Phenotypic class |
Frequency |
H´ |
|
PGPE |
Pigmentation of petioles |
0 |
Absent |
3 |
0.2618 |
|
1 |
Present |
38 |
|||
|
IFBCJBO |
Intensity of flower bud colour just before opening |
3 |
Light |
6 |
1.2134 |
|
5 |
Medium |
21 |
|||
|
7 |
Dark |
9 |
|||
|
9 |
Very dark |
5 |
|||
|
FWCJBO |
Flower wing colour just before opening |
4 |
Pink |
1 |
0.1147 |
|
7 |
Blue |
40 |
|||
|
IFKCJBO |
Intensity of flower keel colour just before opening |
1 |
Very light |
29 |
0.7908 |
|
3 |
Light |
4 |
|||
|
5 |
Medium |
8 |
|||
|
FWCJBW |
Flower wing colour just before wilting |
4 |
Pink |
1 |
0.1147 |
|
7 |
Blue |
40 |
|||
|
MBCSFJBW |
Marginal band colour of standard of flower just before wilting |
4 |
Pink |
1 |
0.1147 |
|
7 |
Blue |
40 |
|||
|
CCSSFJBW |
Colour of central spots of standard of flower just before wilting |
1 |
White |
1 |
0.5271 |
|
8 |
Purple |
34 |
|||
|
10 |
Lilac |
6 |
|||
|
IRCSFJBW |
Intermediate region colour of standard of flower just before wilting |
2 |
Yellow |
2 |
0.8388 |
|
3 |
Orange |
23 |
|||
|
9 |
Brown |
16 |
|||
|
FKCJBW |
Flower keel colour just before wilting |
1 |
White |
1 |
0.1147 |
|
8 |
Purple |
40 |
|||
|
UFP |
Uniformity of flowering of the plot |
5 |
Medium |
13 |
0.6246 |
|
7 |
Very much |
28 |
|||
|
MPP |
Mature pod pubescence |
3 |
Slight |
5 |
0.8359 |
|
5 |
Medium |
28 |
|||
|
7 |
Strong |
8 |
|||
|
SSH |
Seed shape |
2 |
Flattened spherical or lenticular |
2 |
0.3083 |
|
3 |
Oval |
38 |
|||
|
4 |
Flattened oval |
1 |
|||
|
PSC |
Primary seed colour |
1 |
White |
33 |
0.6033 |
|
9 |
Brown |
2 |
|||
|
12 |
Black |
6 |
|||
|
IPSC |
Intensity primary seed colour |
5 |
Medium |
33 |
0.4936 |
|
9 |
Very dark |
8 |
Conclusions
Based on the exploratory analysis, notable agromorphological diversity was identified, expressed in both vegetative and productive traits. Potential associations were observed between structural and reproductive variables such as number of branches, number of pods, seed thickness, and yield per plant, which may be relevant for the selection of superior materials. In particular, the negative correlation between days to harvest and yield per plot in some accessions opens the possibility of identifying early maturing accessions with good performance, which would be favorable in scenarios of climatic risk or shorter cropping seasons.
The qualitative analysis also revealed appreciable diversity in floral colours, seed shapes, and degrees of pod pubescence traits that, beyond their genetic value, could influence the cultural and commercial acceptance of the crop in different regions. Furthermore, the accessions were grouped into three distinct phenotypic clusters: one with high productive potential, another with predominance of vegetative characteristics, and a third composed of short-cycle materials with intermediate yield.
In this sense, the preliminary results of this study suggest that tarwi represents a valuable resource to guide future conservation strategies, identification of promising accessions, and the development of genetic improvement programmes. While the phenotypic groupings identified are promising, it is still necessary to expand the number of evaluated accessions and carry out complementary analyses to validate and consolidate the observed patterns. Within this framework, this study lays the foundation for more robust research efforts that will contribute to strengthening recommendations for the selection and utilization of materials with desirable agronomic profiles across diverse agroecological contexts.
Data availability statement
The full dataset in this study can be found at the following link: https://doi.org/10.5281/zenodo.15740283. Additional information can be requested from the corresponding author.
Author contributions
Kevin Ortega: Conceptualization, data curation, analyses conduction, investigation, methodology, resources, provision of study materials, validation, visualization, preparation of figures and tables, writing (original draft, review and editing); Eunice Peña: supervision, data curation, resources, provision of study materials, validation, preparation of figures and tables, writing (original draft, review and editing); Carolina Girón: resources, validation, data curation, provision of study materials; Nery Amaro: resources, validation, provision of study materials; Claudia Rios: analysis conduction, methodology, writing (review and editing); Bertha Lopez: resources, validation, provision of study materials; Francis Cerrón: analysis conduction, methodology; Steve Camargo: supervision, conceptualization, visualization, writing (review and editing), acquisition of financial support; Samuel Pizarro: supervision, conceptualization, provision of study materials, formal analysis, investigation, resources, validation.
All authors read and approved the final manuscript.
Conflict of interest statement
The authors confirmed that no conflict of interest exists.
Acknowledgments
The authors express their gratitude to the team actively working on the investment project of the National Institute of Agrarian Innovation ‘PROAGROBIO’ (CUI N° 2480490) and the Sub-Directorate of Genetic Resources. Special thanks to the Continental University, Huancayo Campus, for their constant support of the research work and to the collaborators of the Estación Experimental Santa Ana for their valuable contributions throughout the different phases of the research execution.
Aguilar Angulo, L. (2015). Evaluación del rendimiento de grano y capacidad simbiótica de once accesiones de tarwi (Lupinus mutabilis S.), bajo condiciones de Otuzco - La Libertad [Undergraduate thesis, Universidad Nacional Agraria La Molina]. https://hdl.handle.net/20.500.12996/1626.
Azam, M. G., Sarker, U., Hossain, M. A., Mahabubul Alam, A. K. M., Islam, M. R., Hossain, N., & Alamri, S. (2024). Phenotypic diversity in qualitative and quantitative traits for selection of high yield potential field pea genotypes. Scientific Reports, 14(1), 1–24. https://doi.org/10.1038/s41598-024-69448-7.
Blum, A. (2011). Plant breeding for water-limited environments. Plant Breeding for Water-Limited Environments, 1–255. https://doi.org/10.1007/978-1-4419-7491-4.
Bustos-Korts, D., Boer, M. P., Malosetti, M., Chapman, S., Chenu, K., Zheng, B., & van Eeuwijk, F. A. (2019). Combining crop growth modeling and statistical genetic modeling to evaluate phenotyping strategies. Frontiers in Plant Science, 10. https://doi.org/10.3389/FPLS.2019.01491.
Caligari, P. D. S., Römer, P., Rahim, M. A., Huyghe, C., Neves-Martins, J., & Sawicka-Sienkiewicz, E. J. (2000). The potential of Lupinus mutabilis as a crop. In Knight, R. (eds) Linking Research and Marketing Opportunities for Pulses in the 21st Century (pp. 569–573). Springer, Dordrecht. https://doi.org/10.1007/978-94-011-4385-1_54.
Camarena Mayta, F., Huaringa Joaquín, A., Jiménez Dávalos, J., & Mostacero Neyra, E. (2012). Revaloración de un cultivo subutilizado: chocho o tarwi (Lupinus mutabilis S.) (Vol. 1). CONCYTEC. https://hdl.handle.net/20.500.12390/3789.
Cano, A. F. S., Dávalos, J. J., Bonilla, C. F. L., Espinoza, E. R., & Oblitas, Y. F. A. (2022). Caracterización intragenotípica de siete accesiones de tarwi (Lupinus mutabilis S.) usando marcadores moleculares ISSR. Hatun Yachay Wasi, 1(2), 69–82. https://doi.org/10.57107/HYW.V1I2.25.
Chalampuente, D., Tapia, C., & Sorensen, M. (2021). The Andean Lupine-‘El Chocho’ or ‘Tarwi’ (Lupinus mutabilis S.). Biodiversity Online Journal, 1(4). https://doi.org/10.31031/BOJ.2021.01.000520.
Chalampuente-Flores, D., Mosquera-Losada, M. R., Ron, A. M. D., Tapia Bastidas, C., & Sørensen, M. (2023). Morphological and ecogeographical diversity of the Andean lupine (Lupinus mutabilis S.) in the high Andean region of Ecuador. Agronomy, 13(8), 2064. https://doi.org/10.3390/agronomy13082064.
Clements, J. C., & Cowling, W. A. (1994). Patterns of morphological diversity in relation to geographical origins of wild Lupinus angustifolius from the Aegean region. Genetic Resources and Crop Evolution, 41(2), 109–122. https://doi.org/10.1007/BF00053055.
Delgado, H., Tapia, C., Manjarres-Hernández, E. H., Borja, E., Naranjo, E., & Martín, J. P. (2024). Phenotypic diversity of quinoa landraces cultivated in the Ecuadorian Andean region: In situ conservation and detection of promising accessions for breeding programs. Agriculture, 14(3), 336. https://doi.org/10.3390/agriculture14030336.
Enrique Quispe, E. (2022). Evaluación de las propiedades fisicoquímicas de la harina de Lupinus mutabilis S. (tarwi) desamargado [Undergraduate thesis, Universidad Nacional de Huancavelica]. https://hdl.handle.net/20.500.14597/4826.
Enriquez, L., Ortega, K., Ccopi, D., Rios, C., Urquizo, J., Patricio, S., Alejandro, L., Oliva-Cruz, M., Barboza, E., & Pizarro, S. (2025). Detecting changes in soil fertility properties using multispectral UAV images and machine learning in central Peru. AgriEngineering, 7(3), 70. https://doi.org/10.3390/agriengineering7030070.
Eticha, F., Bekele, E., Belay, G., & Börner, A. (2005). Phenotypic diversity in tetraploid wheats collected from Bale and Wello regions of Ethiopia. Plant Genetic Resources, 3(1), 35–43. https://doi.org/10.1079/pgr200457.
Everitt, B. S., Landau, S., Leese, M., & Stahl, D. (2011). Cluster Analysis (5th ed.), 1–330. https://doi.org/10.1002/9780470977811.
Food and Agriculture Organization of the United Nations (FAO). (2010). The contribution of plant genetic resources for food and agriculture to food security and sustainable agricultural development. The Second Report on the State of the World’s Plant Genetic Resources for Food and Agriculture (pp. 182–201). https://www.fao.org/4/i1500e/i1500e08.pdf
Food and Agriculture Organization of the United Nations (FAO). (2019). The state of the world’s biodiversity for food and agriculture (J. Bélanger & D. Pilling, Eds.). FAO Commission on Genetic Resources for Food and Agriculture Assessments. http://www.fao.org/3/CA3129EN/CA3129EN.pdf.
Flores, H. E., Walker, T. S., Guimarães, R. L., Bais, H. P., & Vivanco, J. M. (2003). Andean root and tuber crops: Underground rainbows. HortScience, 38(2), 161–167. https://doi.org/10.21273/HORTSCI.38.2.161.
Galloni, M., Podda, L., Vivarelli, D., & Cristofolini, G. (2007). Pollen presentation, pollen-ovule ratios, and other reproductive traits in Mediterranean Legumes (Fam. Fabaceae - Subfam. Faboideae). Plant Systematics and Evolution, 266(3), 147–164. https://doi.org/10.1007/S00606-007-0526-1.
Gresta, F., Wink, M., Prins, U., Abberton, M., Capraro, J., Scarafoni, A., & Hill, G. (2017). Lupins in European cropping systems. Legumes in Cropping Systems, 88–108. https://doi.org/10.1079/9781780644981.0088.
Guilengue, N., Alves, S., Talhinhas, P., & Neves-Martins, J. (2019). Genetic and genomic diversity in a tarwi (Lupinus mutabilis S.) germplasm collection and adaptability to Mediterranean climate conditions. Agronomy, 10(1), 21. https://doi.org/10.3390/agronomy10010021.
Gulisano, A., Alves, S., Martins, J. N., & Trindade, L. M. (2019). Genetics and breeding of Lupinus mutabilis: An emerging protein crop. Frontiers in Plant Science, 10, 1385. https://doi.org/10.3389/fpls.2019.01385.
Gulisano, A., Alves, S., Rodriguez, D., Murillo, A., van Dinter, B. J., Torres, A. F., Gordillo-Romero, M., Torres, M. de L., Neves-Martins, J., Paulo, M. J., & Trindade, L. M. (2022). Diversity and agronomic performance of Lupinus mutabilis germplasm in European and Andean environments. Frontiers in Plant Science, 13, 903661. https://doi.org/10.3389/fpls.2022.903661.
International Board for Plant Genetic Resources (IBPGR). (1981). Lupin descriptors (Vol. 1). https://hdl.handle.net/10568/73417.
Jacobsen, S.-E., & Mujica, A. (2006). El tarwi (Lupinus mutabilis S.) y sus parientes silvestres. In M. Moraes R., B. Øllgaard, L. P. Kvist, F. Borchsenius, & H. Balslev (Eds.), Botánica Económica de Los Andes Centrales, (pp. 458–482). Universidad Mayor de San Andrés.
Jollife, I. T., & Cadima, J. (2016). Principal component analysis: A review and recent developments. Philosophical Transactions of the Royal Society A: Mathematical, Physical and Engineering Sciences, 374(2065). https://doi.org/10.1098/RSTA.2015.0202.
Kassambara, A., & Mundt, F. (2020). factoextra: Extract and visualize the results of multivariate data analyses [version 1.0.7]. CRAN: Contributed Packages. https://doi.org/10.32614/CRAN.PACKAGE.FACTOEXTRA.
Lê, S., Josse, J., & Husson, F. (2008). FactoMineR: An R package for multivariate analysis. Journal of Statistical Software, 25(1), 1–18. https://doi.org/10.18637/JSS.V025.I01.
Lizarazo, C., Stoddard, F., Mäkelä, P., & Santanen, A. (2010). Genetic variability in the physiological responses of Andean lupin to drought stress. Suomen Maataloustieteellisen Seuran Tiedote, 26, 1–5. https://doi.org/10.33354/smst.76862.
Massawe, F. J., Mayes, S., Cheng, A., Chai, H. H., Cleasby, P., Symonds, R., Ho, W. K., Siise, A., Wong, Q. N., Kendabie, P., Yanusa, Y., Jamalluddin, N., Singh, A., Azman, R., & Azam-Ali, S. N. (2015). The Potential for underutilised crops to improve food security in the face of climate change. Procedia Environmental Sciences, 29, 140–141. https://doi.org/10.1016/j.proenv.2015.07.228.
Mohammadi, S. A., & Prasanna, B. M. (2003). Analysis of genetic diversity in crop plants—salient statistical tools and considerations. Crop Science, 43(4), 1235–1248. https://doi.org/10.2135/cropsci2003.1235.
Morales-Casco, L. A., & Zúniga-González, C. A. (2016). Impactos del cambio climático en la agricultura y seguridad alimentaria. Revista Iberoamericana de Bioeconomía y Cambio Climático, 2(1), 269–291. https://doi.org/10.5377/ribcc.v2i1.5700.
Mousavi-Derazmahalleh, M., Bayer, P. E., Nevado, B., Hurgobin, B., Filatov, D., Kilian, A., Kamphuis, L. G., Singh, K. B., Berger, J. D., Hane, J. K., Edwards, D., Erskine, W., & Nelson, M. N. (2018). Exploring the genetic and adaptive diversity of a pan-Mediterranean crop wild relative: narrow-leafed lupin. Theoretical and Applied Genetics, 131(4), 887–901. https://doi.org/10.1007/S00122-017-3045-7.
Mujica, Á., Chura, E., Moscoso, G., Chuquimia, D., Romero, T., Astete, A., Calandri, E., & Montoya, P. (2021). Selección de cultivares de tarwi (Lupinus mutabilis S.) por rendimiento, precocidad, contenido de aceite y proteína en Puno, Perú. Agrárias: Pesquisa e Inovação Nas Ciências Que Alimentam o Mundo VI (pp. 1–13). https://doi.org/10.37572/EDART_3004213541.
Nascimento, W. F. Do, da Silva, E. F., & Veasey, E. A. (2011). Agro-morphological characterization of upland rice accessions. Scientia Agricola, 68(6), 652–660. https://doi.org/10.1590/S0103-90162011000600008.
Ojuederie, O. B., Igwe, D. O., Ludidi, N. N., & Ikhajiagbe, B. (2023). Editorial: Neglected and underutilized crop species for sustainable food and nutritional security: prospects and hidden potential. Frontiers in Plant Science, 14, 1358220. https://doi.org/10.3389/fpls.2023.1358220.
Özkan, G., Haliloğlu, K., Türkoğlu, A., Özturk, H. I., Elkoca, E., & Poczai, P. (2022). Determining genetic diversity and population structure of common bean (Phaseolus vulgaris L.) landraces from Türkiye using SSR markers. Genes, 13(8), 1410. https://doi.org/10.3390/genes13081410.
Padulosi, S., Heywood, V., Hunter, D., & Jarvis, A. (2011). Underutilized species and climate change: current status and outlook. In S. S. Yadav, R. J. Redden, J. L. Hatfield, H. Lotze-Campen, & A. E. Hall (Eds.), Crop Adaptation to Climate Change (pp. 507–521). https://doi.org/10.1002/9780470960929.CH35.
Palacios-López, L. A. (2024). Nuevas tendencias e innovaciones para una agricultura sostenible. Horizon Nexus Journal, 2(2), 15–28. https://doi.org/10.70881/hnj/v2/n2/36.
Pasupula, K., Verma, P., Zimik, M., Kaur, C., Vasudev, S., & Khar, A. (2024). Morphological, biochemical and molecular characterization of short-day tropical Indian garlic (Allium sativum L.). Heliyon, 10(18), e37553. https://doi.org/10.1016/j.heliyon.2024.e37553.
Pearson, K. (1895). VII. Note on regression and inheritance in the case of two parents. Proceedings of the Royal Society of London, 58(347–352), 240–242. https://doi.org/10.1098/rspl.1895.0041.
Peralta I., E., Murillo I., A., Mazón, N., Villacrés, E., & Rivera M., M. (2013). Catálogo de variedades mejoradas de granos andinos: Chocho, quinua y amaranto, para la sierra de Ecuador. http://repositorio.iniap.gob.ec/handle/41000/2713.
R Core Team (2023). R: A language and environment for statistical computing. R Foundation for Statistical Computing, Vienna, Austria. url: https://www.R-project.org/.
Saxena, K. B. (2018). SyBrid - a new breeding method for food legumes. International Journal of Science and Research. http://oar.icrisat.org/id/eprint/11562.
Servicio Nacional de Meteorología e Hidrología bdel Perú (SENAMHI). (2024). SENAMHI - Estaciones. https://www.senamhi.gob.pe/main.php?dp=junin&p=estaciones.
Serhiienko, O. V., Solodovnyk, L. D., Нarbovska, T. M., & Radchenko, L. O. (2023). Assessments of structural yield indicators of cucumber genotypes using cluster analysis. Vegetable and Melon Growing, 74, 33–39. https://doi.org/10.32717/0131-0062-2023-74-33-39.
Seyedsayamdost, E. (2020). Sustainable development goals. Essential Concepts of Global Environmental Governance (pp. 251–253). https://doi.org/10.4324/9780367816681-102.
Tambussi, E. A. (2006). Fotosíntesis, fotoprotección, productividad y estrés abiótico: algunos casos de estudio [Doctoral dissertation, Universidad de Barcelona]. https://dialnet.unirioja.es/servlet/tesis?codigo=3773&info=resumen&idioma=SPA.
Tapia, M. (2015). El tarwi, lupino andino (1st ed.). Fondo Italo Peruano. https://fadvamerica.org/wp-content/uploads/2017/04/TARWI-espanol.pdf
Tohme, J., Toro, O. C., Vargas, J., & Debouck, D. G. (1995). Variability in Andean nuña common beans (Phaseolus vulgaris, Fabaceae). Economic Botany, 49(1), 78–95. https://doi.org/10.1007/BF02862280.
Vera-Vega, M., Jimenez-Davalos, J., & Zolla, G. (2022). The micronutrient content in underutilized crops: the Lupinus mutabilis S. case. Scientific Reports, 12(1). https://doi.org/10.1038/S41598-022-19202-8.
Wilkinson, L., & Friendly, M. (2009). History corner the history of the cluster heat map. American Statistician, 63(2), 179–184. https://doi.org/10.1198/TAS.2009.0033.