Characterizing genetic diversity within and between native Nordic horse breeds utilizing and comparing the EquCab3.0 and EquCab_Finn reference genomes
Nathalie Almaas Smogelia, Iryna Shutavab, Signa Kallsoy Ravnafossc, Maria Kjetsåd, Juha Kantanene, Kisun Pokharele, Therese Sellef, Sofia Mikkob, Susanne Erikssonb,*, Peer Berga
aNorwegian University of Life Sciences, Department of Animal and Aquacultural Sciences, P.O. Box 5003, NO-1432 Ås, Norway
bSwedish University of Agricultural Sciences, Department of Animal Biosciences, P.O. Box 7023, SE-75007 Uppsala, Sweden
cUniversity of Copenhagen, Department of Biology, Nørregade 10, PO Box 2177, 1017, Copenhagen K, Denmark
dNordic Genetic Resource Center (NordGen), Växhusvägen 12, 23456-Alnarp, Sweden
eNatural Resources Institute Finland, Tietotie 4, FI-31600 Jokioinen, Finland
fNorwegian Horse Association, Starumsvegen 71, 2850 Lena, Norway
* Corresponding author: Susanne Eriksson (susanne.eriksson@slu.se)
Abstract: Sustainable breeding of native breeds is essential to preserve genetic diversity and cultural heritage. Several native Nordic horse breeds are at risk of extinction and lack genetic characterization. This study aimed to analyze genetic variation and kinship within and among native Nordic horse breeds using whole-genome sequence data, and to compare results from using a Finnhorse genome assembly to that of the EquCab3.0 (Thoroughbred) reference genome. The breeds Dola Horse, North Swedish Horse and Coldblooded Trotter showed close genetic relationship for fixation index (0.03–0.08), and in principal component analysis. The other breeds showed stronger genetic differentiation, especially the Faroese Horse, with fixation index above 0.16 to all other breeds. This breed had the highest genomic inbreeding of 33% and the lowest heterozygosity of 12%. The Swedish Ardennes showed the lowest inbreeding at 14% and the highest heterozygosity of 16%. The mean identity by descent varied from 17% for Swedish Ardennes to 40% for Faroese Horses. The choice of reference genomes gave minor to moderate differences, suggesting that a closer related reference improves precision for fine mapping and understanding of the genetic landscapes of Nordic breeds. Together, the different analyses showed low genetic diversity in all breeds, and the general pattern of relatedness largely agreed with the known breed history. The results underline the importance of maintaining genetic diversity for the survival of the breeds.
Keywords: Whole genome sequence data, population genetics, genomic inbreeding, breed conservation, local breeds
Background
Preservation and understanding of genetic diversity are paramount for sustainable breeding practices, and to ensure the continued overall resilience of animals (FAO, 2022). With its climatic and geographical variations, the Nordic region has given rise to several horse breeds with unique characteristics and historical significance. These breeds often represent small, isolated populations that survived population bottlenecks, some of which share a common ancestry. Unfortunately, this has left several of the breeds endangered.
In this study, we focused on Swedish and Norwegian native horse breeds, with the addition of the Faroese Horse. While the Faroese Horse is critically endangered, breeds with endangerment of extinction include Swedish Ardennes, Dola Horse, Nordland/Lyngen Horse and Norwegian Fjord Horse. Vulnerable breeds include Coldblooded Trotter, Gotland Pony and North Swedish Horse (FAO, 2024; White et al, 2024).
The population history and current state vary between the Norwegian and Swedish native breeds. The first Swedish Ardennes (Svensk Ardenner) were imported to Sweden from the Ardennes in Belgium in 1873. The breed became very popular, especially in southern Sweden. Currently, there are 4,100 registered horses in the breed (Hästnäringens Nationella Stiftelse, 2021). In 2024, there were only 231 Swedish Ardennes mares used in breeding, which is less than 1% of the over 30,000 coverings by Swedish Ardennes stallions reported in 1945 (Carlström et al, 1946; Svenska Hästavelsförbundet, 2024).
The Dola Horse (Dølahest) was established as a breed in the mid-19th century because of a need for a horse for agriculture, forestry and transport (White et al, 2024). Today, there are approximately 3,900 Dola Horses, and 290 coverings were done in 2023 (Norsk Hestesenter, 2023). It is permitted to cover type-approved Coldblooded Trotter mares with approved Dola Horse stallions for offspring to be included in the Dola Horse studbook (Landslaget for Dølahest, 2024). Additionally, North Swedish Horse stallions can be used on Dola Horse mares with a quota if approved (Norsk Hestesenter, 2023).
North Swedish Horse (Nordsvensk Brukshäst) traces back to native horses present in prehistoric Sweden, which later had some influence from foreign breeds. This breed played a crucial role, particularly during the 19th century, for forestry and farming (Föreningen Nordsvenska Hästen, 2019; White et al, 2024). Efforts to preserve this horse type began at the end of the 19th century, and Norwegian stallions were introduced to strengthen the genetic pool. The breed association was formed in 1924. In 2020, the breed had about 5,100 horses (Hästnäringens Nationella Stiftelse, 2021), and 368 coverings were reported in Sweden 2024 (Svenska Hästavelsförbundet, 2024).
Norwegian Coldblooded Trotter is a breed that shares common origins with Norwegian Dola Horse but is specialized in trotting. In Sweden, a similar selection of North Swedish Horses used for harness racing led to the establishment of Swedish Coldblooded Trotters in 1964. Today, Norwegian and Swedish Coldblooded Trotters (Kallblodstravare) have a joint breeding programme (Det Norske Travselskap and Svensk Travsport, 2019). In 2023, there were 12,700 Norwegian Coldblooded Trotters, of which 5,800 were breeding animals, with a total of 555 coverings (Norsk Hestesenter, 2023). The same year, there were about 10,000 Swedish Coldblooded Trotters (Berglund et al, 2024), and 510 Swedish mares were covered (Svensk Travsport, 2024).
Gotland Pony (Gotlandsruss) is an old Swedish breed from the island of Gotland. In the 19th century, legal changes and land reforms led to a sharp decline in the Gotland pony population. Efforts for preservation began in the 1880s, and in the mid-20th century, a few stallions from foreign breeds were introduced to combat inbreeding (Andersson, 2016). In 2020, there were 5,700 Gotland Ponies (Hästnäringens Nationella Stiftelse, 2021), and 389 mares were covered in 2024 (Svenska Hästavelsförbundet, 2024).
Throughout the 20th century, the Norwegian Fjord Horse (Norsk Fjordhest) was selectively bred for its dun colour (White et al, 2024), which is now a distinguishing feature of the breed. Norwegian Fjord Horses were mixed with Dola Horses. Later, action was taken to remove Dola introgression from the breed (Olsen et al, 2020). Today, the Norwegian Fjord Horse has a breeding population of 2,200 in Norway (Norsk Hestesenter, 2023), and a decreasing number of coverings (280 in 2023), but additional related populations exist abroad (Olsen et al, 2020).
Organized breeding of Nordland/Lyngen Horses (Nordlandshest/Lyngshest) started around 1930, and the breed was primarily found in the northern part of Norway (White et al, 2024). The Nordland/Lyngen Horse was recognized as a breed in 1968 (White et al, 2024). One Finnhorse stallion was used in efforts to save the breed in 1979 (White et al, 2024). Today, there are approximately 2,900 horses of this breed in Norway, with a breeding population of 1,300 individuals (Norsk Hestesenter, 2023). The coverings have steadily decreased, reaching 175 in 2023 (Norsk Hestesenter, 2023).
Faroese Horses (Føroyskt Ross) were brought to the Faroe Islands by Norse settlers in the 9th and 10th centuries, and in the 19th century, were sold to the British Isles as pit ponies. Mass exportation and diminishing demand led to their almost extinction (Kjetså et al, 2024). When efforts to save the breed started in the 1960s, one stallion and four mares founded the current population (Kettunen et al, 2022). Today, the breed is critically at risk of extinction, with about 80 individuals, all living on the Faroe Islands (Kjetså et al, 2024).
There are some previous molecular population genetics studies of native Swedish, Norwegian and Faroese Horses (Bjørnstad et al, 2000; Bjørnstad and Røed, 2001; Bjørnstad and Røed 2002; Bjørnstad et al, 2003; Petersen et al, 2013; Andersson, 2016; Fegraeus et al, 2018; Sild et al, 2019; Velie et al, 2019b; Olsen et al, 2020; Kettunen et al, 2022; Smogeli, 2023; Joensen, 2024). However, these studies typically only targeted a few breeds, and several were done over a decade ago. Previous kinship assessments within these breeds primarily relied on pedigree records or limited numbers of DNA markers. Today, whole-genome sequencing (WGS) facilitates high-resolution examination of allelic variations and population structure. To the authors' knowledge, no previous studies examined the genetic diversity within and between the native Nordic horse breeds using whole-genome sequences.
The primary objective of this study was to conduct an in-depth analysis of genetic variation and kinship within and among the Nordic horse breeds using WGS data. A secondary objective was to compare genetic variation and diversity when using different reference genomes: the EquCab3.0 reference genome (NCBI, 2018) and the Nordic EquCab_Finn (Pokharel et al, 2024). This study encompasses measures such as fixation index, principal component analysis, effective population size, runs of homozygosity, heterozygosity, identity by state, and identity by descent. The results can be utilized when developing breeding strategies to maintain sustainable populations of native Nordic horse breeds.
Materials and methods
Sample collection and selection
This study involved whole blood samples from 190 individuals of the eight breeds: Swedish Ardennes, Dola Horse, North Swedish Horse, Coldblooded Trotter, Gotland Pony, Fjord Horse, Nordland/Lyngen Horses and Faroese Horse (Table 1). For most breeds, horses were sampled at breeding shows and similar gatherings of breeding horses in the summer and early fall of 2022. Some Coldblooded Trotter samples were collected in their stables or at a veterinary clinic. Most Nordland/Lyngen Horse samples were provided by Biobank AS in Hamar, Norway. Faroese Horse samples were provided by the breed association Felagið Føroysk Ross.
As far as possible, we aimed to include horses that had contributed or could contribute as breeding animals. Furthermore, we tried to include horses representing the variation in each population by including individuals with as low pedigree-based relatedness to each other as possible, which varied depending on breed. However, with the owners’ consent, we were restricted to horses that were available for sampling. Both sexes were included for Dola Horses, North Swedish Horses, Coldblooded Trotters and Faroese Horses, whereas only stallions were available for the other breeds. A final selection of samples was based on the quality and concentration of extracted DNA.
Table 1. Overview of the samples per breed included in the study. a, 14 CBT samples were collected in Norway and 14 in Sweden, but 18 had Norwegian registration numbers. b, four NLH samples were collected in 2022; the rest were collected earlier and retrieved from the AS Biobank in Hamar, Norway.
|
Breed |
Breed abbrev. |
No. of horses |
% males |
Birth-years |
Sampling Country |
Sampling year |
|
Swedish Ardennes |
ARD |
22 |
100 |
2017–2019 |
Sweden |
2022 |
|
Dola Horse |
DOL |
30 |
30 |
2003–2021 |
Norway |
2022 |
|
North Swedish Horse |
NSH |
30 |
67 |
2000–2019 |
Sweden |
2022 |
|
Coldblooded Trotter |
CBT |
28 |
39 |
1998–2020 |
Norway/ Swedena |
2022 |
|
Gotland Pony |
GTP |
15 |
100 |
2009–2019 |
Sweden |
2022 |
|
Fjord Horse |
FJH |
25 |
100 |
2007–2019 |
Norway |
2022 |
|
Nordland/Lyngen Horse |
NLH |
30 |
100 |
1991–2021 |
Norway |
2022b |
|
Faroese Horse |
FRH |
10 |
67 |
1995–2021 |
Faroese Islands |
2022 |
DNA extraction, sequencing and data pre-processing
Genomic DNA (gDNA) was extracted from 190 whole blood samples using a QIASymphony instrument (QIAGEN, Hilden, Germany) and normalized to a concentration of 50ng/ml in low-salt Tris-EDTA buffer. Approximate DNA concentrations and OD260/280 ratios were measured using a Nanodrop instrument (Nanodrop Technologies, Wilmington, DE, USA). Further concentrations and quality control (QC) of gDNA was performed using an Agilent TapeStation (Agilent, Santa Clara, CA, USA). The SNP&SEQ Platform (National Genomics Infrastructure Sweden and Science for Life Laboratory, Uppsala, Sweden) prepared sequencing libraries by using TruSeq PCRfree DNA library preparation kit (Illumina Inc, San Diego, CA, USA). Paired-end sequencing was performed using v1.5 sequencing chemistry in two S4 flowcells on a NovaSeq 6000 sequencing instrument (Illumina Inc, San Diego, CA, USA).
The raw data was inspected with FastQC tools (Andrews, 2010) with standard options. Then, the GATK Best Practices workflow for short variant discovery in cohort analysis (Van der Auwera and O’Connor, 2020; Broad Institute, 2025) was used for data preprocessing. If no other information is given, the GATK v.4.0.8.0 default settings were used for all downstream tasks. The samples were first mapped on the Equine reference genome EquCab3.0 (NCBI, 2018) using bwa-mem (H. Li and Durbin, 2009). All reads were then assigned in a file to a single new read group with the AddOrReplaceReadGroups utility (Picard v. 2.23.4, (Broad Institute, 2020)). The duplicate reads were located and tagged with the MarkDuplicates utility (Picard v. 2.23.4, (Broad Institute, 2020)). Then, base quality score recalibration was done with GATK tools. First, the recalibration model was constructed using BaseRecalibrator. Known Single Nucleotide Polymorphisms (SNPs) listed in the horse genome were uploaded from the European Nucleotide Achive (ENA) through the European Variation Archive (EVA) (n.d.). Then, the scores were adjusted using the ApplyBQSR tools. Genome coverage was calculated using the samtools coverage command with the ‘-A -w 32’ settings (Danecek et al, 2021). The average read depth of samples was 18.6X. To obtain the haplotypes in the cohort of all 190 samples, the SNPs and indels via local re-assembly of haplotypes were first detected for every sample separately using HaplotypeCaller tools from GATK with the ‘-ERC GVCF’ setting (Poplin et al, 2018). Then, GenomicsDBImport was used to merge GVCFs from multiple samples to the GenomicsDB workspace. The joint genotyping of 190 samples was finally done using GenotypeGVCFs from GATK. The same pipeline was used for mapping and preprocessing the raw data on the EquCab_Finn genome. The average read depth of samples mapped on EquCab_Finn was 13X.
Quality control
Two rounds of QC were done using PLINK 2.0 (Chang et al, 2015; Purcell and Chang, 2017), one for all analyses and one for strict filtering needed for ROH and HET analysis. The resulting datasets are in this article called ‘Filtered data’ and ‘Strictly Filtered data’. The raw data consisted of 25,988,853 variants. The first filtering round excluded all variants with a Phred Quality score less than 40 (‘--var-min-qual 40’), giving the call an error rate of 0.01%. Further, read depth was required to be at least 8 with the option ‘--extract-if-info QD >= 8’. A minor allele count of 2 (‘--mac 2’) was imposed, reducing chances of a rarely observed allele being an error. Only autosomal variants were retained (‘--chr 1-31’), leaving the Filtered EquCab3.0 mapped data with 21,655,806 variants. Additional filters to only retain SNPs (‘--snps-only’), removing small indels from the data and removing all variants with any missing data (‘--geno 0’), left the Strictly Filtered EquCab3.0 mapped data with 12,713,867 SNPs.
The same data QC was performed for the EquCab_Finn, and the EquCab3.0 mapped data. However, EquCab_Finn data had 29,251,175 raw mapped variants, the first filtering round yielded 22,451,933 variants for Filtered data, and Strictly Filtered data had 12,103,319 SNPs.
Analysis
Fixation index (FST) values were estimated using the Hudson method (Hudson et al, 1992; Bhatia et al, 2013), which is a refinement of Wright’s FST (Wright, 1922) and corrects for potential biases introduced by rare variants. It calculates genetic differentiation between populations as a ratio of averages. Hudson's approach calculates averages of allele frequencies across populations before computing the FST. The general formula is:
where and are allele frequencies in population one and two, respectively, while n1 and n2 are sample sizes of populations one and two. Input data was the Filtered data, which was then further filtered for the SNPs considered, a maximum sample- and variant-missingness of 10% (‘--mind’, ‘--geno’), and pruned with PLINK 2.0 linkage disequilibrium pruning tool (‘--indep-pairwise’) with an r2 of 0.2 and distance of 50kb with a shift of 1kb. The analysis employed PLINK 2.0 ‘--FST’ option, Hudson method, and all samples were included with the ‘--nonfounder’ option. FST was calculated per family (breed) with the ‘--family’ option.
Admixture analysis was done to determine the ancestry of samples, using the same data as for the FST analysis, and the R-package ‘LEA’ (v.3.18.0) (Frichot and François, 2015; Gain and François, 2021). The number of clusters (K) that minimized a cross-entropy criterion was used.
Principal component analysis (PCA) was used to reduce data complexity and capture important patterns (Greenacre et al, 2022). The Filtered dataset was pruned with PLINK 2.0 and the same settings as for FST, with a maximum number of two alleles and a variant genotype missingness of maximum 10%. PLINK 2.0 was used to do PCA (‘--pca’) and included all samples with the ‘--nonfounder’ option, with variant filtering of a maximum of 10% missing data per variant (‘--geno’) and utilizing allele frequencies calculated (‘--read-freq’) for better estimations.
Strictly Filtered data was used for runs of homozygosity (ROH) estimation in PLINK 1.9 (Purcell and Chang, 2005; Chang et al, 2015) with the ‘--homozyg’ option. The minimum number of SNPs within a run was set to 50 (‘--homozyg-snp’), minimum run length was 300kbp (‘--homozyg-kb’), maximum inverse density in a run was 50bp/SNP (‘--homozyg-density’), maximum internal gap (kb) between two SNPs (‘--homozyg-gap’) was 1,000. Maximum number of heterozygotes in a scanning window was 1 (‘--homozyg-window-het’), and scanning window size was 50 (‘--homozyg-window-snp’). FROH is the measure of inbreeding based on ROH segments, calculated as:
where k is the number of ROH identified in each sample in kb, and L is the total length of all autosomes. The total size of data mapped to autosomes was 2.28 GB for EquCab3.0, and 2.18 GB for EquCab_Finn.
Heterozygosity (HET) describes the total number of heterozygote variants in the population, and was calculated in PLINK using the method by Zhdanova and Pudovkin (2008). The percent frequency of observed and expected heterozygosity was calculated as:
where HET variants were either Observed or Expected counts, and observed heterozygosity proportion was extracted using the ‘--het cols=+het’ option in PLINK 2.0.
Historical effective population size (Ne) was estimated per breed using SNeP 1.1 (Barbato et al, 2015a; Barbato et al, 2015b) with default options. SNeP implements the linkage disequilibrium (LD) approach developed by Corbin et al (2012), and calculates Ne as:
where f(r2) is the average LD between pairs of SNPs (r2) over a certain genetic distance, and c is the genetic distance between SNP pairs (in centiMorgans). This method relies on a decline in LD over increasing distances between loci, assuming faster LD decay in larger populations, and provides Ne at different time points. Default options were used for all chromosomes, minimum distance between SNPs was 50,000bp, and maximum was 4,000,000bp. SNeP imposes MAF filtering at 0.05, and maximum 100,000 SNPs analyzed per chromosome.
Identity by state (IBS) measures the proportion of identical alleles between two individuals at each SNP (Purcell et al, 2007) using the formula:
IBS is categorized into three states: IBS0 when both alleles differ between two individuals, IBS1 when one allele is identical, and IBS2 when both alleles are identical between the two individuals. PLINK calculates overall IBS between individuals based on genome-wide IBS0, IBS1 and IBS2 counts. For analysis of IBS, the Filtered data was pruned with PLINK 2.0 (Chang et al, 2015; Purcell and Chang, 2017) using the LD pruning tool (‘--indep-pairwise’), with r2 of 0.2, 50kb window length with 1kb increment, maximum number of alleles of 2, and 10% maximum variant genotype missingness. PLINK 2.0 estimated IBS using identity-by-descent option (‘--genome’) and the additional ‘nudge’ option to adjust the final estimates.
Identity by descent (IBD) measures variants that are likely from a common ancestor, and for this, the same options as for IBS were used. The fraction of pairwise comparisons (FPC) is the number of comparisons with nonzero values over the total number of comparisons. With this measure all animals are compared, meaning that breeds with fewer samples are more likely to have smaller FPC, and that breeds which share genetic material may have an FPC larger than the fraction of their own population size.
Results
Fixation index
The Dola Horse and North Swedish Horse had the lowest FST (0.030) (Table 2) when mapped on EquCab3.0. Also, the Coldblooded Trotter and North Swedish Horse had a low FST of 0.051. Dola Horse and Coldblooded Trotter showed a moderate distance of 0.072, as did Swedish Ardennes and North Swedish Horse (0.078). At the upper end range of FST values, the Faroese Horse had FST values above 0.167 compared to all other breeds. Similar patterns were seen in FST values of EquCab_Finn data, with values within +/- 0.03 from those of EquCab3.0.
Table 2. Fixation index (FST) values between breeds, from EquCab3.0 above and from EquCab_Finn data below the diagonal. Abbreviations as in Table 1.
|
ARD |
DOL |
NSH |
CBT |
GTP |
FJH |
NLH |
FRH |
|
|
ARD |
0.112 |
0.078 |
0.086 |
0.109 |
0.088 |
0.105 |
0.172 |
|
|
DOL |
0.127 |
0.030 |
0.072 |
0.145 |
0.113 |
0.128 |
0.206 |
|
|
NSH |
0.090 |
0.033 |
0.051 |
0.111 |
0.080 |
0.098 |
0.171 |
|
|
CBT |
0.099 |
0.082 |
0.058 |
0.118 |
0.087 |
0.104 |
0.179 |
|
|
GTP |
0.125 |
0.164 |
0.128 |
0.134 |
0.117 |
0.134 |
0.201 |
|
|
FJH |
0.102 |
0.129 |
0.093 |
0.100 |
0.133 |
0.105 |
0.167 |
|
|
NLH |
0.122 |
0.150 |
0.115 |
0.122 |
0.153 |
0.121 |
0.190 |
|
|
FRH |
0.198 |
0.236 |
0.198 |
0.204 |
0.229 |
0.192 |
0.216 |
The lowest cross-entropy was found when including eight clusters (K) for the eight breeds, but the improvement compared with seven clusters was small (Supplemental Figure 1). The most noticeable admixture was seen between Dola Horse and North Swedish Horse, and Coldblooded Trotter and Dola Horse (Figure 1, Supplemental Tables 1 and 2). The lowest admixture was found in the Faroese Horse, the Gotland Pony, and the Nordland/Lyngen Horse. Minimal differences were seen between the EquCab3.0 and the EquCab_Finn data.
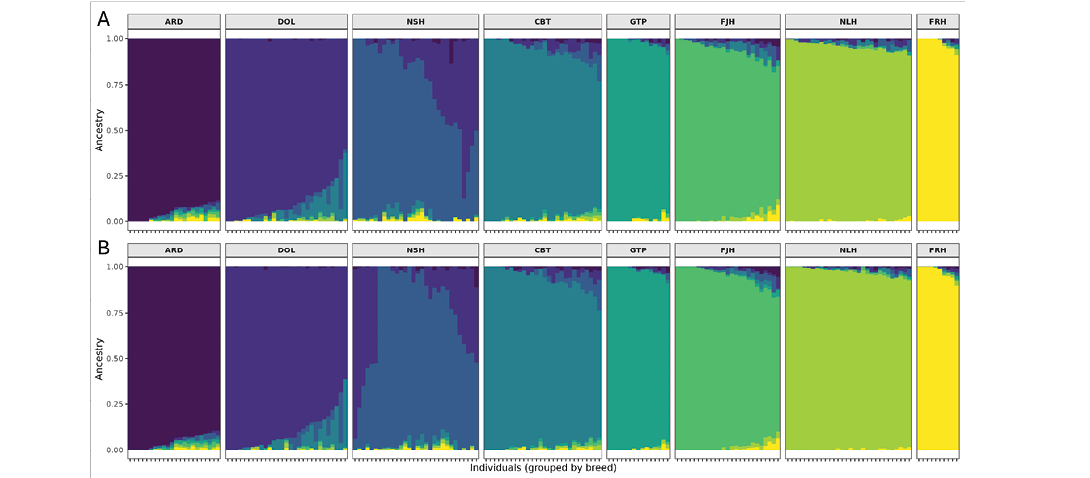
Figure 1. Admixture analysis assuming K = 8 clusters of A) EquCab3.0, and B) EquCab_Finn data. Abbreviations as in Table 1.
Principal component analysis
Together, the first three PCA components captured a substantial portion (45–47%) of genetic variation within each dataset (EquCab3.0 and EquCab_Finn). The two PCA plots (Figure 2) displayed a similar general pattern of breed similarities, but results deviated in some respects between the reference genomes. For example, Fjord Horse and Gotland Pony appeared more similar in the analysis of EquCab3.0 compared to EquCab_Finn data. The homogeneity of the first three principal components differed between breeds. The North Swedish Horse, Dola Horse and Coldblooded Trotter overlapped in both datasets, separating mainly across the first component.
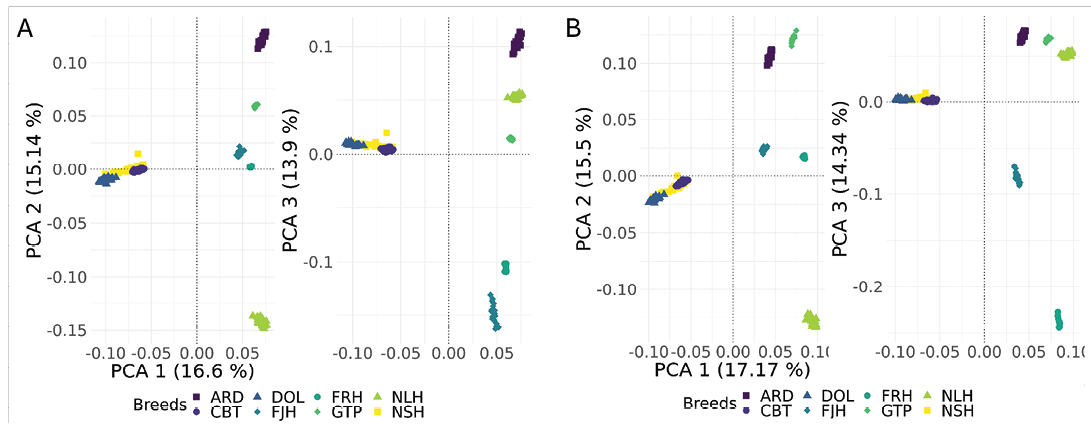
Figure 2. Principal component analysis (PCA) plot of (A) EquCab3.0, and (B) EquCab_Finn data, comparing PCA1 vs. PCA2 and PCA1 vs. PCA3. For EquCab3.0 data, PCA1 explained 16.6% variation, PCA2 15.1%, and PCA 3 13.9%. For EquCab_Finn data, PCA1 explained 17.7% variation, PCA2 15.5%, and PCA3 14.43%. Abbreviations as in Table 1.
Runs of homozygosity
Violin plots (Figure 3) illustrate the distribution of inbreeding coefficients (FROH) for the breeds in EquCab3.0 and EquCab_Finn datasets. Faroese Horses consistently exhibited the highest inbreeding levels in both plots, with compact distributions (Table 3). Faroese Horse FROH ranged from 28.7% to 38.1% in EquCab3.0 data and from 27.2% to 36.6% in EquCab_Finn data. Swedish Ardennes showed the lowest inbreeding levels with the least variation between individuals (Figure 3). FROH for this breed ranged from 10.0% to 18.2% in In EquCab3.0 data, and from 8.9% to 16.8% in EquCab_Finn data.
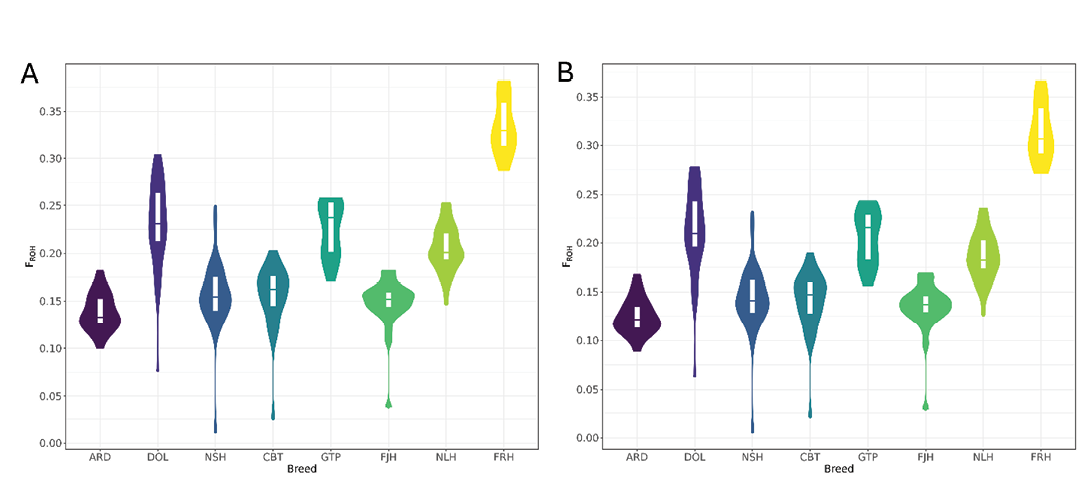
Figure 3. Distribution of inbreeding coefficients (FROH) for (A) EquCab3.0 and (B) EquCab_Finn data within breed. Abbreviations as in Table 1.
The breeds Dola Horse, Coldblooded Trotter, Fjord Horse and North Swedish Horse showed broader distributions of FROH. The Dola Horse, for instance, ranged from 7.7% to 30.4% in EquCab3.0 data and from 6.4% to 27.8% in EquCab_Finn data. The individual with the lowest FROH of about 1% was a North Swedish Horse from a Dola Horse sire approved for breeding in the North Swedish Horse breed. Nordland/Lyngen Horse and Gotland Pony displayed relatively narrow distributions.
In the EquCab3.0 data, the Dola Horse, Gotland Pony, and Faroese Horse showed larger contributions of ROHs > 4Mb to the total FROH than the other breeds. In the EquCab_Finn data, the contributions from ROH > 4Mb were considerably lower for all breeds, however (Table 3).
Table 3. Inbreeding coefficients (FROH) values for each breed in EquCab3.0 and EquCab_Finn data. Breed abbreviations as in Table 1.
a, The categories include the lower limit but exclude the upper limit.
|
|
Mean FROH (%) per length category (Mb)a |
|
Total FROH (%) |
||||||
|
Breed |
0.3–1 |
1–2 |
2–4 |
> 4 |
|
Min |
Max |
Mean |
|
|
EquCab3.0 |
ARD |
5.8 |
3.3 |
2.9 |
1.8 |
|
10.0 |
18.2 |
13.8 |
|
DOL |
5.8 |
4.7 |
6.3 |
6.2 |
|
7.7 |
30.4 |
23.0 |
|
|
NSH |
5.1 |
3.2 |
3.9 |
3.4 |
|
1.2 |
24.9 |
15.6 |
|
|
CBT |
5.2 |
3.4 |
3.6 |
3.3 |
|
2.6 |
20.3 |
15.5 |
|
|
GTP |
5.7 |
4.3 |
6.3 |
6.1 |
|
17.1 |
25.9 |
22.5 |
|
|
FJH |
5.4 |
2.9 |
3.2 |
3.2 |
|
3.8 |
18.2 |
14.7 |
|
|
NLH |
6.3 |
4.6 |
5.3 |
4.3 |
|
14.7 |
25.3 |
20.5 |
|
|
FRH |
6.7 |
5.4 |
8.3 |
13.0 |
|
28.7 |
38.1 |
33.4 |
|
|
EquCab_Finn |
ARD |
7.1 |
3.5 |
1.7 |
0.2 |
8.9 |
16.8 |
12.5 |
|
|
DOL |
9.3 |
6.5 |
4.3 |
1.0 |
6.4 |
27.8 |
21.2 |
||
|
NSH |
6.8 |
4.2 |
2.7 |
0.6 |
0.6 |
23.1 |
14.3 |
||
|
CBT |
7.0 |
4.0 |
2.5 |
0.5 |
2.1 |
19.0 |
14.0 |
||
|
GTP |
8.9 |
6.3 |
4.4 |
1.0 |
15.6 |
24.4 |
20.5 |
||
|
FJH |
6.8 |
3.8 |
2.2 |
0.5 |
2.9 |
17.0 |
13.3 |
||
|
NLH |
8.9 |
5.6 |
3.4 |
0.6 |
12.6 |
23.5 |
18.6 |
||
|
FRH |
11.5 |
9.7 |
7.4 |
2.7 |
27.2 |
36.6 |
31.4 |
||
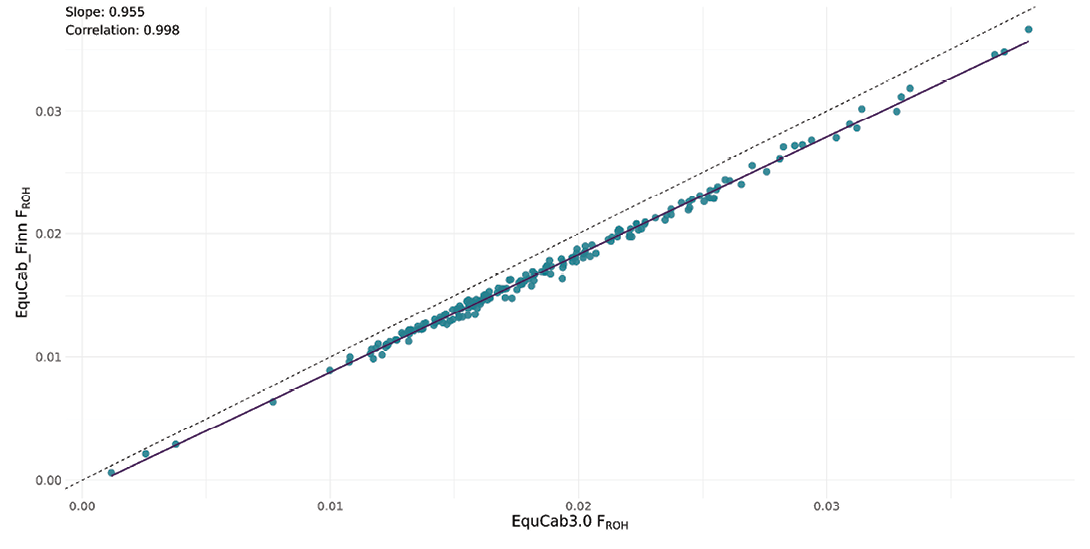
The correlation was strong (0.998), as was the regression coefficient (0.955) between individual total FROH in the EquCab_Finn data and EquCab3.0 data, however, with Faroese Horses showing highest overall inbreeding levels and Swedish Ardennes consistently the lowest (Figure 4).
Heterozygosity
In both EquCab3.0 and EquCab_Finn data, Swedish Ardennes had the highest mean observed heterozygosity (Table 4) of close to 16%, and Faroese Horse had the lowest of less than 12%. Despite this, observed heterozygosity exceeded expected heterozygosity, which was the case for all the breeds. The Dola Horse demonstrated the second lowest mean observed heterozygosity of 13.4% in both datasets, whereas the Gotland Pony, Coldblooded Trotter, Fjord Horse, Nordland/Lyngen Horse and North Swedish Horse all showed estimates between 14.6% and 15.3%.
Table 4. Expected (Exp.), and observed heterozygosity (mean, maximum and minimum) in EquCab3.0 and EquCab_Finn data.
|
EquCab3.0 |
EquCab_Finn |
|||||||
|
Breed |
Exp. (%) |
Mean (%) |
Max |
Min |
Exp. (%) |
Mean (%) |
Max (%) |
Min (%) |
|
Swedish Ardennes |
15.6 |
16.2 |
17.1 |
14.5 |
14.9 |
16.0 |
16.8 |
14.4 |
|
Dola Horse |
13.1 |
13.4 |
15.4 |
7.1 |
12.7 |
13.4 |
15.3 |
7.4 |
|
North Swedish Horse |
14.8 |
14.9 |
16.5 |
12.0 |
14.3 |
14.8 |
16.4 |
12.0 |
|
Coldblooded Trotter |
14.9 |
15.3 |
16.3 |
13.9 |
14.3 |
15.3 |
16.2 |
14.0 |
|
Gotland Pony |
14.1 |
14.6 |
16.2 |
10.9 |
13.6 |
14.6 |
16.1 |
11.1 |
|
Fjord Horse |
15.0 |
15.3 |
16.6 |
9.7 |
14.4 |
15.2 |
16.5 |
9.8 |
|
Nordland/ Lyngen Horse |
14.3 |
14.7 |
15.8 |
13.5 |
13.8 |
14.7 |
15.7 |
13.6 |
|
Faroese Horse |
10.9 |
11.7 |
13.0 |
10.1 |
10.6 |
11.8 |
13.0 |
10.3 |
Historical effective population size
Ne for the various horse breeds based on EquCab3.0 and EquCab_Finn mappings were similar, with slight differences between the two datasets. The estimated Ne generally increased further back in time (not shown). North Swedish Horse had the highest Ne of 96 in EquCab3.0 data and of 99 in EquCab_Finn when looking at the effective population size estimated over the past 13 generations (Table 5). The lowest corresponding Ne was found for Faroese Horse, at 23 and 24 for EquCab3.0 and EquCab_Finn data, respectively. EquCab_Finn data gave slightly higher estimates than EquCab3.0 data for all studied breeds.
Table 5. Effective population size estimated over the past 13 generations per breed in EquCab3.0 and EquCab_Finn data.
|
EquCab3.0 |
EquCab_Finn |
|
|
Swedish Ardennes |
85 |
87 |
|
Dola Horse |
69 |
72 |
|
North Swedish Horse |
96 |
99 |
|
Coldblooded Trotter |
74 |
76 |
|
Gotland Pony |
44 |
46 |
|
Fjord Horse |
75 |
78 |
|
Nordland/ Lyngen Horse |
67 |
70 |
|
Faroese Horse |
23 |
24 |
Identity by state
Differences in IBS values between genome assemblies were small and consistent, with EquCab_Finn data presenting from 0.3 to a few percentage points higher estimates than EquCab3.0 data (Table 6). The highest mean IBS was found in Dola Horses, at 88% in EquCab3.0 data and 89% in EquCab_Finn data. However, the highest IBS of more than 94% was found for a Faroese Horse. The lowest mean IBS was found in Gotland Pony and Swedish Ardennes at 86% in EquCab3.0 and 88% in EquCab_Finn datasets.
Table 6. Identity by state values for the EquCab3.0 and the EquCab_Finn datasets.
|
Breed |
Mean (%) |
Median (%) |
Max (%) |
Min (%) |
|
|
EquCab3.0 |
Swedish Ardennes |
85.7 |
85.6 |
90.0 |
84.7 |
|
Dola Horse |
88.1 |
87.5 |
92.1 |
85.5 |
|
|
North Swedish Horse |
87.0 |
86.9 |
93.0 |
85.2 |
|
|
Coldblooded Trotter |
87.8 |
88.0 |
92.2 |
85.2 |
|
|
Gotland Pony |
85.6 |
85.5 |
90.1 |
84.8 |
|
|
Fjord Horse |
86.1 |
85.9 |
92.4 |
85.3 |
|
|
Nordland/ Lyngen Horse |
86.5 |
86.1 |
92.5 |
85.3 |
|
|
Faroese Horse |
86.1 |
85.5 |
94.2 |
85.2 |
|
|
Swedish Ardennes |
87.5 |
87.5 |
91.3 |
86.7 |
|
|
Dola Horse |
89.8 |
89.3 |
93.2 |
87.4 |
|
|
North Swedish Horse |
88.8 |
88.7 |
94.0 |
87.2 |
|
|
Coldblooded Trotter |
89.4 |
89.6 |
93.3 |
87.1 |
|
|
Gotland Pony |
87.5 |
87.4 |
91.4 |
86.8 |
|
|
Fjord Horse |
87.9 |
87.8 |
93.5 |
87.0 |
|
|
Nordland/ Lyngen Horse |
88.3 |
88.0 |
93.5 |
87.2 |
|
|
Faroese Horse |
88.0 |
87.5 |
94.9 |
87.1 |
Identity by descent
EquCab3.0 and EquCab_Finn data heatmaps show similar overall patterns of IBD between groups of individuals belonging to different breeds (Figure 5). However, proportions of IBD showed slightly different clustering within breeds and between specific individual pairs in the EquCab3.0 data compared to EquCab_Finn data.
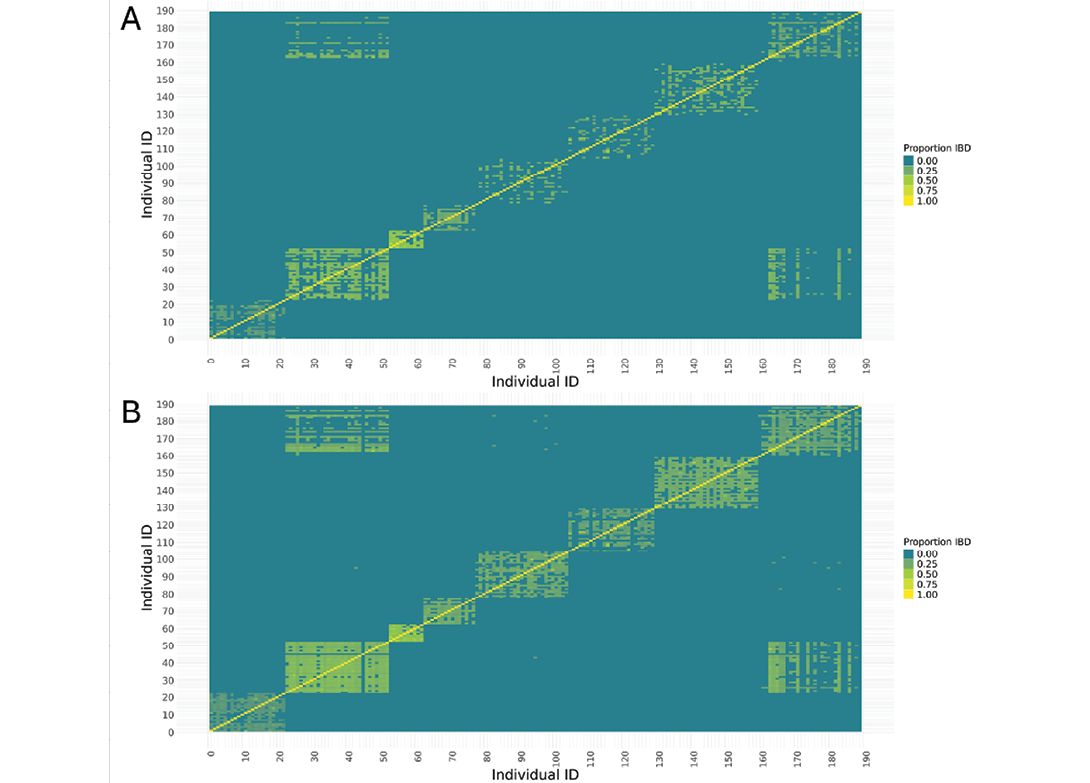
Figure 5. Heatmap of IBD relationships between individuals for (A) EquCab3.0, and (B) EquCab_Finn data, with each individual’s relationship with itself on the diagonal. Stronger yellow indicates higher IBD. Individual IDs 0-22 are Swedish Ardennes, 23-52 Dola Horses, 53-62 Faroese Horses, 63-77 Gotland Ponies, 78-104 Coldblooded Trotters, 105-129 Fjord Horses, 130-159 Nordland/Lyngen Horses, and 160-189 North Swedish Horses.
Mean IBD for Swedish Ardennes was 17% in EquCab3.0 data, and slightly lower (15%) in the EquCab_Finn data, whereas it was 32% for Dola Horse in both reference genomes (Table 7). For Faroese Horse, mean IBD remained at 40% across both genomes. The largest difference between the reference genomes in mean IBD (26% vs 21%) was seen for Fjord Horse. For all breeds, pairwise comparisons gave lower FPC in EquCab3.0 data than in EquCab_Finn data (Table 7). Differences in IBD between EquCab3.0 and EquCab_Finn were small relative to the standard deviation of IBD.
Table 7. Mean identity by descent (IBD) in percentage based on non-zero IBD pairs with standard deviations (SD) in brackets, and fraction of pairwise comparisons with nonzero IBD (FPC), in percentage.
|
EquCab3.0 |
EquCab_Finn |
|||
|
Breed |
Mean (SD) |
FPC |
Mean (SD) |
FPC |
|
Swedish Ardennes |
17 (3.5) |
2 |
15 (3.3) |
4 |
|
Dola Horse |
32 (2.2) |
19 |
32 (2.6) |
31 |
|
North Swedish Horse |
26 (4.4) |
7 |
25 (4.5) |
15 |
|
Coldblooded Trotter |
27 (3.9) |
11 |
24 (3.4) |
40 |
|
Gotland Pony |
26 (2.1) |
2 |
25 (2.4) |
3 |
|
Fjord Horse |
26 (7.1) |
2 |
21 (5.9) |
5 |
|
Nordland/ Lyngen Horse |
28 (3.2) |
5 |
27 (2.6) |
11 |
|
Faroese Horse |
40 (6.4) |
7 |
40 (6.2) |
9 |
Discussion
Historical background and use of the native Nordic horse breeds differed, but they all played an important role in developing the Nordic countries. With modernization of transport, agriculture and forestry, the roles of horses changed. Facing decreased population sizes, it is urgent to support sustainable breeding strategies for the breeds, and the first step is to characterize standing genetic variation. This study is the first to analyze and compare WGS data for all native Norwegian and Swedish horse breeds. In addition, we included the critically endangered Faroese Horse. Some other Nordic breeds, mainly Icelandic Horse and Finnhorse, have previously been more studied (Kierkegaard et al, 2020). Native Nordic breeds are not closely related to Thoroughbreds (Petersen et al, 2013). Therefore, the novel comparison between using the EquCab3.0 (Thoroughbred) reference genome and the newly developed EquCab_Finn genome based on the Nordic breed Finnhorse was of special interest.
EquCab3.0 vs. EquCab_Finn
Comparison of both admixture results, FST values, and PCA analysis from the different reference genomes showed that EquCab_Finn genome in general aligned closely with EquCab3.0 in reflecting the genetic structure across the breeds, although subtle variations between datasets were seen. Slight differences in annotation and down-stream analyses of population genetics depending on reference genome were previously reported, e.g. cattle, canines and fish (Gopalakrishnan et al, 2017; Weldenegodguad et al, 2019; Lloret-Villas et al, 2021; Thorburn et al, 2023).
Correlations between FROH estimates from using the two reference genomes in our study indicated a nearly perfect linear relationship. However, the regression coefficient pointed to slightly higher FROH from EquCab3.0 than from EquCab_Finn. The Finnhorse assembly likely called alleles specific to the Nordic breeds, detecting more variation and breaking up some of the EquCab3.0 derived ROHs. This was supported by the considerably smaller contribution of long (> 4Mb) ROH to the FROH in the EquCab_Finn than in the EquCab3.0 data.
Differences between the reference genomes in observed heterozygosity were very small, whereas expected heterozygosity was somewhat lower in the EquCab_Finn data. This may be affected by the relatively small number of samples per breed, or by additionally mapped variants in EquCab_Finn having more extreme allele frequencies, which would be likely for regions specific to Nordic breeds. Similar but more intense tendencies were previously seen in canines, for reference genomes of the wolf and the dog (Gopalakrishnan et al, 2017).
The Ne estimates indicate an approximate number of effective ancestors that contributed to the breed of today. Although the values should be interpreted with care (Adepoju et al, 2024), they can give an indication of relative differences between the breeds. One should keep in mind that formal breed formation and start of more regulated breeding for most breeds did not take place until the late 19th or early 20th century, and that generation intervals are typically around ten years or more in horse breeds (Viklund et al, 2011; Olsen et al, 2020). The EquCab_Finn data showed a slightly higher estimated historical Ne in all the breeds, likely due to more heterozygous variants, as also seen in the test of heterozygosity (Table 4).
The mean IBDs were, in most cases, similar between the two assembly genomes, while the proportion of animals having non-zero IBD values with other individuals increased for several breeds when using the EquCab_Finn assembly compared to EquCab3.0.
Overall, we found minor to moderate differences when using the two reference genomes. Pokharel et al (2024) reported that EquCab_Finn shared about 95% of the genomic features of EquCab3.0. The type of analysis and comparisons between breeds in our study are likely less sensitive to this difference than, for example, detecting unique, rare genetic variants.
Diversity within Norwegian, Swedish and Faroese breeds
Swedish Ardennes counted high numbers during the first half of the 20th century (Carlström et al, 1946), before a drastic reduction when tractors replaced horses in agriculture. The breed showed the lowest FROH and IBD values among the breeds, possibly remnants of the previously large population. However, heterozygosity at 16% suggests low genetic diversity. The breed's estimated Ne of 85–87, 13 generations back, was lower than the estimate of 227 in 2002 based on rather low-depth pedigree data (Siekas, 2006).
The dispersion of Dola Horse FROH around the mean of 21–23% indicated individual differences in genetic variability. The heterozygosity of 13% reflects high genetic diversity loss, and the mean IBD of 32% indicates few common ancestors for the population. The Ne 13 generations ago of 69–72 was between previously pedigree-based estimates of 51–151 for the years 2010–2015 (Melheim, 2017), and 152 for the years 1990–1999 (Olsen et al, 2010). Melheim (2017) estimated pedigree inbreeding coefficients of 8–13% for the Dola Horse.
The North Swedish Horse had a lower FROH, dispersed around 14–16%, like for Coldblooded Trotters. The ongoing use of approved Dola Horses in breeding of the North Swedish Horse likely contributes to an increased diversity, and to the highest estimate (96–99) of Ne 13 generations ago in this study. North Swedish Horses were sampled in Sweden under the Swedish breed name, but in hindsight, at least one individual could also have been defined as a Dola Horse.
The estimated Ne 13 generations ago for the Coldblooded Trotter of 74–76 was closer to that of the Dola Horse than the North Swedish Horse. Declining Ne has been estimated based on pedigree data for the Coldblooded Trotter, with an estimate of 40–50 for the years 2012–2015 (Leroy et al, 2020). This breed, which is under intense selection for trotting performance, showed low genetic diversity in several measures, including a high IBD of 24–27% and low heterozygosity (15%). A mean pedigree-based inbreeding coefficient of 8.3% was estimated for Coldblooded Trotters born in 2021 by Berglund et al (2024). Velie et al (2019b) estimated mean FROH based on SNP data of 9.6% in Norwegian, and 8.7% in Swedish Coldblooded Trotters, born 2000–2009.
A severe genetic bottleneck in the late 19th and early 20th centuries left its mark on the Gotland Pony breed, despite different measures taken since then to improve the situation (Svenska Russavelsföreningen, 2019). Their FROH clustered around 21–23%, with little individual variation. Also, their mean observed heterozygosity of 15% and IBD value of 25–26% suggest low genetic diversity. The estimated Ne 13 generations ago was as expected low (44–46). A pedigree-based mean inbreeding coefficient of 11% and Ne of 67 was previously estimated for Gotland Ponies by Andersson (2016).
Substantial individual variation in FROH was seen for the Fjord Horse, for which there is some exchange with foreign Fjord Horse populations. Also, for this breed, the heterozygosity (15%) indicated low genetic diversity, The estimated Ne size 13 generations ago of 75–78 concurs with previous estimates of 63 on molecular data from 2015 and 71 on pedigree data (Olsen et al, 2020). The latter estimated a mean pedigree-based inbreeding of 7.7%.
Nordland/Lyngen Horses' FROH clustered around 19–21%, and their heterozygosity (15%), and IBD (27–28%) indicated low genetic variation. The Ne 13 generations ago of 67–70 was within the range of previous pedigree-based estimates of 20–75 in 1988–1991, and 121–176 in 2012–2015 (Leroy et al, 2020).
The high FROH, clustering around 31–33%, in Faroese Horse concords with the pedigree inbreeding coefficient of 27% estimated by Kettunen et al (2022) for Faroese Horses born in 2016. Faroese Horses displayed the highest IBD value (40%), lowest observed heterozygosity (12%), and smallest historical Ne among the breeds. This agrees with the breeding history, including a relatively recent extreme bottleneck and a small, isolated population (Kettunen et al, 2022).
Population subdivision has been shown to influence estimation of genetic diversity through a deficit in heterozygotes relative to Hardy-Weinberg expectations when animals are sampled from different inbred lines (Wahlund effect) (De Meeûs, 2018). In larger breeds under divergent selection for different breeding goals, for example, American Quarter Horses (Petersen et al, 2014), genomic analyses showed substructures within the breed. Population substructures due to favoured stallions and admixture with other breeds were shown for Franches-Montagnes horses (Gmel et al, 2024). In the Costa Rican Paso horse, which started as a synthetic breed and still shows subdivision, reduction of heterozygotes, likely due to the Wahlund effect, was reported in a study by Domínguez-Viveros et al (2024). However, we found no indications of clear substructures in the numerically small native breeds in the present study based on expected vs. observed heterozygosity, PCA, IBD, or admixture analysis. This agrees with their known breed origins and present breeding programmes. Notably, even though all breeds in this study showed loss of genetic diversity, they exhibited somewhat higher observed than expected heterozygosity, which reflects the breed management, aiming to avoid close inbreeding.
Comparisons with results from other breeds
The number of studies of horses using WGS data is increasing, but still limited. Several studies based on SNP marker data are available, however. While FST and PCA values of other breeds and species do not convey much relevant information for comparison, the contrary is true for heterozygosity and FROH measures, although different settings may influence comparisons across studies. We did not filter for minor allele frequency or LD in the data used to detect ROHs, following recommendations by Meyermans et al (2020). Selection of individuals to be included may also influence the estimates, and horses in the present study were selected with the intent to capture as much of the present diversity as possible.
Compared with other breed estimates, the Nordic breeds in our study had low heterozygosity (12–16%), in some cases due to past bottlenecks and in other likely strong selection. For example, Y. Li et al (2022) reported observed heterozygosity of 18–32% in WGS data on Chinese Indigenous horse breeds. In analysis of SNP data, observed heterozygosity was 33% in Icelandic Horse and 34% in Exmoor Pony, two native northern European breeds (Sigurðardóttir et al, 2024) that have experienced fluctuating population sizes. Still, estimates of FROH between 8–20% for Icelandic horse and 12–27% for Exmoor Pony (Sigurðardóttir et al, 2024) means that those breeds would be placed in the lower to mid-range of results for breeds in the present study.
As a comparison, FROH was estimated to be 26% in a Thoroughbred population using WGS data (Chen et al, 2023), which was higher than for the Swedish and Norwegian breeds in our study. A large international population, but also few founder stallions, a strong male selection, and so-called line breeding characterize the Thoroughbred (McGivney et al, 2020). Corbin et al (2010) estimated the historical population size of Thoroughbreds 20 generations ago to be 100, with an increase in recent times based on SNP data. This is close to the highest estimate for the North Swedish Horse, found in the present study.
Genetic similarity between the studied breeds
The structure of the genetic similarity between horse breeds based on FST and PCA in the present study was at least partly expected, based on known breed history. Swedish Ardennes has its roots in Belgium, and FST for Swedish Ardennes showed moderate differentiation from other breeds, with slightly lower differentiation from North Swedish Horse (0.08), possibly a remnant of past crossbreeding. The admixture analysis showed individuals with ancestry from both the North Swedish and Dola breeds, and to a lesser extent from the Dola and Coldblooded trotter. This was expected based on pedigree information and that some crossbreeding is allowed, as previously described. The Dola Horse showed less differentiation based on FST from Coldblooded Trotter (0.07) and North Swedish Horse (0.03) than from the other breeds, and clustered closely with North Swedish Horse in the PCA, as expected due to both recent and historical exchange of genetic material between these breeds (Norsk Hestesenter, 2023). A slightly larger distance from the Coldblooded Trotter compared with the North Swedish Horse, despite their common origin, may be due to loss of genetic variation. This phenomenon of breeds with a low genetic variation that seems far distant from other breeds is seen, for example, in Friesian Horses (Schurink et al, 2019).
North Swedish Horse displayed moderate FST values, with lower differentiation from the working horse breeds Dola Horse (0.03), Swedish Ardennes (0.08) and Norwegian Fjord Horse (0.08), and the Coldblooded Trotter (0.05). This confirms previous FST estimated between North Swedish horse and Coldblooded Trotters at 0.04 (Fegraeus et al, 2018), and 0.07 (Velie et al, 2019a). Fegraeus et al (2018) also estimated a similar FST value (0.08) between Coldblooded Trotter and Dola Horse. Velie et al (2019a) revealed evidence of introgression of genetic variants from Standardbreds into Coldblooded Trotters, before parentage verification was introduced in the 1960s (Sweden) and 1970s (Norway) (Det Norske Travselskap and Svensk Travsport, 2019).
Gotland pony exhibited moderate FST values to other breeds, and the PCA plot showed a well-separated cluster for Gotland Ponies, signifying its genetic distinctiveness. None of the foreign breeds, such as Welsh Ponies introduced to increase the genetic diversity in Gotland Ponies (Andersson, 2016), were included in the present study and thus, it was not possible to estimate their relatedness.
Previously reported FST for Fjord Horse to Coldblooded Trotter (0.09) and to Dola Horse (0.15) (Fegraeus et al, 2018) were similar to those in our study (0.09 and 0.11, respectively). The PCA analysis for the Fjord Horse showed some dispersion in PCA3, indicating subtle genetic variation within the population. Only Norwegian Fjord Horses were included, and the results may have been somewhat altered if Fjord Horses had been sampled abroad.
The Nordland/Lyngen Horse showed moderate FST differentiation from all other breeds, similar to those by Fegraeus et al (2018) between Nordland/Lyngen Horse and Fjord Horse (0.13), Coldblooded Trotters (0.14), and Dola Horse (0.22). The high genetic differentiation of the Faroese Horse from all other breeds, with the lowest FST of 0.17 to the Fjord Horse, can be ascribed to the breed's history with a severe bottleneck and isolation, and, thus, genetic drift.
For future studies, adding breeds such as Thoroughbred, Standardbred, or Arabian horses would make the results more relatable to other breeds. It would also be of interest to include breeds from other Nordic countries, subpopulations of Swedish and Norwegian breeds abroad, and draught horses of a similar origin to the Swedish Ardennes. Studying genetic similarity between the Nordic, and the British and Baltic breeds would be of interest as there are historical connections with these regions. In addition, analysis of structural variations in the studied breeds may reveal additional aspects of their relatedness within and across populations. Results for the two reference genomes support that an equine pan-genome, which is being developed (Stroupe et al, 2024), will be a strong advancement for comparing genetic diversity on a detailed level across breeds with different origins.
Limitations
There is a lack of golden standards regarding many of the analyses included in this study, creating some difficulties in comparing results with previous studies. Further, estimation of effective population size based on linkage disequilibrium is challenging, as the population history and structure can impact the results (Ryman et al, 2019; Adepoju et al, 2024). Recently, Manunza et al (2025) suggested a minimum of 50 individuals to determine Ne using LD-based methods. However, they studied moderate marker density array data and breeds with much larger population sizes than in our study. Despite few individuals being sampled per breed, we assume we could capture a large proportion of genetic variations because the populations are so small, and several have undergone relatively recent genetic bottlenecks. This is supported by the estimation of the necessary sample size for FST analysis, when using high marker density, presented by Nazareno et al (2017).
Conclusions
While the patterns of genetic similarity across breeds appeared consistent, the choice of reference genome (EquCab_Finn or EquCab3.0) affected the number of samples showing genetic relationships and overall IBD values. The minor to moderate differences between results from using the two reference genomes suggest that using the EquCab_Finn genome improves the precision of genomic mapping and, thus, understanding of the genetic diversity and relationships between and within Nordic horse breeds. Further, different analyses consistently showed reduced genetic diversity in all breeds studied. The current population estimates tell us their present status. However, their future also depends on the possibility of maintaining or increasing population sizes, which may be challenging for some breeds. Maintaining genetic diversity in these breeds is essential for the survival of the breeds and thereby for preserving a significant part of Nordic heritage for future generations.
Supplemental Figure 1. Cross-entropy from admixture analysis of the eight breeds across K values of 2-12 for A) EquCab3.0, and B) EquCab_Finn mapped data
Supplemental Table 1. Admixture contribution of the different breeds to each breed in the EquCab3.0 data
Supplemental Table 2. Admixture contribution of the different breeds to each breed in the EquCab_Finn data
Acknowledgements
This project was funded by the Swedish-Norwegian Foundation for Equine Research (H-21-47-653). The authors thank the breed associations and horse owners for allowing sample collection and contributing veterinarians for collecting samples. We acknowledge the AS Biobank in Hamar, Norway, and the Faroese Horse Association for providing samples, and the Animal Genetics Laboratory at the Swedish University of Agricultural Sciences, for DNA extraction. We thank the Swedish Trotting Association, Svenska Hästavelsförbundet, and the Norwegian Equine Association for providing pedigree information. The sequencing was performed by the SNP&SEQ Technology Platform in Uppsala, which is part of the National Genomics Infrastructure (NGI) Sweden and Science for Life Laboratory and also supported by the Swedish Research Council and the Knut and Alice Wallenberg Foundation. The computations and data handling were enabled by resources provided by the National Academic Infrastructure for Supercomputing in Sweden (NAISS), partially funded by the Swedish Research Council through grant agreement no. 2022-06725, and by the Orion High-Performance Computing Center (OHPCC) at the Norwegian University of Life Sciences.
Author contributions
NAS – analysis, interpretation of results, writing (original draft), visualization; IS – data pre-processing, bioinformatics methodology; SKR – sample contribution, sample selection; MK – project initiation. JK and KP – access to the EquCab_Finn reference genome. TS – sample collection; SM – project initiation, sample selection, methodology, interpretation of results; SE – project initiation, main applicant for Swedish funding, sample collection, sample selection, methodology, interpretation of results; PB – project initiation, main applicant for Norwegian funding, methodology, sample selection, supervision, interpretation of results. All authors reviewed, edited, and approved the final manuscript.
Conflict of interest statement
The authors declare no conflict of interest.
Ethics statement
The study was reviewed and approved by the Swedish regional ethics committee on animal experiments Uppsala djurförsöksetiska nämnd (ethical permit Dnr 5.8.18-05055/2019) and the Norwegian Food Safety Authority Mattilsynet (ethical permit FOTS ID 29635). Written informed consent was obtained from the owners for the participation of their animals in this study.
Availability of data
The data for this study are deposited in the European Nucleotide Archive (ENA) at EMBL-EBI under accession number PRJEB108320 (https://www.ebi.ac.uk/ena/browser/view/PRJEB108320). The code scripts for the analysis are published on the GitHub page: https://github.com/NattyandMinnie.
References
Adepoju, D., Ohlsson, J. I., Klingström, T., Rius-Vilarrasa, E., Johansson, A. M., and Johnsson, M. (2024). Population history of Swedish cattle breeds: estimates and model checking. bioRxiv, 1-28. doi: https://doi.org/10.1101/2024.10.03.616479
Andersson, L. (2016). Analysis of inbreeding in the Swedish Gotland pony using pedigree information and microsatellite markers. M.Sc. Thesis. Swedish University of Agricultural Sciences, Uppsala.
Andrews, S. (2010). FastQC: a quality control tool for high throughput sequence data. url: http://www.bioinformatics.babraham.ac.uk/projects/fastqc
Barbato, M., Orozco-terWengel, P., Tapio, M., and Bruford, M. W. (2015a). SNeP: A tool to estimate trends in recent effective population size trajectories using genome-wide SNP data. Frontiers in Genetics, 6, 109. doi: https://doi.org/10.3389/fgene.2015.00109
Barbato, M., Orozco-terWengel, P., Tapio, M., and M.W., B. (2015b). SNeP. url: https://sourceforge.net/projects/snepnetrends/
Berglund, P., Andonov, S., Strandberg, E., and Eriksson, S. (2024). Should performance at different race lengths be treated as genetically distinct traits in Coldblooded trotters? J. Anim. Breed. Genet., 141(2), 220–234 doi: https://doi.org/10.1111/jbg.12837
Bhatia, G., Patterson, N., Sankararaman, S., and Price, A. L. (2013). Estimating and interpreting FST: The impact of rare variants. GenomeResearch, 23, 1514–1521. doi: https://doi.org/10.1101/gr.154831.113
Bjørnstad, G., Gunby, E., and Røed, K. H. (2000). Genetic structure of Norwegian horse breeds. J. Anim. Breed. Genet., 117, 307-317. doi: https://doi.org/10.1046/j.1439-0388.2000.00264.x
Bjørnstad, G., Nilsen, N., and Røed, K. H. (2003). Genetic relationship between Mongolian and Norwegian horses? Animal Genetics, 34, 55-58. doi: https://doi.org/10.1046/j.1365-2052.2003.00922.x
Bjørnstad, G., and Røed, K. H. (2001). Breed demarcation and potential for breed allocation of horses assessed by microsatellite markers. Animal Genetics, 32, 59-65. doi: https://doi.org/10.1046/j.1365-2052.2001.00705.x
Bjørnstad, G., and Røed , K. H. (2002). Evaluation of factors affecting individual assignment precision using microsatellite data from horse breeds and simulated breed crosses. Animal Genetics, 33, 264–270. doi: https://doi.org/10.1046/j.1365-2052.2002.00868.x
Broad Institute. (2020). Picard Toolkit. url: https://broadinstitute.github.io/picard/
Broad Institute. (2025). Genome Analysis Toolkit (GATK). url: https://gatk.broadinstitute.org
Carlström, O., Aaby-Ericsson, A., and Wilhelmsson, F. (1946). Betänkande med förslag till åtgärder för främjande av ridhästaveln m.m. (Vol. 1946:45).(Stockholm: Kungliga boktryckeriet P.A. Nordstedt & Söner).
Chang, C. C., Chow, C. C., Tellier, L. C. A. M., Vattikuti, S., Purcell, S. M., and Lee, J. J. (2015). Second-generation PLINK: rising to the challenge of larger and richer datasets. GigaScience, 4(1), 7. doi: https://doi.org/10.1186/s13742-015-0047-8
Chen, C., Zhu, B., Tang, X., Chen, B., Liu, M., Gao, N., et al. (2023). Genome-Wide Assessment of Runs of Homozygosity by Whole-Genome Sequencing in Diverse Horse Breeds Worldwide. Genes, 14(6), 1211. doi: https://doi.org/10.3390/genes14061211
Corbin, L. J., Blott, S. C., Swinburne, J. E., Vaudin, M., Bishop, S. C., and Woolliams, J. A. (2010). Linkage disequilibrium and historical effective population size in the Thoroughbred horse. Animal Genetics, 41(s2), 8-15. doi: https://doi.org/10.1111/j.1365-2052.2010.02092.x
Corbin, L. J., Liu, A. Y. H., Bishop, S. C., and Woolliams, J. A. (2012). Estimation of historical effective population size using linkage disequilibria with marker data. J. Anim. Breed. Genet., 129, 257-270. doi: https://doi.org/10.1111/j.1439-0388.2012.01003.x
Danecek, P., Bonfield, J. K., Liddle, J., Marshall, J., Ohan, V., Pollard, M. O., et al. (2021). Twelve years of SAMtools and BCFtools. GigaScience, 10(2), 1-4. doi: https://doi.org/10.1093/gigascience/giab008
De Meeûs, T. (2018). Revisiting FIS, FST, Wahlund Effects, and Null Alleles. Journal of Heredity, 109(4), 446–456. doi: https://doi.org/10.1093/jhered/esx106
Det Norske Travselskap, and Svensk Travsport. (2019). Avelsplan för kallblods travare. url: Https://www.kallblodstravaren.se/contentassets/07906d194ac2452dad9504e90db9adfd/beslutad-svensk-norsk-avelsplan-2019-06-13.pdf
Domínguez-Viveros, J., Molina-Villalobos, J. R., Camacho-Sandoval, J., Cruz-Méndez, A., Martínez-Rocha, R., and Jahuey-Martínez, F. (2024). Structure and genetic variability of the Costa Rican Paso horse. Journal of Equine Veterinary Science, 132, 104985. doi: https://doi.org/10.1016/j.jevs.2023.104985
European Variation Archive (EVA). (n.d.). EMBL-EBI Catalog of equine genetic variation. url: https://www.ebi.ac.uk/eva/?eva-study=PRJEB47918
FAO. (2022). Status and Trends of Animal Genetic Resources - 2022. In 12th Session of the Intergovernmental Technical Working Group on Animal Genetic Resources for Food and Agriculture, Rome. https://www.fao.org/3/cc3705en/cc3705en.pdf
FAO. (2024). Domestic Animal Diversity Information System (DAD-IS). url: https://www.fao.org/dad-is/browse-by-country-and-species/en/
Fegraeus, K. J., Velie, B. D., Axelsson, J., Ang, R., Hamilton, N. A., Andersson, L., et al. (2018). A potential regulatory region near the EDN3 gene may control both harness racing performance and coat color variation in horses. Physiological Reports, 6(10), e13700. doi: https://doi.org/10.14814/phy2.13700
Föreningen Nordsvenska Hästen. (2019). Avelsprogram och reglementen för nordsvensk brukshäst. url: https://nordsvensken.org/wp-content/uploads/2019/12/AVELSPROGRAM-2019.pdf?utm_source=chatgpt.com
Frichot, E., and François, O. (2015). LEA: an R package for Landscape and Ecological Association studies. Methods in Ecology and Evolution, 6(8), 925-929. doi: https://doi.org/10.1111/2041-210X.12382
Gain, C., and François, O. (2021). LEA 3: Factor models in population genetics and ecological genomics with R. Molecular Ecology Resources, 21(8), 2738-2748. doi: https://doi.org/10.1111/1755-0998.13366
Gmel, A. I., Mikko, S., Ricard, A., Velie, B., Gerber, V., Hamilton, N. A., et al. (2024). Using high-density SNP data to unravel the origin of the Franches-Montagnes horse breed. Genetics Selection Evolution, 56(53). doi: https://doi.org/10.1186/s12711-024-00922-6
Gopalakrishnan, S., Samaniego Castruita, J. A., Sinding, M. H. S., Kuderna, L. F. K., Räikkönen, J., Petersen, B., et al. (2017). The wolf reference genome sequence (Canis lupus lupus) and its implications for Canis spp. population genomics. BMC Genomics, 18, 495. doi: https://doi.org/10.1186/s12864-017-3883-3
Greenacre, M., Groenen, P. J. F., Hastie, T., D’Enza, A. I., Markos, A., and Tuzhilina, E. (2022). Principal Component Analysis. Nature Reviews Methods Primers, 2, 100. doi: https://doi.org/10.1038/s43586-022-00184-w
Hästnäringens Nationella Stiftelse. (2021). Hästar och Uppfödare i Sverige. Nyckeltal för svensk hästuppfödning under åren 2016 - 2020 url: https://hastnaringen.se/app/uploads/2021/12/avelsrapport-2021-hastar-och-uppfodare-i-sverige.pdf
Hudson, R. R., Slatkint, M., and Maddison, W. P. (1992). Estimation of Levels of Gene Flow From DNA Sequence Data. Genetics, 132(2), 583–589. doi: https://doi.org/10.1093/genetics/132.2.583
Joensen, S. K. (2024). The Genomic Diversity and Population Structure of the Faroese Horse; The first ever whole-genome study. M.Sc. Thesis. University of Copenhagen, Copenhagen.
Kettunen, A., Joensen, S. K., and Berg, P. (2022). Optimum contribution selection (OCS) analyses prompted successful conservation actions for Faroese horse population. Genetic Resources, 3, 59-67. doi: https://doi.org/10.46265/genresj.KKXV5870
Kierkegaard, L. S., Groeneveld, L. F., Kettunen, A., and Berg, P. (2020). The status and need for characterization of Nordic animal genetic resources. Acta Agric. Scand. A Anim. Sci., 69(1-2), 2-24. doi: https://doi.org/10.1080/09064702.2020.1722216
Kjetså, M., Gerðinum, J. I., Ólavsdóttir, J., M., J., Kallsoy Joensen, S., Honkatukia, M., et al. (2024). Action Plan for the Conservation of the Faroese Horse. url: https://www.nordgen.org/media/w4sbtasg/action-plan-for-the-conservation-of-the-faroese-horse.pdf
Landslaget for Dølahest. (2024). Avlsplan dølahest. url: https://www.dolehesten.no/avlsplan/
Leroy, G., Gicquel, E., Boettcher, P., Besbes, B., Furre, S., Fernandez, J., et al. (2020). Coancestry rate’s estimate of effective population size for genetic variability monitoring. Conserv Genet Resour(12), 275-283. doi: https://doi.org/10.1007/s12686-019-01092-0
Li, H., and Durbin, R. (2009). Fast and accurate short read alignment with Burrows–Wheeler transform. Bioinformatics, 25(14), 1754-1760. doi: https://doi.org/10.1093/bioinformatics/btp324
Li, Y., Liu, Y., Wang, M., Lin, X., Li, Y., Yang, T., et al. (2022). Whole-Genome Sequence Analysis Reveals the Origin of the Chakouyi Horse. Genes, 13(12), 2411. doi: https://doi.org/10.3390/genes13122411
Lloret-Villas, A., Bhati, M., Kadri, N. K., Fries, R., and Pausch, H. (2021). Investigating the impact of reference assembly choice on genomic analyses in a cattle breed. BMC Genomics, 22, 363. doi: https://doi.org/10.1186/s12864-021-07554-w
Manunza, A., Cozzi, P., Boettcher, P., Curik, I., Looft, C., Colli, L., et al. (2025). Estimating the optimal number of samples to determine the effective population size in livestock. Frontiers in Genetics, 16, 1588986. doi: https://doi.org/10.3389/fgene.2025.1588986
McGivney, B. A., Han, H., Corduff, L. R., Katz, L. M., Tozaki, T., MacHugh, D. E., et al. (2020). Genomic inbreeding trends, influential sire lines and selection in the global Thoroughbred horse population. Scientific Reports, 10, 466. doi: https://doi.org/10.1038/s41598-019-57389-5
Melheim, M. (2017). Genetisk Variasjon og Clusteranalyse på Bakgrunn av Slektskapsdata hjå Dølahest. M.Sc. thesis. Norwegian University of Life Sciences, Aas.
Meyermans, R., Gorssen, W., Buys, N., and Janssens, S. (2020). How to study runs of homozygosity using PLINK? A guide for analyzing medium density SNP data in livestock and pet species. BMC Genomics, 21, 94. doi: https://doi.org/10.1186/s12864-020-6463-x
Nazareno, A. G., Bemmels, J. B., Dick, C. W., and Lohmann, L. G. (2017). Minimum sample sizes for population genomics: an empirical study from an Amazonian plant species. Molecular Ecology Resources, 17, 1136-1147. doi: https://doi.org/10.1111/1755-0998.12654
NCBI. (2018). Genome Assembly EquCab3.0; The Equine Reference Genome. url: https://www.ncbi.nlm.nih.gov/datasets/genome/GCF_002863925.1/
Norsk Hestesenter. (2023). Nøkkeltal om dei nasjonale hesterasane. url: https://img2.custompublish.com/getfile.php/5302809.2562.zsmbl7szjszw77/N%C3%B8kkeltallsrapport%2B2023_web.pdf?return=www.nhest.no
Olsen, H. F., Klemetsdal, G., Ruane, J., and Helfjord, T. (2010). Pedigree structure and genetic variation in the two endangered Norwegian horse breeds: Døle and Nordland/Lyngen. Acta Agric. Scand. A Anim. Sci., 60(1), 13-22. doi: https://doi.org/10.1080/09064701003639884
Olsen, H. F., Tenhunen, S., Dolvik, N. I., Våge, D. I., and Klemetsdal, G. (2020). Segment-based coancestry, additive relationship and genetic variance within and between the Norwegian and the Swedish Fjord horse populations. Acta Agric. Scand. A Anim. Sci., 69(1-2), 118-126. doi: https://doi.org/10.1080/09064702.2019.1711155
Petersen, J. L., Mickelson, J. R., Cleary, K. D., and McCue, M. E. (2014). The American Quarter Horse: Population Structure and Relationship to the Thoroughbred. Journal of Heredity, 105(2), 148–162. doi: https://doi.org/10.1093/jhered/est079
Petersen, J. L., Mickelson, J. R., Cothran, E. G., Andersson, L. S., Axelsson, J., Bailey, E., et al. (2013). Genetic Diversity in the Modern Horse Illustrated from Genome-Wide SNP Data. PLoS One, 8(1), e54997. doi: https://doi.org/10.1371/journal.pone.0054997
Pokharel, K., Weldenegodguad, M., Reilas, T., and Kantanen, J. (2024). EquCab_Finn: A new reference genome assembly for the domestic horse, Finnhorse. Animal Genetics, 33(5), 766-771. doi: https://doi.org/10.1111/age.13463
Poplin, R., Ruano-Rubio, V., DePristo, M. A., Fennell, T. J., Carneiro, M. O., Van der Auwera, G. A., et al. (2018). Scaling accurate genetic variant discovery to tens of thousands of samples. bioRxiv, 1-22. doi: https://doi.org/10.1101/201178
Purcell, S., and Chang, C. (2005). PLINK 1.9. url: www.cog-genomics.org/plink/1.9/
Purcell, S., and Chang, C. (2017). PLINK 2.0. url: www.cog-genomics.org/plink/2.0/
Purcell, S., Neale, B., Todd-Brown, K., Thomas, L., Ferreira, M. A. R., Bender, D., et al. (2007). PLINK: A tool set for whole-genome association and population-based linkage analyses. The American Journal of Human Genetics, 81(3), 559-575. doi: https://doi.org/10.1086/519795
Ryman, N., Laikre, L., and Hössjer, O. (2019). Do estimates of contemporary effective population size tell us what we want to know? Molecular Ecology, 28(8), 1904-1918. doi: https://doi.org/10.1111/mec.15027
Schurink, A., Shrestha, M., Eriksson, S., M., B., Bovenhuis, H., Back, W., et al. (2019). The Genomic Makeup of Nine Horse Populations Sampled in the Netherlands. Genes, 10(6), 480. doi: https://doi.org/10.3390/genes10060480
Siekas, A.-C. (2006). Populationsstruktur och genetisk analys av exteriöra egenskaper hos svensk ardenner. M.Sc. thesis. Swedish University of Agricultural Sciences, Uppsala.
Sigurðardóttir, H., Ablondi, M., Kristjansson, T., Lindgren, G., and Eriksson, S. (2024). Genetic diversity and signatures of selection in Icelandic horses and Exmoor ponies. BMC Genomics, 25, 772. doi: https://doi.org/10.1186/s12864-024-10682-8
Sild, E., Rooni, K., Värv, S., Røed, K., Popov, R., Kantanen, J., et al. (2019). Genetic diversity of Estonian horse breeds and their genetic affinity to northern European and some Asian breeds. Livestock Science, 220, 57-66. doi: https://doi.org/10.1016/j.livsci.2018.12.006
Smogeli, N. A. (2023). Unraveling the Genetic Mysteries of the Norwegian Fjord-horse: Identifying Harmful Haplotypes for Improved Breeding Strategies. M.Sc. Thesis. Norwegian University of Life Sciences, Aas.
Stroupe, S., Millar, T., Raudsepp, T., Andersson, L., Petersen, J., Kalbfleish, T., et al. (2024). Equine pangenome graph identifies novel structural and single nucleotide variants. In 14th International Havemeyer Foundation Horse Genome Workshop, Caen. https://www.pure.ed.ac.uk/ws/portalfiles/portal/443373075/Abstracts-book-040524.pdf
Svensk Travsport. (2024). Kallblodstravarnas betäckningssiffror för 2024. url: https://www.travsport.se/arkiv/nyheter/2024/oktober/kallblodstravarnas-betackningssiffror-for-2024/
Svenska Hästavelsförbundet. (2024). Betäckningssiffor 2024. url: https://svehast.se/wp-content/uploads/2024/11/Betackningssiffror_2024.pdf.
Svenska Russavelsföreningen. (2019). Svenska Russavelsföreningens avelsprogram samt avelsplan för avel med gotlandsruss 2020. url: https://usercontent.one/wp/www.gotlandsruss.se/wp-content/uploads/2020/02/2020-Svenska-Russavelsf%C3%B6reningens-avelsprogram-samt-avelsplan-f%C3%B6r-avel-med-gotlandsruss.pdf
Thorburn, D.-M., Sagonas, K., Binzer-Panchal, M., Chain, F. J. J., Feulner, P. G. D., Bornberg-Bauer, E., et al. (2023). Origin matters: Using a local reference genome improves measures in population genomics. Molecular Ecology Resources, 23(7), 1706–1723. doi: https://doi.org/10.1111/1755-0998.13838
Van der Auwera, G. A., and O'Connor, B. D. (2020). Genomics in the Cloud: Using Docker, GATK, and WDL in Terra (1st Edition).(Sebastopol, California: O'Reilly Media).
Velie, B. D., Lillie, M., Fegraeus, K. J., Rosengren, M. K., Solé, M., Wiklund, M., et al. (2019a). Exploring the genetics of trotting racing ability in horses using a unique Nordic horse model. BMC Genomics, 20, 104 (2019). doi: https://doi.org/10.1186/s12864-019-5484-9
Velie, B. D., Solé, M., Fegraeus, K. J., Rosengren, M. K., Røed, K. H., Ihler, C.-F., et al. (2019b). Genomic measures of inbreeding in the Norwegian-Swedish Coldblooded Trotter and their associations with known QTL for reproduction and health traits. Genetics Selection Evolution, 51, 22. doi: https://doi.org/10.1186/s12711-019-0465-7
Viklund, Å., Näsholm, A., Strandberg, E., and Philipsson, J. (2011). Genetic trends for performance of Swedish Warmblood horses. Livestock Science, 141(2-3), 113-122. doi: https://doi.org/10.1016/j.livsci.2011.05.006
Weldenegodguad, M., Popov, R., Pokharel, K., Ammosov, I., Ming, Y., Ivanova, Z., et al. (2019). Whole-Genome Sequencing of Three Native Cattle Breeds Originating From the Northernmost Cattle Farming Regions. Frontiers in Genetics, 9, 728. doi: https://doi.org/10.3389/fgene.2018.00728
White, E.-L. F., Honkatukia, M., Peippo, J., and Kjetså, M. (2024). Equines in the Nordics: History, Status and Genetics. url: https://www.norden.org/en/publication/equines-nordics-history-status-and-genetics
Wright, S. (1922). Coefficients of inbreeding and relationship. American Naturalist, 56(645), 330–338. url: http://www.jstor.org/stable/2456273
Zhdanova, O. L., and Pudovkin, A. I. (2008). Nb_HetEx: A Program to Estimate the Effective Number of Breeders. Journal of Heredity, 99(6), 694–695. doi: https://doi.org/10.1093/jhered/esn061