Evaluation of red sanders (Pterocarpus santalinus L.f.) germplasm for conservation and breeding
Kumbarahally Murthigowda Shivaprasada,*, Pendela Surath Kumara, Avula Kishorea, Dinesh Kumara, Swapnendu Pattanaika,*
aGenetics and Tree Improvement division, Indian Council of Forestry Research and Education (ICFRE)-Institute of Forest Biodiversity, Hyderabad, Telangana, India-500100
* Corresponding authors: Kumbarahally Murthigowda Shivaprasad (shivaprasadkm.ifb@gmail.com), Swapnendu Pattanaik (swapnen@yahoo.com)
Abstract: Pterocarpus santalinus L.f., an endangered species endemic to India’s Eastern Ghats, faces threats from illegal trade due to high demand and limited legal supply. Field genebanks are essential for conserving genetic diversity and supporting sustainable use. This study evaluated a 12-year-old P. santalinus germplasm collection of 500 accessions, grown ex situ, for growth and heartwood traits. The survival rate was 80%, with notable variation in tree height (5.5–11.8m), girth at breast height (GBH, 26–78cm), clear bole height (0–6.2m), and heartwood core length (0–6.6cm), indicating substantial genetic diversity. Early heartwood formation (< 12 years) occurred in 18.50% of accessions, earlier than the typical 15 years. Superior accessions included S5R1-19 (6.6cm heartwood) and S7R1-4 (5.5cm), while S1R1-13, S5R4-20, and S1R3-18 exhibited desirable deep red heartwood. Accessions from Petbasheerabad showed high survival and heartwood yield, suggesting their value as elite seed sources. GBH positively correlated with heartwood length (r = 0.443), supporting its use as a selection trait. Principal component analysis and clustering grouped accessions into three clusters: Cluster 1 showed superior timber traits (high clear bole, low percentage of forking), whereas Cluster 3 displayed less desirable traits. These findings aid in identifying elite accessions and developing conservation and breeding strategies. Integration of molecular tools such as genome-wide association studies and transcriptomics is recommended to accelerate genetic improvement.
Keywords: Red sanders, heartwood formation, germplasm evaluation, tree improvement, field genebank
Introduction
Red sanders (Pterocarpus santalinus L. f.) is a highly valuable timber species endemic to the southern part of the Eastern Ghats of India and is classified as endangered on the International Union for the Conservation of Nature (IUCN) Red List of threatened species (Ahmedullah, 2021). It is known for its characteristic timber of exquisite colour, beauty, and superlative technical qualities (Arunakumara et al, 2011). The red-coloured heartwood is the economic part of the plant, and the wood has significant demand globally, primarily sought after for its application in crafting the traditional Japanese musical instrument known as the 'Shamisen'. Additionally, wood sourced from red sanders is utilized in the fabrication of name seals, frames, carvings, furniture, and various traditional artefacts (Arunakumara et al, 2011; Pattanaik, 2024). Further, red sanders wood possesses a significant insoluble or sparingly soluble red dye, consisting of approximately 16% of the santalin pigment, a principal colouring agent utilized notably in textile dyeing and in European medicine as a colouring agent. In the United States, it holds approval as a food dye for alcoholic beverages and is similarly sanctioned for use within Europe, and classified as a spice extract rather than a conventional food colourant (Arunakumara et al, 2011; New, 1981). Additionally, Pterostilbene, a methyl ester derivative of resveratrol present in red sanders, offers a diverse array of promising pharmacological properties (Schmidlin et al, 2008; Seshadri, 1972). The exploitation of red sanders forests without commensurate restoration in the past has led to the present degraded state (Ahmed and Nayar, 1984). Overexploitation prompted the Union Government in the 1980s to recommend the inclusion of red sanders in Appendix II of the Convention on International Trade in Endangered Species of Wild Fauna and Flora (CITES). Subsequently, the species was listed in Appendix II of CITES in 1995, and export of red sanders was prohibited in 2004. Despite the complete ban on felling and trade of natural origin wood, the gap between demand and supply fuelled its illicit felling and smuggling (Ahmedullah et al, 2019). Sustained pressure on these natural resources has resulted in their widespread degradation, as evidenced by the fact that most of the standing crop is of coppice origin and that regeneration is poor or lacking at several locations of occurrence.
The Andhra Pradesh Forest Department has estimated a global annual demand of approximately 3,000 metric tonnes (MT) of red sanders wood (NBA, 2017), and reported substantial revenue from the auction of 5,489.51MT of seized wood between 2014 and 2019 (Ahmedullah et al, 2019). In response to increasing international interest, the Directorate General of Foreign Trade (Government of India) revised its export policy in 2019 to permit the export of red sanders wood derived from cultivated sources, underscoring the urgent need to expand plantation-based production systems. Despite red sanders being cultivated in various regions of Andhra Pradesh and other Indian states, the wood produced in these plantations is typically of inferior quality compared to wood from natural populations. This quality gap limits the economic returns for farmers, even as global demand for premium-grade red sanders remains high (Ahmedullah et al, 2019). The lack of genetically improved red sanders varieties forces farmers to rely on uncertified bulk seeds, resulting in considerable variability in key traits such as heartwood formation. Furthermore, red sanders typically require 15–25 years to form heartwood, delaying economic returns (NBA, 2017). To enhance productivity and profitability for farmers, it is essential to develop and supply superior planting material with improved wood traits. Evaluation of available genetic resources is a critical step in identifying elite germplasm suitable for breeding and large-scale propagation. Field genebanks play a vital role in the conservation and evaluation of such genetic resources, enabling long-term genetic improvement strategies. This study was undertaken to assess a red sanders germplasm assemblage for variation in growth and heartwood traits, with the goal of identifying superior accessions for use in future breeding and conservation programmes.
Materials and methods
Study area
The present evaluation study was carried out in the field genebank located at ICFRE-Institute of Forest Biodiversity (17.556911° N latitude, 78.446385° E longitude, and 542m above mean sea level). The original collection, consisting of 500 germplasm from eight different seed sources, was established in August 2012 for ex situ conservation of red sanders. The genebank was designed with a spacing of 5 × 4m, and the trees were maintained without pruning operations to allow natural branching patterns (Figure 1). The details of genotypic origin and sample sizes are provided in Table 1 and Figure 2.
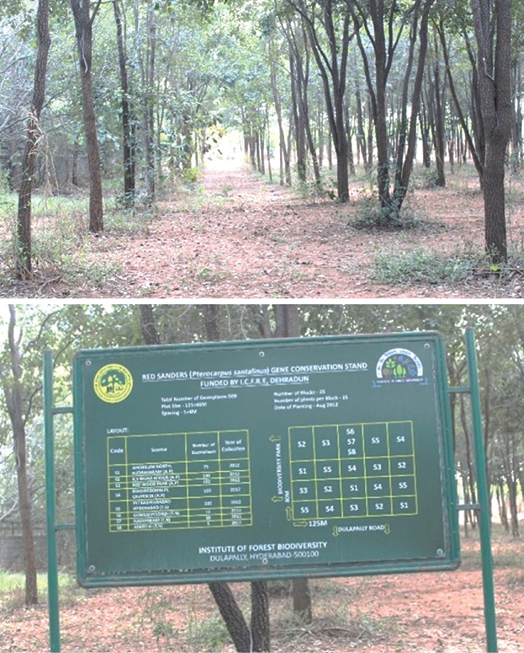
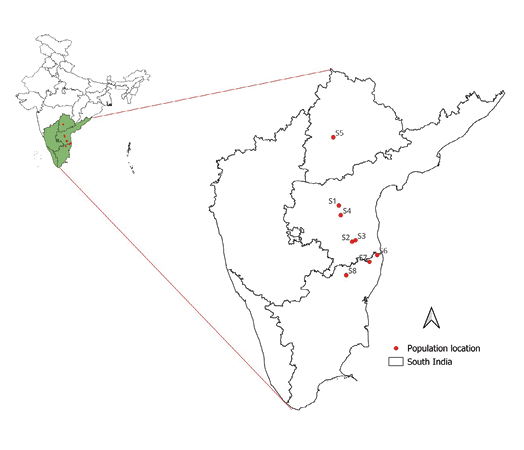
Table 1. Geographic details of seed sources and corresponding number of plants established in the red sanders field genebank at ICFRE-Institute of Forest Biodiversity, Hyderabad, India. Longitude and latitude are expressed in decimal degrees.
|
Code |
Seed source |
Latitude |
Longitude |
No. of germplasms |
No. of germplasm survived and evaluated |
|
S1 |
15.1408N |
78.7344E |
75 |
55 |
|
|
S2 |
K. V. Bhavi |
13.8917N |
79.2341E |
100 |
82 |
|
S3 |
Red Wood Park |
13.9462N |
79.3528E |
100 |
79 |
|
S4 |
Mudireddipally |
14.8062N |
78.8096E |
100 |
62 |
|
S5 |
Petbasherabad |
17.5132N |
78.4736E |
100 |
97 |
|
S6 |
Gumudipoondi |
13.4466N |
80.1306E |
10 |
10 |
|
S7 |
Nayapakkam |
13.2065N |
79.8592E |
10 |
10 |
|
S8 |
Amirthi |
12.7305N |
79.0485E |
5 |
5 |
Evaluation of growth traits and heartwood formation
Germplasm evaluation was carried out in 2024 with ten morphological traits. Trait measurements included tree height (m), measured from the base of the tree to the highest point of the crown using a measuring pole, and clear bole height (m), measured from the base of the tree to the first branching point using a measuring tape. Girth at breast height (GBH) (cm) was recorded at 1.37m above the ground using a tape, while forking was assessed visually to record its presence or absence. The number of forked stems was counted, and the average GBH in forked trees (cm) was calculated by measuring the GBH of each forked stem and computing the average for trees with multiple stems. Heartwood core length (cm) and sapwood core length (cm) were determined from wood core samples extracted using an increment borer. The distinct heartwood and sapwood regions of the core were measured with a scale and expressed in cm, while the total core sample length (cm) was recorded as the combined length of heartwood and sapwood. Heartwood colour was evaluated subjectively, and the wood samples were classified ocularly into three broad groups, viz., light red, medium red and deep red. These measurements were conducted systematically to ensure consistency and accuracy across all accessions, enabling detailed analysis of phenotypic variation.
Descriptive statistics
Descriptive statistical analysis was performed to summarize and compare the traits of 400 surviving germplasm accessions out of the 500 initially planted. Measures such as mean, minimum and maximum values were calculated using the Excel Data Analysis Toolpak for an initial overview. Frequency distributions and percentage pie charts were also plotted to illustrate key trends in survival rates and heartwood formation. Subsequently, descriptive statistics for each seed source were analyzed independently, including the calculation of mean and standard deviation (SD) for all traits. To enhance visualization and facilitate comparisons among seed sources, the R programming (R Core Team, 2018) environment was utilized. Packages such as dplyr and tidyr were employed for data preprocessing and aggregation, while ggplot2 was used to generate visual representations, including bar plots. These tools allowed for clear comparisons of trait variability and performance across seed sources.
Correlation
To explore relationships among the traits, a correlation analysis was conducted. Pearson correlation coefficients were computed for all trait combinations using R (R Core Team, 2018). The corrplot package was employed to visualize the correlation matrix, and RColorBrewer was used to enhance the colour scheme, facilitating easier interpretation of trait interdependencies. The correlation plot provided insights into the strength and direction of relationships among the traits across seed sources.
Principal component analysis and boxplot
Principal component analysis (PCA) was performed to reduce dimensionality while retaining maximum variance among tree growth traits. Numeric traits were standardized using z-score normalization, and PCA was conducted using the prcomp function in R (R Core Team, 2018). Traits with absolute loadings above 0.3 were identified as major contributors. To classify trees into distinct groups, K-means clustering was applied to PCA scores (PC1 and PC2), with the optimal number of clusters determined using the NbClust function based on the silhouette method. The resulting clusters were visualized using ggbiplot, with confidence ellipses highlighting group structures. All analyses were performed in R, utilizing packages such as ggplot2, ggbiplot, dplyr, NbClust, and RColorBrewer for statistical analysis and visualization.
Morphological diversity in red sanders accessions
Out of the 500 established germplasm lines, 400 survived and were assessed using ten morphological traits. The evaluation of the 12-year-old germplasm revealed an average tree height of 9.04m, with the tallest tree (11.8m) observed in accession S2R4-10 and the shortest (5.5m) in S4R1-7. The average clear bole height was 1.05m, with the highest (6.2m) recorded in S1R2-13. The number of forked stems ranged from 0 to 6, with 176 accessions exhibiting no forking. The accession S8R4-4 recorded the maximum of six forked stems.
Figure 3 shows the frequency distribution of forked stems among red sanders accessions, illustrating the variation in forking observed across the population. The average GBH was 45.00cm, with the highest (78.00cm) observed in S2R1-23 and the lowest (26.00cm) in S3R2-2. Increment core samples had an average length of 7.58cm, with a maximum of 12.5cm in S2R1-23 and a minimum of 4.00cm in S3R2-2. The average sapwood core length was 7.1cm, with the highest value (7.9cm) recorded in S5R2-2. Heartwood formation was observed in 74 accessions (18.50%), with an average heartwood core length of 2.53cm. The maximum heartwood core length (6.6cm) was recorded in S5R1-19, followed by S7R4-4 (5.5cm), S6R4-3 (5.2cm), S5R4-20 (5.0cm), S3R4-23 (5.0cm) and S5R4-25 (4.5cm). The lowest heartwood core length (0.5cm) was observed in S4R1-19 and S3R1-17 (Supplemental Table 1). Analysis of heartwood colour of 74 accessions revealed light red colour in 41 accessions (55.41%), a medium red colour in 19 accessions (25.68%), and a deep red colour in 14 accessions (18.92%) (Figure 4A and B). A detailed list of the 74 heartwood-forming accessions, along with their heartwood colour and heartwood core length, is provided in Table 2.
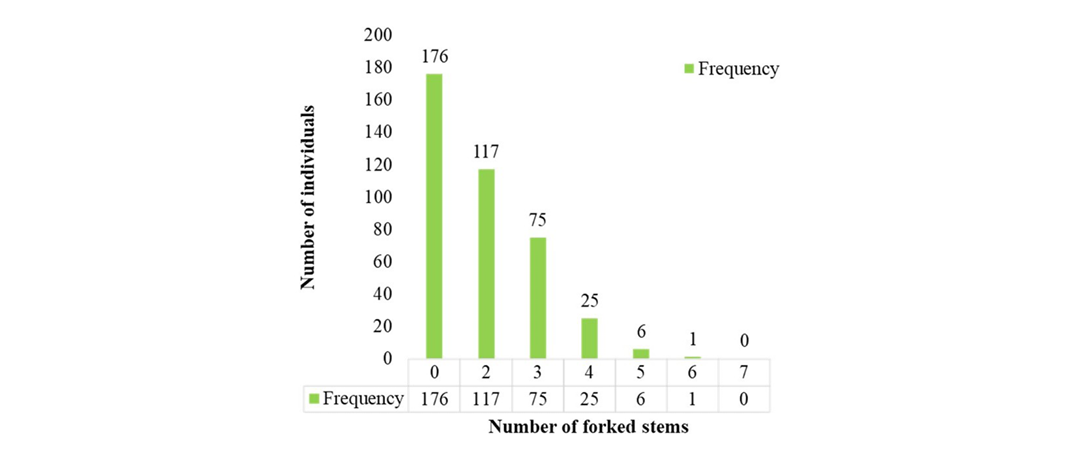
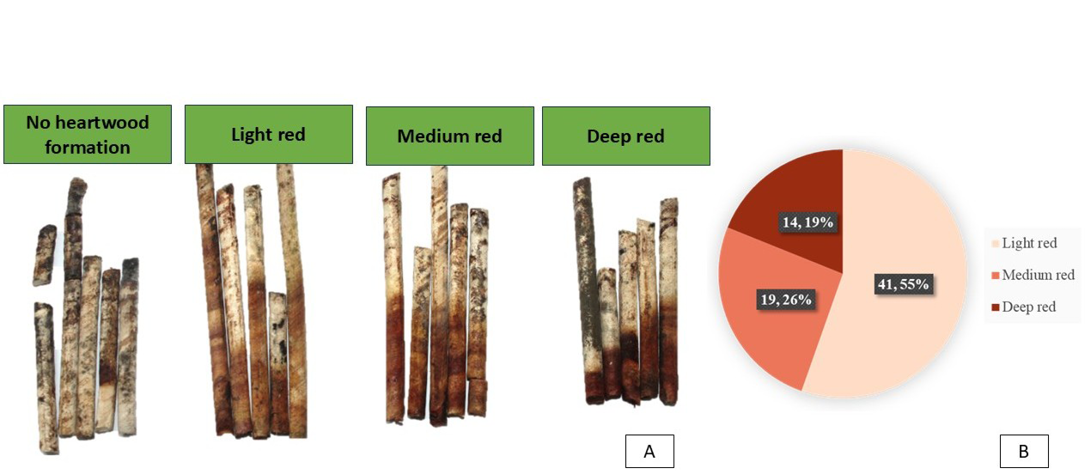
Table 2. List of the 74 heartwood-forming red sanders accessions and their heartwood colour and heartwood core length.
|
Accession |
Heartwood core length (cm) |
Heartwood colour |
Accession |
Heartwood core length (cm) |
Heartwood colour |
|
|
S5R1-19 |
6.6 |
Light red |
S5R4-18 |
2.3 |
Deep red |
|
|
S7R1-4 |
5.5 |
Medium red |
S5R4-21 |
2.3 |
Light red |
|
|
S6R1-3 |
5.2 |
Light red |
S5R3-5 |
2.2 |
Light red |
|
|
S5R4-20 |
5 |
Deep red |
S5R2-13 |
2.1 |
Light red |
|
|
S3R4-23 |
5 |
Light red |
S1R3-7 |
2.1 |
Deep red |
|
|
S5R4-25 |
4.5 |
Light red |
S5R1-9 |
2 |
Light red |
|
|
S4R3-22 |
4.3 |
Medium red |
S5R2-14 |
2 |
Light red |
|
|
S5R3-19 |
4.3 |
Light red |
S1R2-23 |
2 |
Light red |
|
|
S2R1-23 |
4 |
Medium red |
S2R2-23 |
2 |
Light red |
|
|
S5R2-4 |
4 |
Light red |
S4R4-2 |
2 |
Medium red |
|
|
S5R4-2 |
4 |
Medium red |
S4R4-17 |
2 |
Medium red |
|
|
S3R4-21 |
4 |
Medium red |
S3R4-14 |
2 |
Light red |
|
|
S5R4-4 |
3.9 |
Medium red |
S3R4-15 |
2 |
Deep red |
|
|
S5R4-15 |
3.8 |
Light red |
S1R3-24 |
1.9 |
Light red |
|
|
S3R2-20 |
3.6 |
Light red |
S5R1-21 |
1.8 |
Light red |
|
|
S3R2-22 |
3.5 |
Medium red |
S1R3-2 |
1.8 |
Deep red |
|
|
S5R3-4 |
3.4 |
Light red |
S3R1-5 |
1.7 |
Deep red |
|
|
S1R2-2 |
3.3 |
Medium red |
S2R3-22 |
1.7 |
Light red |
|
|
S5R1-2 |
3.2 |
Light red |
S5R3-20 |
1.6 |
Medium red |
|
|
S4R3-18 |
3.2 |
Medium red |
S3R2-25 |
1.5 |
Light red |
|
|
S4R3-24 |
3.1 |
Light red |
S3R4-24 |
1.5 |
Medium red |
|
|
S4R4-6 |
3 |
Medium red |
S1R1-17 |
1.4 |
Deep red |
|
|
S5R4-13 |
3 |
Medium red |
S4R3-7 |
1.4 |
Light red |
|
|
S5R4-9 |
2.9 |
Light red |
S1R3-4 |
1.4 |
Medium red |
|
|
S5R1-15 |
2.8 |
Light red |
S5R2-17 |
1.3 |
Medium red |
|
|
S5R1-23 |
2.8 |
Light red |
S5R2-12 |
1.2 |
Light red |
|
|
S5R2-5 |
2.7 |
Light red |
S3R3-6 |
1.2 |
Light red |
|
|
S3R3-4 |
2.7 |
Light red |
S1R2-21 |
1.1 |
Medium red |
|
|
S5R3-6 |
2.7 |
Light red |
S3R4-4 |
1.1 |
Light red |
|
|
S1R1-20 |
2.6 |
Light red |
S1R1-13 |
1 |
Deep red |
|
|
S3R3-14 |
2.5 |
Deep red |
S2R2-4 |
1 |
Light red |
|
|
S1R3-8 |
2.5 |
Light red |
S3R3-2 |
1 |
Light red |
|
|
S5R1-12 |
2.4 |
Light red |
S1R3-1 |
1 |
Medium red |
|
|
S3R2-23 |
2.3 |
Light red |
S1R3-14 |
1 |
Deep red |
|
|
S4R3-3 |
2.3 |
Light red |
S1R3-18 |
0.8 |
Deep red |
|
|
S5R3-25 |
2.3 |
Light red |
S3R1-17 |
0.5 |
Deep red |
|
|
S5R4-3 |
2.3 |
Deep red |
S4R1-19 |
0.5 |
Deep red |
Morphological diversity in red sanders seed sources
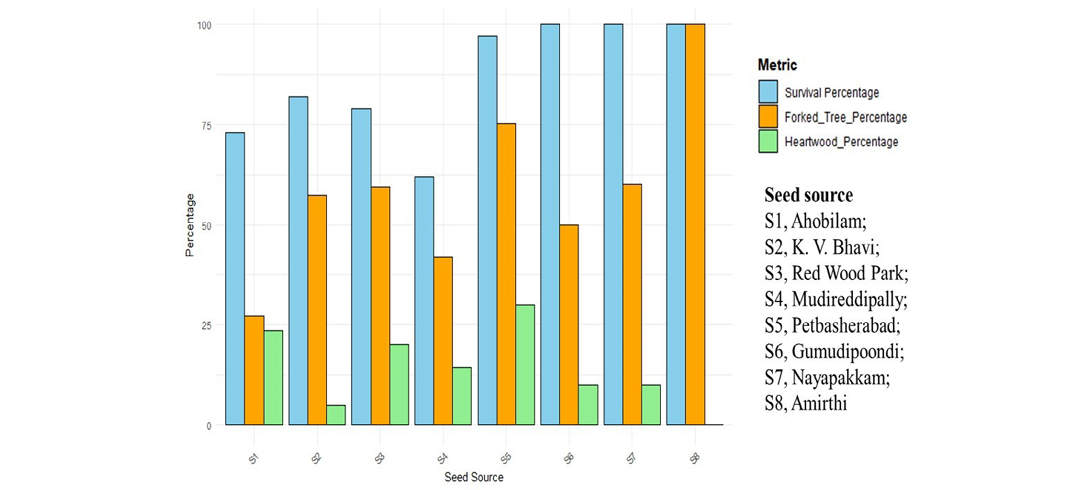
The study evaluated eight seed sources based on survival rates, heartwood formation, and various growth and heartwood formation parameters in different accessions (Table 3). Survival rates varied significantly among sources, with Gumudipoondi (S6), Nayapakam (S7) and Amirthi (S8) achieving 100% survival, whereas Madireddipally (S4) exhibited the lowest survival rate (62%). Heartwood formation also varied considerably, with Petbasheerabad (S5) recording the highest heartwood formation (29.9%), followed by Ahobilam (S1) (23.64%) and Red Wood Park (S3) (20.25%), while K.V Bhavi (S2) had the lowest heartwood formation (4.88%), and no heartwood formation was observed in Amirthi (S8) (Figure 5).
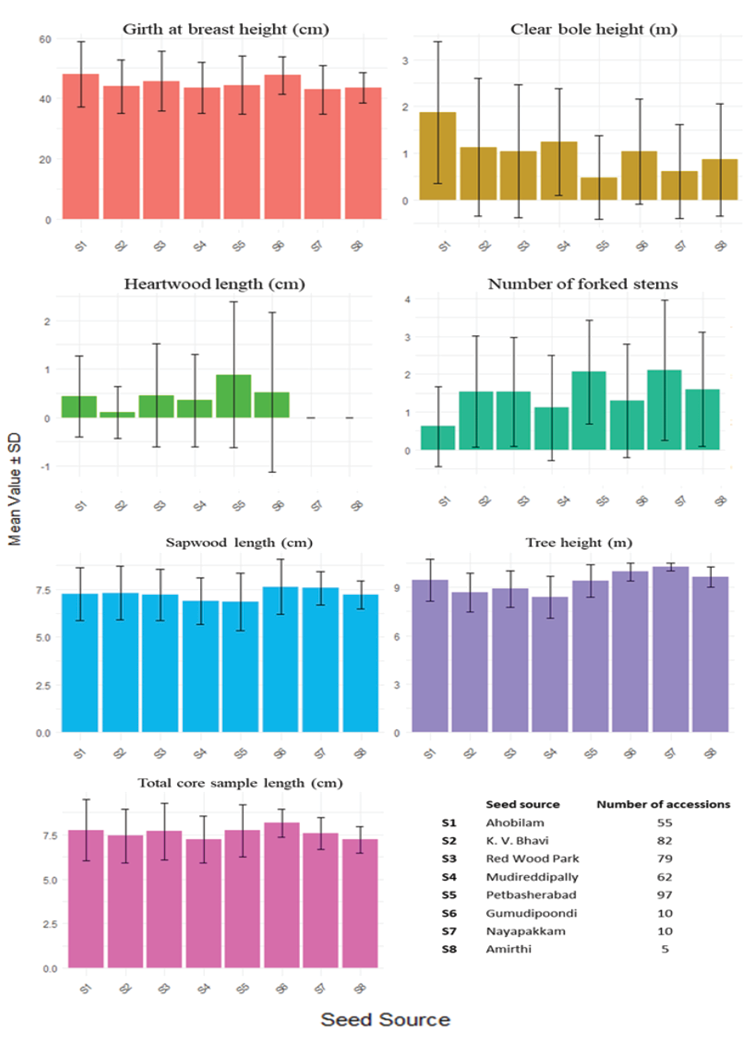
Growth traits revealed that Amirthi accessions exhibited the greatest tree height (10.24m), while Madireddipally accessions recorded the shortest (8.40m). Petbasheerabad accessions demonstrated a favourable balance between growth and heartwood quality, with a high survival rate (97%) and consistent heartwood formation, indicating its potential as a reliable seed source. Other traits, including clear bole height, heartwood core length, sapwood core length, and GBH, exhibited substantial variation across seed sources. Notably, Amirthi and Gumudipoondi accessions excelled in tree height and GBH. The observed variability highlights the importance of selecting genetically superior seed sources to enhance plantation productivity and optimize timber quality. These findings provide a scientific basis for identifying and promoting superior seed sources in breeding programmes aimed at improving plantation success and meeting commercial demands for high-quality wood products (Table 3, Figure 6).
Correlation analysis among various traits in red sanders
The correlation analysis revealed complex but statistically meaningful relationships among the recorded growth traits (Figure 7). Tree height showed a significant negative correlation with clear bole height (r = -0.314, p < 0.05) and significant positive correlations with the number of forking branches (r = 0.278, p < 0.05), average GBH (r = 0.334, p < 0.05), sapwood core length ( r = 0.316, p < 0.05), and total core sample length (r = 0.435, p < 0.01). Clear bole height exhibited a highly significant negative correlation with the number of forking stems (r = -0.796, p < 0.001) but only weak and mostly non-significant associations with other traits. The number of forking stems was negatively correlated with average GBH (r = -0.326, p < 0.05), while its correlations with heartwood core length (r = -0.077) and sapwood core length ( r = 0.026) were weak and non-significant. Average GBH showed strong and highly significant positive correlations with heartwood core length (r = 0.443, p < 0.01), sapwood core length (r = 0.630, p < 0.001), and total core sample length (r = 0.916, p < 0.001). Heartwood core length exhibited a significant negative correlation with sapwood core length (r = -0.295, p < 0.05) and a significant positive association with total core sample length (r = 0.457, p < 0.01), whereas sapwood core length was strongly and significantly correlated with total core sample length (r = 0.710, p < 0.001) (Figure 7). These results underscore the role of clear bole height as an inverse determinant of branching, with its strongest relationship being the negative correlation with the number of forking stems. Average GBH emerged as the most integrative trait, showing consistently strong and highly significant associations with both wood anatomical traits and core sample length, highlighting its utility as a key indicator for overall growth performance in tree improvement and breeding programmes.
Table 3. Descriptive statistics of morphological and heartwood formation traits in red sanders
|
Code |
Seed source |
Accessions planted |
Surviving accessions |
Accessions with heartwood formation |
Tree height (m) |
Clear bole height (m) |
No. of forked stems |
Girth at breast height (cm) |
Heartwood core length (cm) |
Sapwoodlength (cm) |
Total core sample length (cm) |
|
|
S1 |
Ahobilum North, Rudravaram (A.P) |
75.00 |
55 (73.33%) |
14 (25.45%) |
Mean |
9.43 |
1.87 |
0.62 |
48.01 |
0.43 |
7.26 |
7.76 |
|
SD |
1.30 |
1.51 |
1.06 |
10.75 |
0.83 |
1.40 |
1.70 |
|||||
|
Min |
5.70 |
0.00 |
0.00 |
27.67 |
0.00 |
4.60 |
4.60 |
|||||
|
Max |
11.70 |
6.20 |
4.00 |
73.00 |
3.30 |
10.20 |
11.60 |
|||||
|
S2 |
K.V Bhavi Kodur (A.P) |
100.00 |
82 (82%) |
4 (4.88%) |
Mean |
8.69 |
1.13 |
1.54 |
43.96 |
0.11 |
7.32 |
7.42 |
|
SD |
1.21 |
1.47 |
1.47 |
8.74 |
0.53 |
1.39 |
1.52 |
|||||
|
Min |
w |
0.00 |
0.00 |
27.00 |
0.00 |
4.20 |
4.20 |
|||||
|
Max |
11.80 |
4.80 |
5.00 |
78.00 |
4.00 |
11.50 |
12.50 |
|||||
|
S3 |
Red Wood Park (A.P) |
100.00 |
79 (79%) |
16 (20.25%) |
Mean |
8.90 |
1.04 |
1.53 |
45.74 |
0.46 |
7.22 |
7.68 |
|
SD |
1.15 |
1.42 |
1.44 |
9.80 |
1.06 |
1.34 |
1.58 |
|||||
|
Min |
6.20 |
0.00 |
0.00 |
26.00 |
0.00 |
4.00 |
4.00 |
|||||
|
Max |
11.50 |
5.00 |
5.00 |
74.00 |
5.00 |
10.50 |
11.80 |
|||||
|
S4 |
Madireddipally, Onipenta (A.P) |
100.00 |
62 (62%) |
9 (14.52%) |
Mean |
8.40 |
1.24 |
1.11 |
43.56 |
0.35 |
6.88 |
7.23 |
|
SD |
1.29 |
1.14 |
1.39 |
8.35 |
0.95 |
1.23 |
1.32 |
|||||
|
Min |
5.50 |
0.00 |
0.00 |
26.50 |
0.00 |
4.70 |
4.70 |
|||||
|
Max |
11.50 |
3.10 |
4.00 |
63.00 |
4.30 |
9.70 |
10.00 |
|||||
|
S5 |
Petbasheerabad, Hyderabad (T.S) |
100.00 |
97 (97%) |
29 (29.90%) |
Mean |
9.40 |
0.48 |
2.06 |
44.46 |
0.88 |
6.85 |
7.74 |
|
SD |
1.01 |
0.90 |
1.38 |
9.75 |
1.50 |
1.51 |
1.46 |
|||||
|
Min |
6.80 |
0.00 |
0.00 |
27.00 |
0.00 |
3.60 |
4.60 |
|||||
|
Max |
11.70 |
3.40 |
5.00 |
76.00 |
6.60 |
10.80 |
12.00 |
|||||
|
S6 |
Gumudipoondi (T.N) |
10.00 |
10 (100%) |
1 (10%) |
Mean |
9.97 |
1.04 |
1.30 |
47.73 |
0.52 |
7.63 |
8.15 |
|
SD |
0.55 |
1.12 |
1.49 |
6.17 |
1.64 |
1.45 |
0.78 |
|||||
|
Min |
8.60 |
0.00 |
0.00 |
38.75 |
0.00 |
4.00 |
7.10 |
|||||
|
Max |
10.50 |
2.40 |
4.00 |
58.00 |
5.20 |
8.90 |
9.20 |
|||||
|
S7 |
Nayapakam (T.N) |
10.00 |
10 (100%) |
1 (10%) |
Mean |
9.73 |
0.74 |
1.50 |
46.10 |
0.55 |
7.07 |
7.62 |
|
SD |
0.62 |
0.99 |
1.35 |
8.58 |
1.74 |
1.50 |
1.37 |
|||||
|
Min |
8.90 |
0.00 |
0.00 |
33.00 |
0.00 |
4.30 |
5.00 |
|||||
|
Max |
10.60 |
2.50 |
3.00 |
62.00 |
5.50 |
8.90 |
9.80 |
|||||
|
S8 |
Amirthi (T.N) |
5.00 |
5 (100%) |
- |
Mean |
10.24 |
0.00 |
3.40 |
37.93 |
0.00 |
7.14 |
7.14 |
|
SD |
0.30 |
0.00 |
1.52 |
6.91 |
0.00 |
0.97 |
0.97 |
|||||
|
Min |
9.80 |
0.00 |
2.00 |
26.00 |
0.00 |
5.70 |
5.70 |
|||||
|
Max |
10.50 |
0.00 |
6.00 |
44.00 |
0.00 |
8.40 |
8.40 |
Principal component analysis among various traits in red sanders
PCA identified seven principal components (PCs) summarizing trait variance, with PC1 and PC2 explaining 40.85% and 28.86% of the variance, respectively, capturing a cumulative 69.71% of the total variation. PC3 contributed 18.20%, while PC4 explained 8.69%, and the remaining components (PC5, PC6 and PC7) collectively accounted for less than 4% of the variance (Supplemental Table 2). These results indicate that the first three components encapsulate most of the trait variation, underscoring the importance of total core sample length, GBH, forking, heartwood core length and sapwood core length in defining diversity. To determine the most influential traits for each principal component, a loading threshold of 0.3 was applied. Traits exceeding this threshold were considered significant contributors to the observed variation. PC1 was primarily influenced by total core sample length (0.58), average GBH (0.55) and sapwood core length (0.42), indicating their role in explaining the primary axis of variation. PC2 was dominated by clear bole height (-0.63) and the number of forked stems (0.66), suggesting that this axis captures trait variation driven by contrasting growth patterns. PC3 was significantly influenced by heartwood core length (0.78) and inversely by sapwood core length (-0.60), reflecting their negative correlation (Supplemental Table 3). Clustering analysis using the silhouette method in NbClust identified three optimal clusters. K-means clustering further revealed distinct groups: Cluster 1 comprised trees with shorter tree height, higher clear bole height, and minimal forking; Cluster 2 included taller trees with moderate clear bole height, higher GBH and moderate branching; while Cluster 3 consisted of trees with significantly more forked stems and negligible clear bole height. The PCA biplot further supported these clustering results. In the biplot, the black vectors represent the original quantitative traits, where the length and direction of each vector indicate the strength and direction of each trait’s contribution to the principal components. The coloured points correspond to individual accessions grouped into the three clusters, while the elliptical circles represent the 68% confidence limits for each cluster. The distinct separation of clusters along PC1 and PC2 axes reflects trait-based differentiation among populations. These findings highlight the genetic and phenotypic diversity within the seed sources and provide insights for selecting superior accessions for tree improvement programmes (Figure 8).
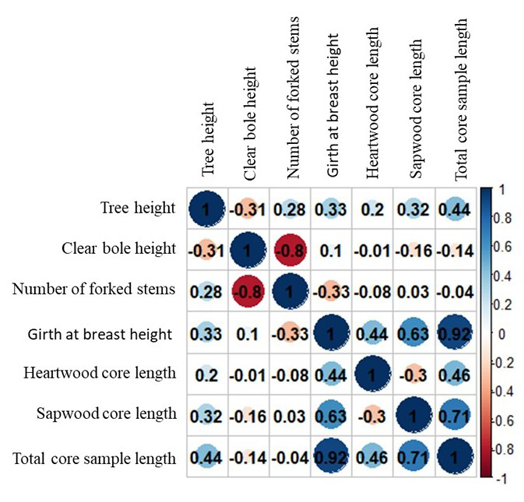
Figure 7. Correlation plot for various traits in red sanders. The circles represent the magnitude and direction of the Pearson correlation coefficients between trait pairs. The color scale shows correlation values, where blue indicates positive correlations and red indicates negative correlations. The intensity of the color and the size of the circles correspond to the strength of the correlation.
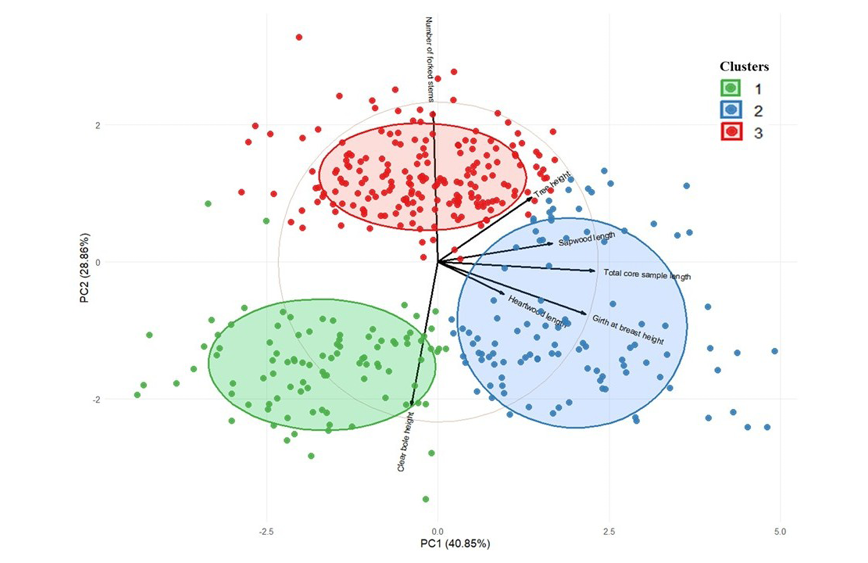
Figure 8. Principal component analysis biplot with clusters for various traits in red sanders. In the biplot, the black vectors represent the original traits, where the length and direction of each vector indicate the magnitude and direction of each trait’s contribution to the principal components. The coloured circles (ellipses) represent the 68% confidence intervals for the clusters, while the colours of the points correspond to the three identified groups of accessions. The separation of clusters along PC1 and PC2 reflects trait-based differentiation among populations.
Discussion
The morphological and heartwood formation evaluation of red sanders germplasm provides valuable insights into the genetic variability and potential of this species for breeding and conservation. The high survival rate (80%) observed in the germplasm bank demonstrates the adaptability and resilience of red sanders to environments beyond its limited natural range, which is a crucial factor for its sustainable utilization in forestry programmes.
Diversity in growth morphological traits and heartwood formation parameters
The observed variability in growth traits, such as tree height, GBH and clear bole height, reflects significant genetic diversity. The tallest accession, S2R4-10 (11.8m), and the shortest, S4R1-7 (5.5m), along with the wide range in GBH from 26.00cm to 78.00cm, demonstrate the population's growth potential. These findings align with the natural red sanders populations in the Rajampet Forest Division, where tree heights range from 7.55m to 13.11m and GBH varies from 22.30cm to 81.82cm (Senthilkumar et al, 2015). Such diversity provides a valuable resource for selecting accessions for specific silvicultural and ecological objectives.
The average tree height of 9.03m, exceeding the 8.52m average reported for 15–25-year-old red sanders plantations in Gujarat (Hegde, 2023) highlights the superior performance of certain germplasm lines. However, the lower average GBH (45.00cm) compared to the 61.21cm reported in Gujarat's plantations and 49.84cm in a 20-year-old plantation (Arun Kumar et al, 2017) may be attributed to both genetic and environmental factors. The highest clear bole height, observed in S1R2-13 (6.2m), holds particular importance for timber production, where straight, knot-free logs are preferred.
Heartwood formation was observed in 18.25% of accessions in this 12-year-old field genebank, contrasting with previous reports that heartwood formation begins at 15 years (Hegde, 2023; Suresh et al, 2017). Heartwood content increases significantly with age, as observed in studies reporting 70% heartwood formation in 20-year-old plantations and up to 97% in 45-year-old plantations (Arunkumar, 2011). The occurrence of early heartwood formation in certain accessions highlights the strong genetic influence on this trait. Accessions such as S5R1-19 (6.6cm heartwood core length) and S678R4-9 (5.5cm) show potential for breeding programmes aimed at improving heartwood production, enabling higher economic returns in shorter cultivation cycles. Heartwood colour classification revealed a predominance of light red variants (54.79%), followed by medium red (26.03%) and deep red (19.18%) colours. This variation is crucial for meeting specific market demands and enhancing the economic value of red sanders plantations.
Seed source evaluation
The significant differences in survival rates and growth traits among seed sources underscore the influence of genetic and environmental factors. Superior survival rates in seed sources such as Gumudipoondi, Nayapakam and Amirthi (100% survival) indicate their adaptability to environmental conditions. Conversely, the lower survival rates observed in Madireddipally (62%) warrant further investigation. The superior performance of accessions from Amirthi (tree height of 10.24m) and Petbasheerabad (high heartwood formation and survival rates) highlights their potential as elite seed sources for plantation programmes.
Trait correlations
The correlation analysis provided critical insights into trait relationships, guiding breeding and management strategies. The negative correlation between clear bole height and the number of forking stems (-0.796) indicates trade-offs in stem architecture, where selecting for one trait may compromise the other. The strong positive correlations between average GBH and traits such as heartwood core length (0.443), sapwood core length (0.630), and total core sample length (0.916) suggest that GBH can serve as an integrative indicator of overall tree performance. These findings align with previous studies reporting similar positive relationships between GBH and heartwood content in 20 and 45-year-old plantations (Arun Kumar et al, 2017). Given the significant influence of age on heartwood development, selecting accessions with early heartwood formation can enhance breeding efficiency. Such an approach maximizes genetic variability utilization at younger ages, increasing the likelihood of identifying superior accessions for economic gains.
Principal component analysis
The PCA results indicate that PC1 primarily represents growth-related traits, whereas PC2 reflects structural variations such as stem architecture and clear bole height. The clustering further highlights natural groupings among the trees, which could be linked to genetic and environmental factors influencing tree morphology. Cluster 3 trees, with excessive branching and forked stems, might be less desirable for commercial timber purposes but could be valuable for conservation and biodiversity. In contrast, Cluster 1 trees, which have minimal branching and a high clear bole, might be more suitable for timber production, as fewer knots improve wood quality. Cluster 2 represents an intermediate growth pattern, possibly offering a balance between commercial and ecological benefits. This analysis highlights the multifaceted nature of trait variation and provides a robust framework for prioritizing traits in breeding programmes.
Implications for breeding and conservation
The observed diversity in morphological and heartwood formation traits forms a robust foundation for breeding programmes targeting the improvement of red sanders. Superior accessions such as S2R4-10 (tree height), S1R2-13 (clear bole height) and S5R1-19 (heartwood core length) should be prioritized in future breeding efforts. Integrating morphological, genetic and environmental data will enhance the precision of selection strategies. The identified clusters provide valuable insights for breeding programmes, selection strategies and conservation planning. Trees in Cluster 1 may be prioritized for commercial plantations, while Cluster 3 trees could be conserved for genetic diversity. Future studies integrating genomic data with phenotypic clustering could further enhance the understanding of trait inheritance and selection strategies in red sanders breeding programmes. The application of molecular tools such as genome-wide association studies (GWAS) and transcriptomics can further elucidate the genetic basis of key traits, enabling marker-assisted selection for accelerated genetic improvement. From a conservation perspective, maintaining the genetic diversity observed in the evaluated germplasm is crucial to ensure the long-term sustainability and productivity of red sanders plantations.
Supplemental Table 1. Morphological and heartwood formation traits data of red sanders accessions
Supplemental Table 2. Summary of principal components showing eigenvalues and percentage of variance explained
Supplemental Table 3. Principal component loadings of morphological and heartwood formation traits showing the contribution of each trait to the respective components in red sanders accessions
Acknowledgments
The authors thank the Director, ICFRE-Institute of Forest Biodiversity, Hyderabad, for his support. Additionally, we sincerely acknowledge the technical assistance provided by Mr Sardar and Mr B. Suresh Kumar.
Author contributions
Swapnendu Pattanaik and Kumbarahally Murthigowda Shivaprasad contributed to the study conception and design. Material preparation, data collection and analysis were performed by Kumbarahally Murthigowda Shivaprasad, Pendela Surath Kumar, Avula Kishore and S. Dinesh Kumar. The first draft of the manuscript was written by Kumbarahally Murthigowda Shivaprasad and Swapnendu Pattanaik and all authors commented on previous versions of the manuscript. All authors read and approved the final manuscript.
Conflict of interest statement
The authors declare that the research was conducted in the absence of any commercial or financial relationships that could be construed as a potential competing of interest.
Ethics statement
This study did not involve any human participants or animals. The research was conducted on cultivated germplasm of Pterocarpus santalinus maintained at the ICFRE–Institute of Forest Biodiversity, Hyderabad, India. No field sampling from wild populations was carried out, and no collection of plant material from protected or endangered habitats was involved. Therefore, no specific permits or ethical committee approvals were required to conduct this research.
References
Ahmed, M., Nayar, M. (1984). Red sanders tree (Pterocarpus santalinus Linn. F.) on the verge of depletion. Nelumbo 26:142-143. doi: https://doi.org/10.20324/nelumbo/v26/1984/74871
Ahmedullah, M. (2021). Pterocarpus santalinus. The IUCN Red List of Threatened Species 2021: e.T32104A187622484. doi: https://dx.doi.org/10.2305/IUCN.UK.2021-1.RLTS.T32104A187622484.en
Ahmedullah, M., Rasingam, L., Swamy, J., Nagaraju, S., Shankara Rao, M. (2019). Non-detriment findings report on the red sanders tree (Pterocarpus santalinus Lf). Botanical Survey of India (Deccan Regional Centre), MoEFCC, Hyderabad.
Arun Kumar, A., Joshi, G., Manikandan, S. (2017). Variability for heartwood content in three commercially important tree species of Peninsular India—Hardwickia binata, Pterocarpus santalinus and Santalum album. In Wood is Good: Current Trends and Future Prospects in Wood Utilization. Springer, pp. 117-126. doi: https://doi.org/10.1007/978-981-10-3115-1_12
Arunakumara, K. K. I. U., Walpola, B. C., Subasinghe, S., Yoon, M-H. (2011). Pterocarpus santalinus Linn. f. (Rath handun): a review of its botany, uses, phytochemistry and pharmacology. Journal of the Korean Society for Applied Biological Chemistry 54:495-500. doi: https://doi.org/10.3839/jksabc.2011.076
Arunkumar, A. (2011). Variability studies in Pterocarpus santalinus in different aged plantations of Karnataka. My Forest 47:343-353.
Hegde, M. T. (2023). Non-Detriment Findings (NDF) Study For Cultivated Red Sanders (Pterocarpus santalinus L. f.) Trees in Gujarat State. ICFRE - Arid Forest Research Institute (AFRI) Jodhpur, Rajasthan, p. 31.
NBA (2017). Report of the Expert Committee on Red Sanders. A Comprehensive Policy for Conservation, Sustainable use and Fair and Equitable Sharing of Benefits Arising from Utilisation of Red Sanders under the Biological Diversity Act, 2002. National Biodiversity Authority, Chennai.
New, S. (1981). The use of stain by furniture makers 1660—1850. Furniture History 17:51-60.
Pattanaik, S. (2024). Improvement of Redsanders (Pterocarpus santalinus L. f.) through the All India Co-ordinated Research Project (AICRP). Wood is good. IWST, Bengaluru, pp. 151-154.
R Core Team (2018). R: A language and environment for statistical computing. R Foundation for Statistical Computing, Vienna, Austria. https://www.R-project.org/
Schmidlin, L., Poutaraud, A., Claudel, P., Mestre, P., Prado, E., Santos-Rosa, M., Wiedemann-Merdinoglu, S., Karst, F., Merdinoglu, D., Hugueney, P. (2008). A stress-inducible resveratrol O-methyltransferase involved in the biosynthesis of pterostilbene in grapevine. Plant Physiology 148:1630-1639. doi: https://doi.org/10.1104/pp.108.126003
Senthilkumar, N., Mayavel, A., Subramani, S., Balaji, K., Deenathayalan, P. (2015). Red sanders, Pterocarpus santalinus L. in Rajampet forest range, Rajampet forest division, Andhra Pradesh, India. Adv Appl Sci Res 6:130-134.
Seshadri, T. (1972). Polyphenols of Pterocarpus and Dalbergia woods. Phytochemistry 11(3):881–898. doi: https://doi.org/10.1016/S0031-9422(00)88430-7
Suresh, K., Hegde, M., Deenathayalan, P., Karthick Kumar, P., Thangapandi, M., Gurudev Singh, B., Krishnakumar, N. (2017). Variation in heartwood formation and wood density in plantation-grown Red Sanders (Pterocarpus santalinus). In Wood is Good: Current Trends and Future Prospects in Wood Utilization. Springer, pp. 139-151. doi: https://doi.org/10.1007/978-981-10-3115-1_14