Stylosanthes scabra: genetic variability of forage quality traits
Abstract
Stylosanthes scabra Vogel is a tropical legume grown in dry tropical and subtropical environments. The objective of this research was to evaluate the genetic diversity of forage quality traits for 80 accessions of S. scabra. Seven plants from each accession were planted in a single-line plot with no replicates at Embrapa Cerrados, Brazil. All plants were harvested 90 days after planting. Crude protein (CP), in vitro dry matter digestibility (IVDMD), neutral detergent fibre (NDF), acid detergent fibre (ADF), lignin (LIG), hemicellulose (HEMIC) and cellulose (CELLU) were estimated. Data were submitted to principal component analysis (PCA) and a cluster analysis was performed to identify groups of similarity. Simpson and Shannon–Weaver diversity indices estimated the genetic diversity. The average values of CP, IVDMD, NDF, ADF, LIG, HEMIC and CELLU were 220g/kg, 560g/kg, 516.8g/kg, 368g/kg, 69.4g/kg, 148.8g/kg and 298.6g/kg, respectively. There was a significant difference among collection sites for IVDMD, ADF and CELLU. The first two principal components accounted for 73% of the total variation. The 80 accessions resulted in four clusters, among which significant differences were observed for CP, IVDMD and ADF. Group IV, with 24 accessions, had the highest CP and IVDMD concentrations and the lowest ADF concentration, being the highest-quality forage group. Diversity indices were 0.78 and 0.81 for Simpson’s and Shannon–Weaver’s, respectively. In conclusion, there is genetic diversity for forage quality traits among S. scabra.
Keywords
Tropical legume, Genetic resources, Nutritional value, Diversity index, Germplasm characterization
Introduction
Brazil is a major beef producer and exporter, with an estimated herd of 171.8 million heads and about 158 million hectares of pastures (18.7% of Brazilian territory), of which 70% are cultivated and 30% are natural (IBGE, 2017). Most of the livestock farming in Brazil is still in extensive form, with the use of forage crops for livestock direct feeding into pasture (Hoffmann et al., 2014). Most production systems are based on the monoculture of tropical grasses of African origin. The use of high-quality forages improves the profitability of production systems; an option to obtaining pastures with a high nutritional value is the introduction of legumes associated with grasses.
Legumes play an important role in animal production due to their high protein concentration compared to grasses, in addition to soil biological nitrogen fixation (Neres et al., 2012). Several studies showed the associated use of legumes and grasses enables a significant increase in the nutritional value of ruminants’ diet (Carvalho & Pires, 2008).
When working with genetic resources it is very important to evaluate the genetic diversity of a set of germplasm, which will allow genetic improvement and the efficient use of a species’ available germplasm.
Germplasm characterization include studies of ecogeographic and demographic adaptation, plant genetics, physiology and pathology, parameters of an organism’s vital cycle and yield evaluation, among other studies. Breeding programmes should begin only after appropriate germplasm characterization (Cameron, 1983).
Characterization is the best way to understand the variability in a germplasm collection and, consequently, increase its use by plant breeders. It is also important in monitoring the genetic stability of germplasm storage processes. Characterization of germplasm can be based on molecular, biochemical, morphological, and agronomic features.
Despite the importance of forage legumes in various production systems, the adoption of tropical legume germplasm has been poor in several Latin American countries (Boddey, Casagrande, Homem, & Alves, 2020; Shelton, Franzel, & Peters, 2005). However, according to (Kretschmer, 1988), there are about 18,000 species of forage legumes and at least 1,000–2,000 species with potential for cultivation.
The genus Stylosanthes includes nitrogen-fixing and drought-tolerant species economically important for perennial pasture, green manure and land recovery (Marques et al., 2018). Its importance as a forage crop has increased in recent years due to its potential to improve the nutritional quality of mixed pastures in tropical and subtropical regions (Cameron, Chakraborty, & S, 2004; Carvalho et al., 2020; Costa, 2006; Epifanio, Costa, Severiano, Simon, & Silva, 2020; Rocha, 2014). Due to its easy adaptation to acid and low-fertility soils, it has been used in pastures to minimize nitrogen deficiency in the soil, increase protein content in the diet, as well as improve pasture carrying capacity, longevity and productivity (Resende, Valle, & Jank, 2008; Rocha, 2014).
Embrapa Cerrados has a germplasm bank (AGB) with thousands of accessions of the genus Stylosanthes, of which 80 are from Stylosanthes scabra Vogel species. Genetic resources conservation and characterization are of utmost importance to support breeding programmes for incorporating novel agronomic traits and developing new cultivars (Moreira et al., 2015; Wetzel, Silva, Salomão, Neto, & Faiad, 2012).
Genetic resources characterization has been used to quantify genetic diversity, its magnitude, nature and distribution among and within populations (Boldt, 2011; Cruz, Ferreira, & Pessoni, 2011). The evaluation of the nutritional quality diversity of S. scabra accessions can contribute to expanding the use of these genetic resources, and provides important information to high-quality forage breeding programmes (Pereira et al., 2011). Thus, the objective of this study was to access the genetic diversity of forage quality traits among 80 accessions of S. scabra from the Embrapa Cerrados active germplasm bank.
Materials and methods
Experimental setup
An experiment was carried out at the Embrapa Cerrados Research Centre, in Planaltina, Federal District, Brazil (15° 35' S, 47° 42' W; 993m a.s.l.), from December 2017 to April 2018, under irrigated conditions, to evaluate the genetic variability of accessions of S. scabra. The climate at the experimental site is tropical savannah according to the Köppen–Geiger classification (Peel, Finlayson, & Mcmahon, 2007). The experiment was planted in clay soil (Rhodic Haplustox Oxisol) with, on average: pH 5.1, organic matter concentration of 29g/kg, K concentration of 46mg/kg, Al concentration of 25mg/kg and P concentration of 2.2mg/kg (Mehlich-I) at 0–0.2m soil depth.
Seeds from all samples were treated by mechanical scraping with 100-grit sandpaper and sown in polyethene trays with 60 cells of 230cm3 filled with a commercial substrate. Fifty-day old seedlings were planted in single-line plots spaced 0.5m within and 1.0m between plots. Each plot consisted of seven plants from a specific accession.
Plant material
Eighty accessions of S. scabra collected in 9 different States from 4 distinct geographical regions in Brazil were evaluated: 26 from the States of Goiás (GO), Mato Grosso (MT), and Mato Grosso do Sul (MS) in the Central-West Region; 10 from Pará (PA) and Tocantins (TO) in the North Region; 36 from Bahia (BA) and Maranhão (MA) in the Northeast Region; and 8 from Minas Gerais (MG) and Rio de Janeiro (RJ) in the Southeast Region. Detailed information on each accession is presented in Table 1.
Data collection and analysis
All plants were harvested 90 days after transplanting to the field at 10cm stubble height. After an individual morphological plant characterization, all seven plants from each accession were pooled together, dried for 72 hours in a forced-air oven at 55°C, ground through a 1mm-screen Wiley mill (A. H. Thomas Co., Boulder, CO), stored and sealed in plastic containers, and sent to the Analytical Plant Chemistry Laboratory at Embrapa Cerrados.
The samples were then analyzed to estimate the content of neutral detergent fibre (NDF), acid detergent fibre (ADF), lignin (LIG), crude protein (CP) and in vitro dry matter digestibility (IVDMD) on dry matter (DM) basis. DM content of the samples was determined by drying approximately 2g of each sample in a forced-air oven at 105°C ± 2°C for at least 2 hours (AOAC, 1996). Sequential NDF, ADF and LIG analysis from 0.5g initial sample weight placed in ANKOM F57 filter bags (Komarek & Sirois, 1993; Komarek, Robertson, & Soest, 1994; Mertens, 2002; Soest, Robertson, & Lewis, 1991; Vogel, Pedersen, Masterson, & Toy, 1999) was performed for each accession sample. For NDF and ADF analysis, samples were digested in an Automated Fiber Analyzer model ANKOM 2000 (ANKOM Tech. Corp., Fairport, NY, USA) using a neutral detergent solution pH6.9–7.1, without α-amylase, and 1M H2SO4 acid detergent solution, sequentially after drying and weighing procedures. LIG determination was performed by placing the ADF dry residue in a 12M H2SO4 solution and incubated in a Tecnal in vitro incubator system
|
Access ID |
CPAC Number |
Brazilian City/State |
Brazilian Geographic Region |
Latitude |
Longitude |
|
1 |
512 |
Rondonópolis-MT |
CO |
16° 18' 00" S |
54° 45' 00" W |
|
2 |
961 |
Rio de Janeiro-RJ |
SE |
22° 54' 06" S |
43° 10' 27" W |
|
3 |
963 |
Camaçari-BA |
NE |
12° 40' 60" S |
38° 19' 00" W |
|
4 |
964 |
Nazaré-BA |
NE |
13° 00' 00" S |
39° 01' 60" W |
|
5 |
965 |
Feira de Santana-BA |
NE |
12° 22' 00" S |
39° 06' 00" W |
|
6 |
966 |
Cruz das Almas-BA |
NE |
12° 40' 00" S |
39° 06' 00" W |
|
7 |
967 |
Mucuri-BA |
NE |
18° 04' 60" S |
39° 34' 00" W |
|
8 |
968 |
Pé de Serra-BA |
NE |
11° 49' 57" S |
39° 36' 06" W |
|
9 |
969 |
Feira de Santana-BA |
NE |
12° 16' 00" S |
39° 01' 60" W |
|
10 |
970 |
Santo Amaro-BA |
NE |
12° 31' 88" S |
38° 49' 60" W |
|
11 |
971 |
Feira de Santana-BA |
NE |
12° 22' 00" S |
39° 06' 00" W |
|
12 |
972 |
Catu-BA |
NE |
12° 20' 60" S |
38° 23' 60" W |
|
13 |
973 |
Conceição do Almeida-BA |
NE |
12° 55' 00" S |
39° 16' 00" W |
|
14 |
974 |
Catu-BA |
NE |
12° 20' 60" S |
38° 23' 60" W |
|
15 |
976 |
Monte Recôncavo-BA |
NE |
12° 37' 88" S |
38° 37' 00" W |
|
16 |
977 |
Valença-BA |
NE |
13° 19' 60" S |
39° 15' 00" W |
|
17 |
978 |
Nazaré -BA |
NE |
12° 51' 45" S |
38° 58' 55" W |
|
18 |
979 |
Ladeira Grande-BA |
NE |
13° 00' 00" S |
39° 01' 60" W |
|
19 |
980 |
Barreiro-BA |
NE |
12° 10' 60" S |
38° 23' 60" W |
|
20 |
983 |
Chiador-MG |
SE |
22° 00' 00" S |
43° 00' 00" W |
|
21 |
985 |
Cuiabá-MT |
CO |
15° 40' 00" S |
55° 32' 60" W |
|
22 |
986 |
Nortelândia-MT |
CO |
14° 28' 60" S |
56° 45' 00" W |
|
23 |
988 |
Campo Verde-MT |
CO |
15° 39' 00" S |
55° 17' 60" W |
|
24 |
990 |
Anastácio-MS |
CO |
20° 34' 00" S |
55° 36' 00" W |
|
25 |
993 |
Coxim-MS |
CO |
18° 15' 00" S |
54° 40' 00" W |
|
26 |
997 |
Senador Canedo-GO |
CO |
16° 37' 60" S |
49° 07' 60" W |
|
27 |
999 |
Capinzal do Norte-MA |
NE |
04° 37' 00" S |
44° 22' 00" W |
|
28 |
1000 |
Porto Franco-MA |
NE |
06° 19' 60" S |
47° 19' 60" W |
|
29 |
1001 |
Porto Franco-MA |
NE |
06° 25' 60" S |
47° 21' 00" W |
|
30 |
1003 |
Porto Franco-MA |
NE |
06° 19' 60" S |
47° 19' 60" W |
|
31 |
1007 |
Alexânia-GO |
CO |
16° 10' 00" S |
48° 30' 00" W |
|
32 |
1009 |
Rio Verde-MS |
CO |
18° 43' 88" S |
54° 47' 60" W |
|
33 |
1010 |
Coxim-MS |
CO |
18° 30' 00" S |
54° 45' 00" W |
|
34 |
1013 |
Itiquira-MT |
CO |
17° 08' 88" S |
54° 51' 00" W |
|
35 |
1016 |
São José da Serra-MT |
CO |
15° 40' 00" S |
55° 21' 00" W |
|
36 |
1017 |
Cuiabá-MT |
CO |
15° 43' 00" S |
55° 43' 60" W |
|
37 |
1018 |
Campo Verde-MT |
CO |
15° 43' 00" S |
55° 17' 60" W |
|
38 |
1019 |
Primavera do Leste-MT |
CO |
15° 35' 60" S |
54° 07' 60" W |
|
39 |
1020 |
General Carneiro-MT |
CO |
15° 40' 00" S |
52° 46' 60" W |
|
40 |
1025 |
Lagoa da Confusão-TO |
N |
11° 34' 00" S |
50° 40' 00" W |
|
41 |
1026 |
Campo Verde-MT |
CO |
15° 16' 00" S |
54° 55' 60" W |
|
42 |
1240 |
Belo Horizonte-MG |
SE |
19° 55' 17" S |
43° 56' 05" W |
|
43 |
1243 |
Abadiânia-GO |
CO |
16° 07' 88" S |
48° 37' 60" W |
|
44 |
1246 |
Campinorte-GO |
CO |
14° 22' 60" S |
49° 10' 00" W |
|
45 |
1250 |
Paraíso do Tocantins-TO |
N |
10° 04' 00" S |
48° 49' 60" W |
|
46 |
1252 |
Miranorte-TO |
N |
09° 15' 00" S |
48° 34' 60" W |
|
47 |
1253 |
Wanderlândia-TO |
N |
06° 52' 00" S |
47° 51' 00" W |
|
48 |
1254 |
Darcinópolis-TO |
N |
06° 45' 00" S |
47° 49' 60" W |
|
49 |
1256 |
Dom Eliseu-PA |
N |
04° 07' 60" S |
47° 28' 00" W |
|
50 |
1257 |
Nova Rosalândia-TO |
N |
10° 31' 00" S |
49° 01' 60" W |
|
51 |
1259 |
Porto Nacional-TO |
N |
10° 58' 60" S |
48° 17' 60" W |
|
52 |
1260 |
Sta Rosa do Tocantins-TO |
N |
11° 19' 00" S |
47° 52' 00" W |
|
53 |
1262 |
Lavrado-TO |
N |
12° 07' 00" S |
46° 28' 60" W |
|
54 |
1264 |
Monte Alegre-GO |
CO |
13° 15' 00" S |
47° 08' 60" W |
|
55 |
1265 |
São João da Aliança-GO |
CO |
14° 30' 00" S |
47° 31' 00" W |
|
56 |
1267 |
Planaltina-GO |
CO |
15° 22' 60" S |
47° 31' 60" W |
|
57 |
1268 |
Alexânia-GO |
CO |
16° 07' 00" S |
48° 22' 00" W |
|
58 |
1270 |
Linda Vista-GO |
CO |
13° 18' 00" S |
49° 07' 60" W |
|
59 |
1271 |
Porangatu-GO |
CO |
12° 52' 00" S |
49° 07' 60" W |
|
60 |
1274 |
Goiânia-GO |
CO |
16° 34' 03" S |
49° 15' 54" W |
|
61 |
4944 |
Matias Cardoso-MG |
SE |
15° 01' 48" S |
43° 51' 04" W |
|
62 |
4945 |
Monte azul-MG |
SE |
15° 14' 01" S |
43° 03' 32" W |
|
63 |
4946 |
Monte azul-MG |
SE |
15° 15' 12" S |
43° 02' 60" W |
|
64 |
4947 |
Pajeú-MG |
SE |
15° 17' 12" S |
42° 54' 39" W |
|
65 |
4950 |
Andaraí-BA |
NE |
12° 48' 39" S |
41° 19' 30" W |
|
66 |
4951 |
Andaraí-BA |
NE |
12° 48' 48" S |
41° 19' 26" W |
|
67 |
4952 |
Palmeiras-BA |
NE |
12° 27' 33" S |
41° 29' 51" W |
|
68 |
4953 |
Palmeiras-BA |
NE |
12° 27' 15" S |
41° 29' 14" W |
|
69 |
4954 |
Palmeiras-BA |
NE |
12° 27' 15" S |
41° 29' 21" W |
|
70 |
4955 |
Palmeiras-BA |
NE |
12° 27' 09" S |
41° 29' 13" W |
|
71 |
4956 |
Palmeiras-BA |
NE |
12° 27' 10" S |
41° 29' 24" W |
|
72 |
4957 |
Iraquara-BA |
NE |
12° 22' 07" S |
41° 31' 00" W |
|
73 |
4959 |
Iraquara-BA |
NE |
12° 22' 08" S |
41° 31' 01" W |
|
74 |
4960 |
Iraquara-BA |
NE |
12° 22' 09" S |
41° 30' 59" W |
|
75 |
4962 |
Utinga-BA |
NE |
12° 06' 11" S |
41° 06' 48" W |
|
76 |
4963 |
Morro do Chapéu-BA |
NE |
11° 55' 02" S |
41° 08' 02" W |
|
77 |
4965 |
Cafarnaum-BA |
NE |
11° 45' 25" S |
41° 32' 01" W |
|
78 |
4966 |
Oliveira dos Brejinhos-BA |
NE |
12° 18' 06" S |
42° 37' 55" W |
|
79 |
4986 |
Aracatu-BA |
NE |
14° 28' 36" S |
41° 26' 41" W |
|
80 |
5180 |
Francisco Sá-MG |
SE |
16° 27' 56" S |
43° 25' 54" W |
(TECNAL Scientific Equipments, Piracicaba, SP, Brazil) for 3 hours. Ashing was done by placing folded filter bags in crucibles in a muffle furnace at 500°C for at least 5.5 hours. N concentration was determined by Kjeldahl method (AOAC, 1996) with a Tecnal™ 0365 digestion–distillation system and CP was calculated as N x 6.25. True IVDMD was determined by 48-hour ruminal fermentation at 39.5°C in a Tecnal™ in vitro incubator system using the procedure described by Tilley and Terry (1963), with modification by Goering and Soest (1970). Hemicellulose concentration (Hemic) was estimated by subtracting ADF from NDF and Cellulose (CELLU) by subtracting LIG from ADF.
Statistical Analysis
Univariate analysis was performed through the F test to detect potential differences among sites of collection as well as similarity clusters for each quality trait. Multivariate analysis was used to examine the genetic variability of the accessions. A hierarchical clustering analysis was done to sort out groups of similarity based on Ward's minimum variance method and their genetic dissimilarity were estimated by the square root of the generalized Mahalanobis D2 distances (Alvares, Reis, & Pinto, 2012; Bapurao, Kumar, Suresh, & Kuma, 2018). Cluster analysis allows classifying accessions into homogeneous groups based on their quality-traits values. Accessions within the same group are more similar and homogeneous while accessions among different groups are more divergent and heterogeneous.
A principal components analysis (PCA) was performed to discriminate among accessions and group them. The goal of PCA is to provide a reduced dimension model that would indicate differences among groups of similarity. It also contributes to a better understanding of the variables by describing how much of the total variance was explained by each one of them. Also, PCA analysis allows graphical visualization of the variables, identification of similar and divergent accessions, and highlights the variables that contribute most to the differentiation of accessions (Philippeau & Philippeau, 1986). All statistical analyses were done with the R software version 3.6.2 programme (R Core Team, 2019).
The phenotypic diversity among accessions was estimated by the index of Shannon and Weaver (1949) corrected by the logarithm of the number of classes and Simpson (1949): Shannon and Weaver corrected: J = H'/ ln S = -∑pi * ln pi / ln S; and Simpson: D = 1 - ∑pi 2, where J is the Shannon corrected index, H' is the richness and evenness Shannon index, pi is the proportion of the class i, and ln S the natural logarithm of the total number of classes. Both indices are used to express the concepts of richness, meaning the number of different accessions in a sampling effort, as well as evenness, meaning the degree of equality in the abundance of individuals, or the relative uniformity of their distribution across groups of accessions (Meng, Smale, Ruifa, Brennan, & Godden, 1999). These indices are used to estimate diversity within populations (Kosman & Leonard, 2007) and range from zero to one, where one represents high genetic diversity and zero no genetic diversity. They correspond to the probability of two individuals randomly selected from a group to exhibit similar characteristics (Carvalho & Quesenberry, 2009).
Results
The average concentration of CP, IVDMD, NDF, ADF, LIG, HEMIC and CELLU were 220.6 ± 20.2g/kg, 560 ± 56.0g/kg, 516.8 ± 44.1g/kg, 368 ± 32.9g/kg, 69.4 ± 9.4g/kg, 148.8 ± 31.5g/kg and 298.6 ± 32.9g/kg, respectively (Table 2).
|
Trait |
|
Statistics |
||
|
Mean ± SD |
Range |
MSs |
p-value (Pr>F) |
|
|
Crude Protein |
220.6 ± 20.2 |
185.1–279.2 |
6.748 |
0.2003 |
|
In Vitro Dry Matter Digestibility |
560.0 ± 56.0 |
427.9–718.8 |
71.550* |
0.0127 |
|
Neutral Detergent Fibre |
516.8 ± 44.1 |
419.3–630.1 |
21.640 |
0.3550 |
|
Acid Detergent Fibre |
368.0 ± 32.9 |
288.2–456.4 |
31.045** |
0.0014 |
|
Lignin |
69.4 ± 9.4 |
45.7–91.6 |
1.243 |
0.186 |
|
Hemicellulose |
148.8 ± 31.5 |
103.7–264.3 |
13.031 |
0.229 |
|
Cellulose |
298.6 ± 29.9 |
229.9–395.3 |
30.034** |
0.00016 |
Means of IVDMD, ADF and CELLU were significantly different for site of collection (Brazilian states, Table 3). Accessions from BA, GO, PA and TO had higher IVDMD concentrations. PA (only one sample) and TO states, had the highest IVDMD concentration, 653.4g/kg and 590.6 ± 18.5g/kg, respectively, and were significantly different from those for MS and MT states. Accessions from GO, MA, PA, and TO had the lowest concentrations of ADF and CELLU, with 368 ± 32.9g/kg and 298.6g ± 32.9g/kg, respectively. Lower fibre concentrations were also found for PA (only one accession) and TO, with 341.4g/kg and 339.8 ± 28.3g/kg of ADF and 264.5g/kg and 272.1 ± 23.2g/kg of CELLU, respectively (Table 3).
|
State |
BA |
GO |
MA |
MG |
MS |
MT |
PA |
RJ |
TO |
|
|
Trait |
Nº |
32 |
11 |
4 |
7 |
4 |
11 |
1 |
1 |
9 |
|
CP |
Mean |
221.8 |
233.6 |
226.7 |
218.5 |
241.2 |
226.1 |
209.3 |
195.9 |
239.8 |
|
± SD |
27.7 |
12.9 |
10.5 |
17.0 |
6.5 |
19.9 |
- |
- |
15.6 |
|
|
Min |
185.1 |
218.3 |
213.6 |
196.8 |
235.2 |
185.3 |
209.3 |
195.9 |
215.6 |
|
|
Max |
279.2 |
257.0 |
238.7 |
240.8 |
249.6 |
250.2 |
209.3 |
195.9 |
265.5 |
|
|
IVDMD |
Mean |
572.1ab |
563.0ab |
549.5abc |
558.7abc |
520.0bc |
509.8c |
653.4a |
533.0abc |
590.6a |
|
± SD |
55.4 |
55.1 |
23.0 |
60.3 |
73.9 |
47.3 |
- |
- |
18.5 |
|
|
Min |
476.0 |
467.7 |
517.9 |
479.4 |
427.9 |
431.4 |
653.4 |
533.7 |
563.9 |
|
|
Max |
718.8 |
658.9 |
567.4 |
651.1 |
587.9 |
587.7 |
653.4 |
533.7 |
611.4 |
|
|
NDF |
Mean |
511.1 |
515.3 |
518.6 |
539.1 |
502.6 |
541.3 |
470.6 |
541.7 |
499.8 |
|
± SD |
39.3 |
52.5 |
46.0 |
58.0 |
21.6 |
38.6 |
- |
- |
47.0 |
|
|
Min |
419.3 |
442.6 |
459.9 |
475.8 |
488.2 |
485.7 |
470.6 |
541.7 |
445.8 |
|
|
Max |
627.2 |
624.2 |
572.3 |
630.1 |
534.7 |
594.9 |
470.6 |
541.7 |
597.7 |
|
|
ADF |
Mean |
370.3ab |
357.9bc |
336.0c |
390.0a |
366.6abc |
390.3a |
341.4bc |
420.2a |
339.8c |
|
± SD |
28.8 |
23.3 |
24.4 |
36.1 |
11.8 |
36.5 |
- |
- |
28.3 |
|
|
Min |
371.6 |
368.9 |
335.0 |
392.3 |
364.1 |
385.0 |
341.4 |
420.2 |
346.2 |
|
|
Max |
382.3 |
371.7 |
345.4 |
412.4 |
372.9 |
411.7 |
341.4 |
420.2 |
364.8 |
|
|
LIG |
Mean |
69.2 |
66.5 |
76.2 |
76.4 |
65.0 |
67.2 |
76.9 |
82.0 |
67.7 |
|
± SD |
9.6 |
8.2 |
13.3 |
6.8 |
5.1 |
9.4 |
- |
- |
9.5 |
|
|
Min |
49.9 |
55.8 |
62.3 |
68.7 |
59.5 |
45.7 |
76.9 |
82.0 |
58.5 |
|
|
Max |
91.6 |
85.9 |
91.4 |
87.5 |
70.1 |
81.1 |
76.9 |
82.0 |
86.4 |
|
|
HEMIC |
Mean |
140.7 |
157.3 |
182.6 |
149.1 |
136.1 |
151.0 |
129.2 |
121.4 |
160.0 |
|
± SD |
25.7 |
41.3 |
37.9 |
34.2 |
21.3 |
20.2 |
- |
- |
41.4 |
|
|
Min |
103.7 |
119.2 |
152.5 |
119.5 |
113.3 |
130.3 |
129.2 |
121.4 |
128.4 |
|
|
Max |
221.1 |
253.6 |
234.1 |
214.9 |
164.8 |
189.9 |
129.2 |
121.4 |
264.3 |
|
|
CELLU |
Mean |
301.2ab |
291.4ab |
259.9c |
313.5a |
301.5ab |
323.1a |
264.5bc |
338.2a |
272bc |
|
± SD |
22.9 |
23.2 |
16.1 |
30.7 |
11.9 |
37.3 |
- |
- |
23.2 |
|
|
Min |
234.7 |
250.0 |
239.2 |
273.6 |
286.1 |
284.3 |
264.5 |
338.2 |
230.0 |
|
|
Max |
363.9 |
318.7 |
275.3 |
359.4 |
313.3 |
395.3 |
264.5 |
338.2 |
299.7 |
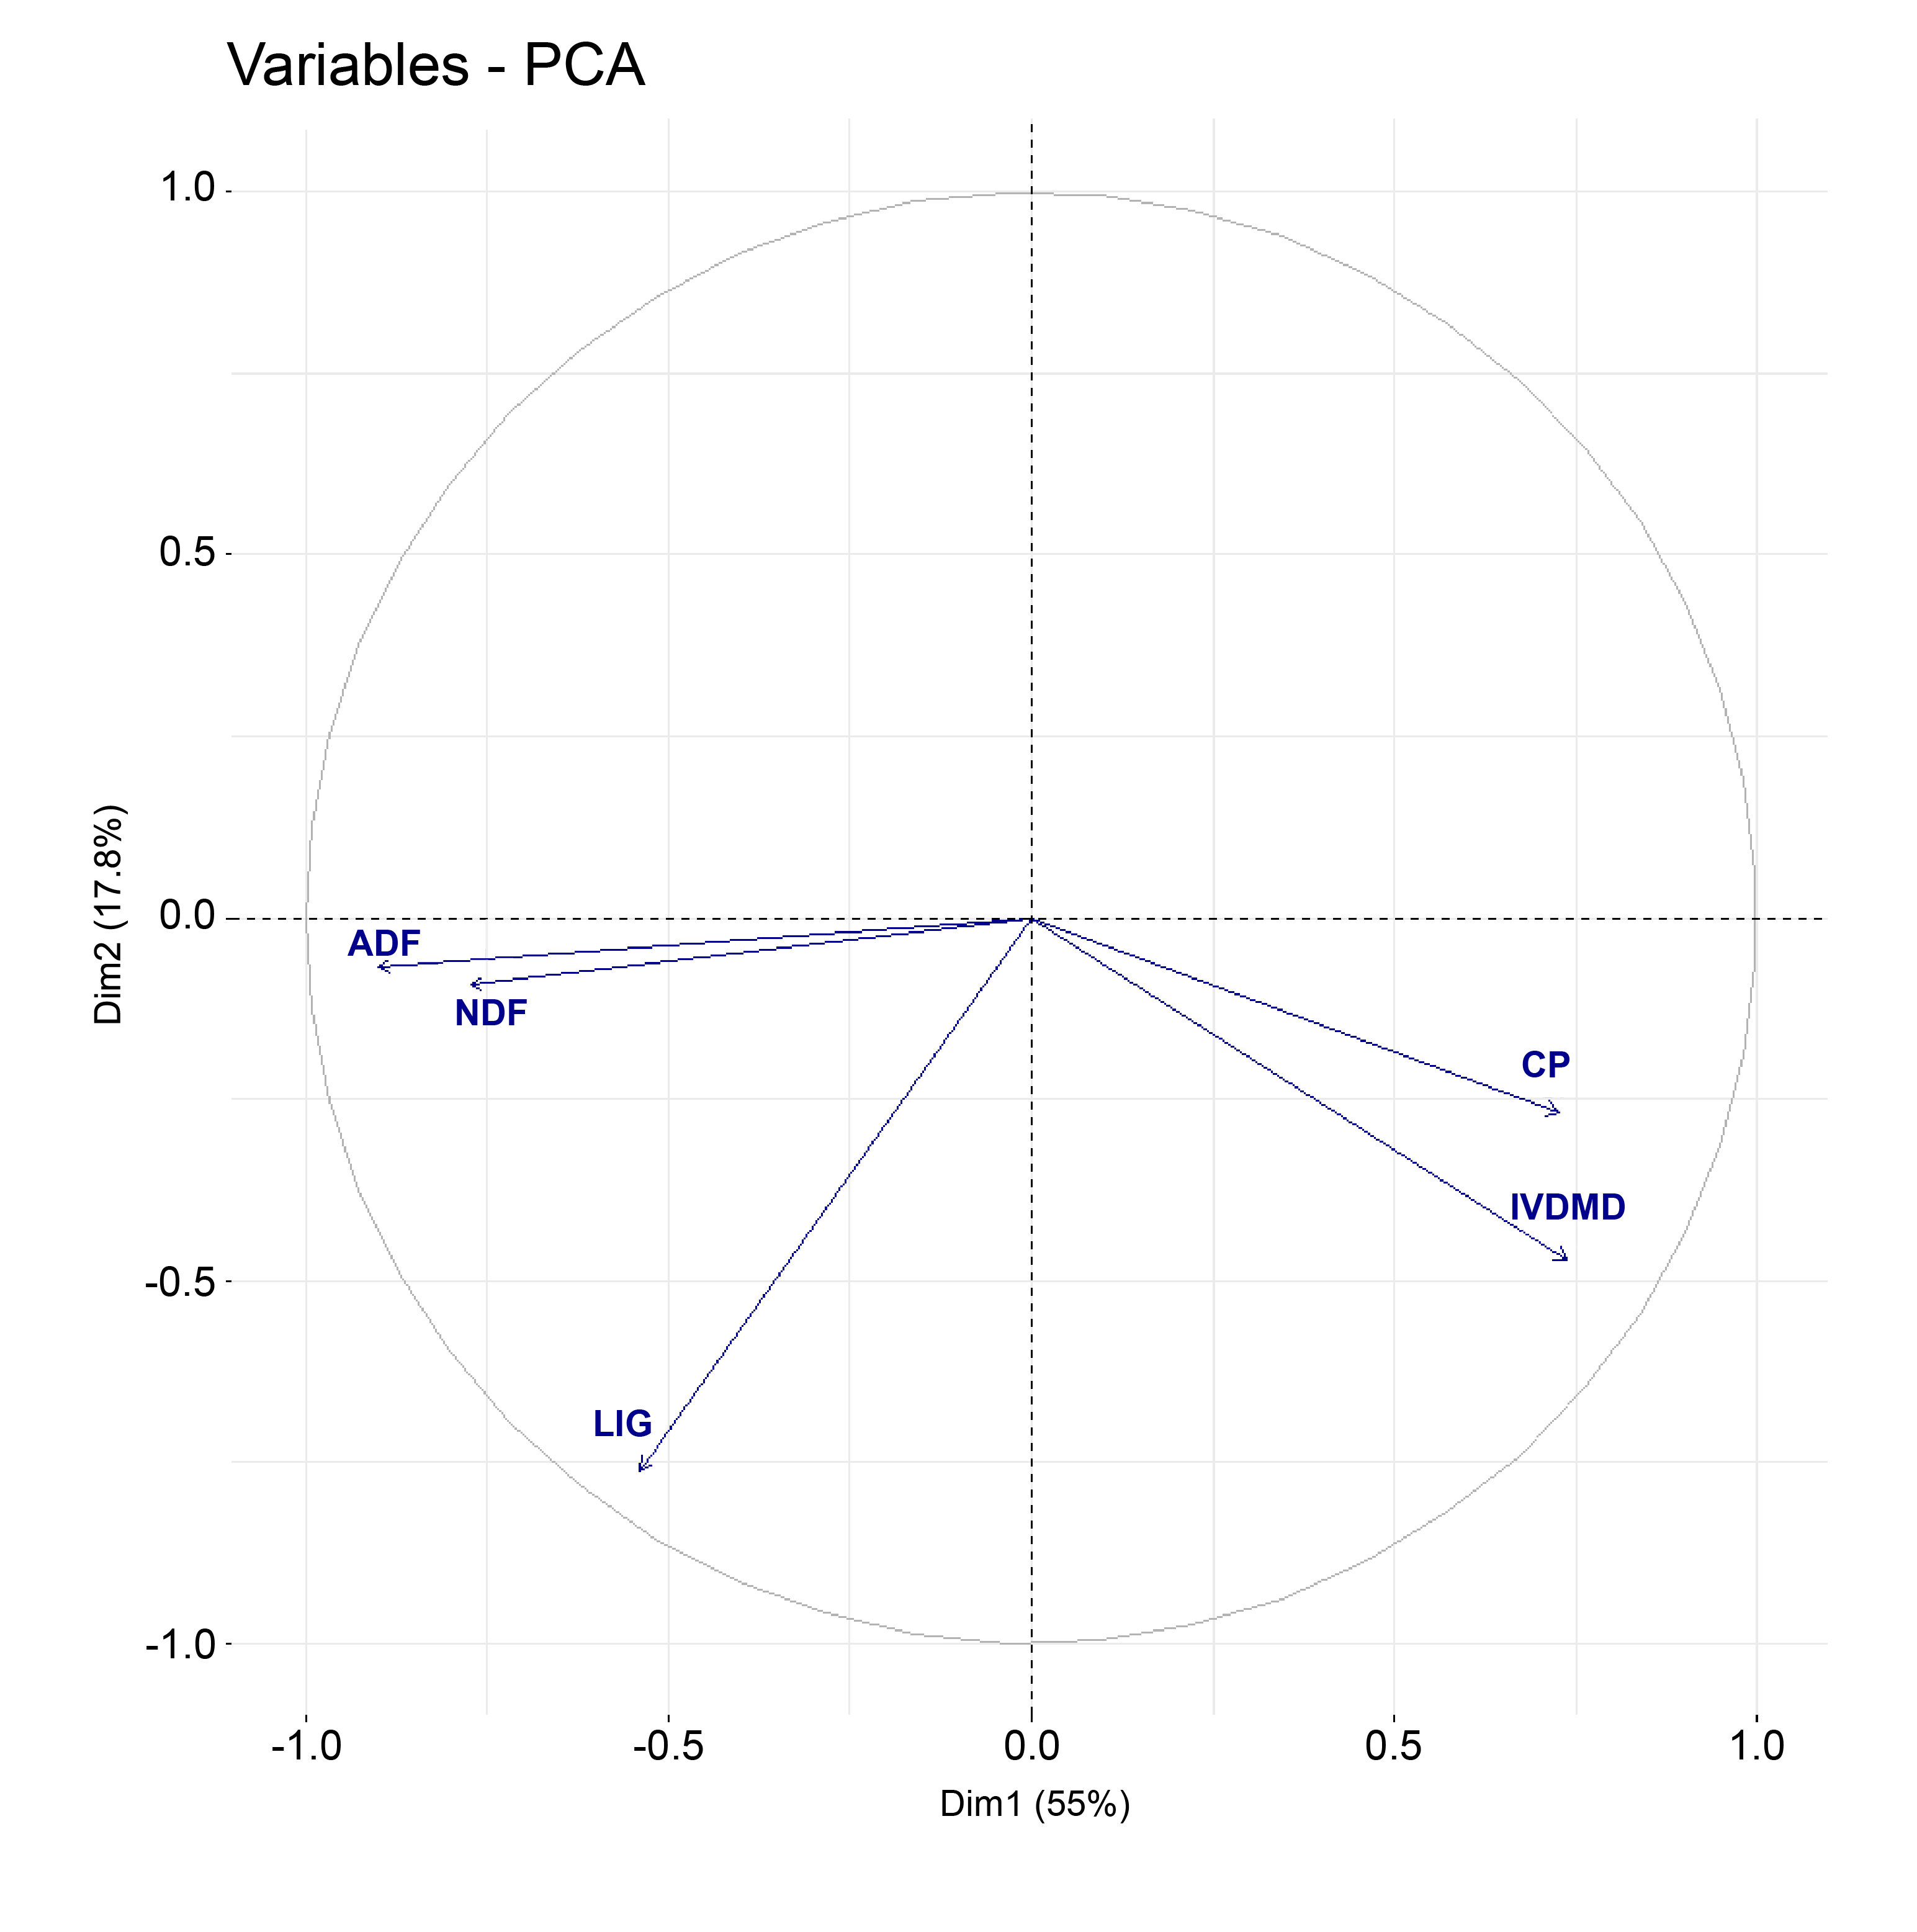
The PCA of the 80 accessions resulted in five principal components explaining all variations (Table 4). The first two principal components accounted for 73% of the total variance among all accessions. The first PC was responsible for 55% and the second for 18% of the variation. Variables that are correlated with PC1 and PC2 are the most important in explaining the variability in the data set. The correlation between each variable and the PC was used as the coordinate in a circle of radius equals to one, and represents the intensity in which the variable contribute to PC1 and PC2 (Figure 1). Traits ADF, NDF, IVDMD and CP contributed most to PC1, with values ranging from 0.73 to 0.90, while only LIG had an important contribution to PC2, with a value of 0.76. Figure 1 displays the correlation circle of the PCA. Positively correlated variables point to the same side of the plot and negatively correlated variables point to opposite sides of the graph.
|
PCA |
PC1 |
PC2 |
PC3 |
PC4 |
PC5 |
|
Eigen values |
2,77 |
0,89 |
0,67 |
0,43 |
0,24 |
|
Proportion of variance (%) |
55,48 |
17,77 |
13,41 |
8,57 |
4,78 |
|
Cumulative variance (%) |
55,48 |
73,24 |
86,65 |
95,22 |
100,00 |
|
CP |
0,73 |
-0,27 |
0,51 |
-0,37 |
-0,08 |
|
IVDMD |
0,74 |
-0,47 |
0,05 |
0,47 |
-0,08 |
|
NDF |
-0,77 |
-0,09 |
0,55 |
0,18 |
0,24 |
|
ADF |
-0,90 |
-0,07 |
0,16 |
0,05 |
-0,40 |
|
LIG |
-0,54 |
-0,76 |
-0,29 |
-0,19 |
0,09 |
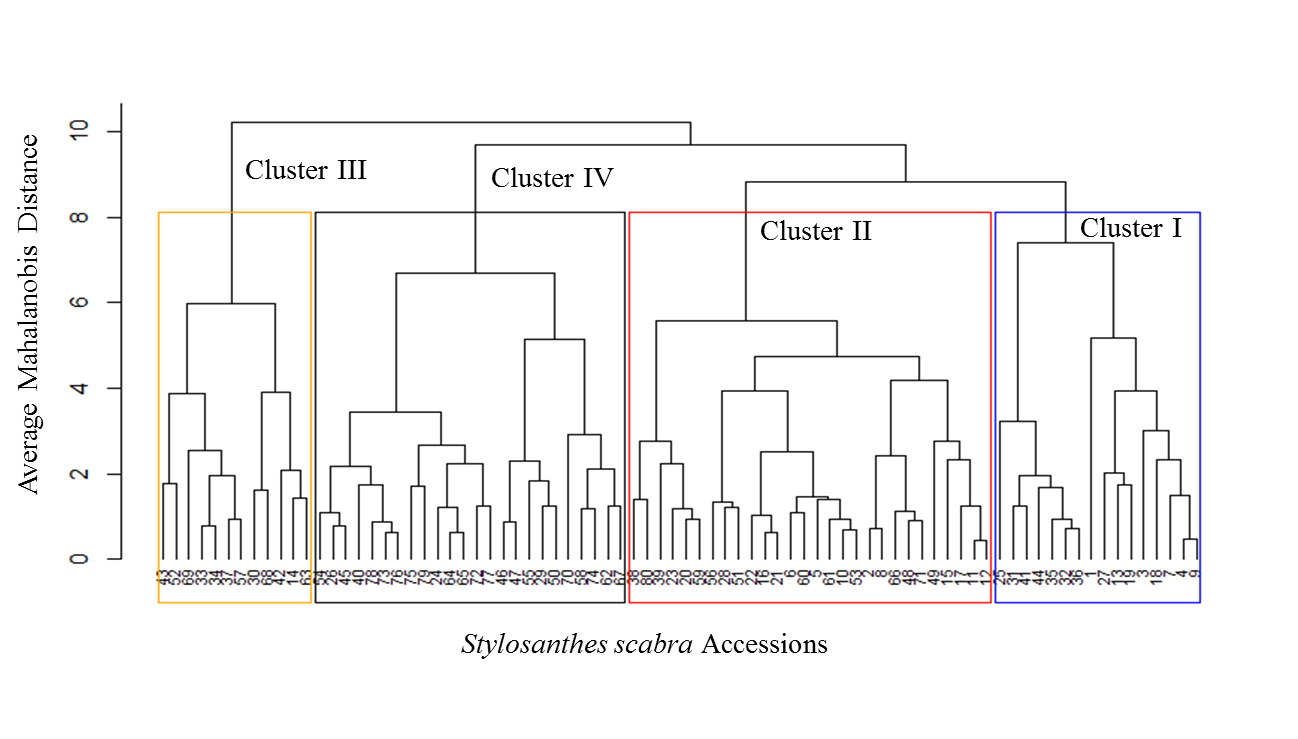
The Kelley–Gardner–Sutcliffe penalty function for hierarchical cluster trees was used to define the number of groups (Kelley, Gardner, & Sutcliffe, 1996). The minimum of this function defines the group size. In this study, clustering of the 80 accessions resulted in four clusters, which means four diversity classes of forage nutritive values, considering CP, IVDMD, NDF, ADF, and LIG concentrations (Figure 2). All traits had high and similar diversity values from Simpson’s that ranged from 0.771 to 0.781 and Shannon–Weaver’s indices that ranged from 0.806 to 0.817 (Table 5).
|
Trait |
Simpson |
Shannon–Weaver |
|
Crude Protein (CP) |
0.781 |
0.813 |
|
In Vitro Dry Matter Digestibility (IVDMD) |
0.771 |
0.806 |
|
Neutral Detergent Fibre (NDF) |
0.779 |
0.812 |
|
Acid Detergent Fibre (ADF) |
0.774 |
0.808 |
|
Lignin (LIG) |
0.779 |
0.817 |
Discussion
In Australia, 'Seca' and 'Fitzroy' S. scabra cultivars have been released with high dry matter yields, adequate nutritive values, drought tolerance and persistence (Edye et al., 1998). In Nigeria,Akinlade et al. (2008) found CP concentrations ranging from 147g/kg to 151g/kg for four S. scabra cultivars. In Argentina,Ciotti, Tomei, and Castelan (1999) evaluated 33 accessions of 6 different species of Stylosanthes in which 4 S. scabra accessions had CP mean values ranging from 78g/kg to 134g/kg. In Brazil, CP from Stylosanthes commercial cultivars from different species or a mixture of species (S. guianensis cv. Mineirão, S. macrocephala cv. Pioneiro, and a mixture of S. capitata and S. macrocephala cv. Campo Grande) are reported with concentrations ranging from 98 to 210g/kg (Braga et al., 2020). The mean value obtained in this study for S. scabra was 220g/kg, higher than those from Argentina and higher or similar to other studies in Brazil. This CP high value reflects the species’ potential to be used as a forage in animal production systems in the tropics.
The S. scabra NDF and ADF values obtained in this research are similar to the ones reported for 71 accessions from five Stylosanthes species collected in Brazil (Santana, 2010): S. angustifolia with 540g/kg of NDF and 378g/kg of ADF; S. capitata with 490g/kg of NDF and 330g/kg of ADF; S. macrocephala 545g/kg of NDF and 394g/kg of ADF; S. pilosa with 531g/kg of NDF and 394g/kg of ADF; and S. viscosa with 553g/kg of NDF and 390g/kg of ADF in average. The average fibre concentration of S. scabra in this study was 517g/kg for NDF and 368g/kg for ADF, which indicate that the fibre content among different Stylosanthes species is similar. This fibre characteristics together with the high CP content indicate that S. scabra species may be used, as other Stylosanthes species, as an important forage for seasonally dry tropical and subtropical environments in Brazil.
There were significant differences among sites of collection for IVDMD, ADF, and CELLU, pointing to the existence of phenotypic variability among accessions (Table 2). The range for IVDMD, ADF and CELLU were 291g/kg, 168g/kg and 165g/kg, respectively. This indicates that there is potential genetic diversity among genotypes for IVDMD, ADF and CELLU to be successfully exploited in a breeding programme. Differences among genotypes from different states were not significant for CP, NDF, LIG, and HEMIC. Thus, genetic gains from selection might be less effective when selecting for high CP and HEMIC, as well as low NDF and LIG from this collection.
The negative correlation between digestibility and fibre concentrations in forage species is well known because the carbohydrates in the NDF and ADF portions of plant tissues are mostly cell walls indigestible to ruminants. Thus, the lower ADF and CELLU concentrations from PA and TO indicate that those accessions may produce segregant populations when used in breeding programmes for higher nutritive quality forage. This is only an indication, additional studies should be carried out since higher IVDMD and lower fibre contents may not be due only to genetic effects but also management practices, plant age and other environmental effects.
The goal of PCA is to provide a reduced dimension model that would indicate measured differences among groups. It also can contribute to a better understanding of the set of variables by describing how much of the total variance is explained by each one. The circle of correlations graphic illustrates the direction as well as the intensity of the variable vectors in the first two components (Figure 1). Note that CP, IVDMD, NDF, ADF vectors have closer inclinations along PC1, with CP and IVDMD vectors pointing to the same orientation, as are NDF and ADF but in opposite directions. The IVDMD and ADF concentrations are the closest to the circle of correlations, indicating the better representation of the traits on the definition of PC1. Yet, LIG was the only trait with a better representation on PC2. Variables close to the centre of the circle are less important for the first component. In brief, there was a positive correlation between CP and IVDMD and between NDF and ADF, as well as negative correlations among the former traits with the latter ones. ADF, IVDMD and LIG were the traits with the best representations on the first two principal components.
In this study, 80 accessions resulted in four clusters, which means four diversity classes of forage nutritive values, considering CP, IVDMD, NDF, ADF, and LIG concentrations (Figure 2). Concentrations of HEMIC and CELLU were not considered in the analysis since they are highly correlated to NDF and ADF concentrations, respectively, from which they are directly derived (Table 4). The four Mahalanobis distance clusters were plotted in the PCA graphic, each in a 0.95 probability level ellipsis, to get a better view of their distribution (Figure 3). Scatter plots of the principal component scores were convergent with the clusters’ ellipsis, allowing the visualization and identification of locations with higher concentrations of a given trait in the forage.
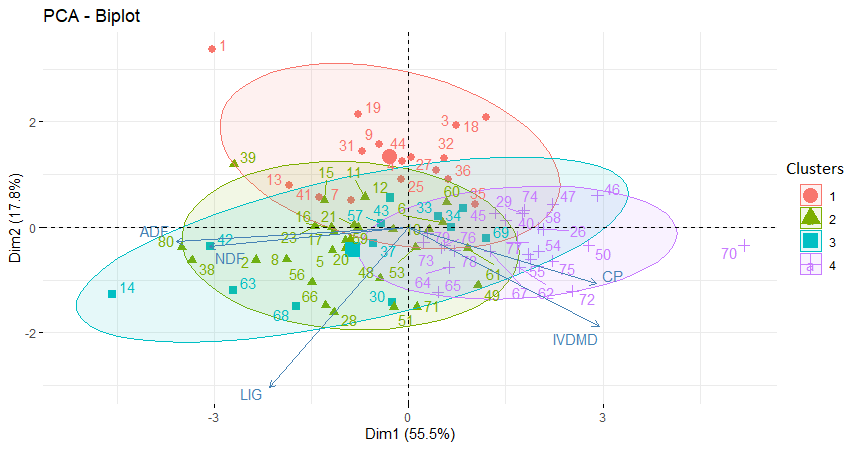
Four out of the five original variables had high contributions to the first principal component. This first component is a measure of forage quality when IVDMD and CP increase. Also, it is a measure of lack of quality when the fibre components NDF and ADF increase. Furthermore, the first principal component correlates most strongly with the ADF (r = 0.90). Thus, this first principal component may be considered primarily a measure of the ADF concentration. This implies that accessions with higher values of ADF tend to have a lower quality of forage. The second principal component increases with the decrease of LIG concentration. This component can be viewed as a measure of forage quality as LIG concentration decreases. PCA analysis did separate the accessions into two dimensions, even though the traits are quantitative with a scatter distribution along PC1 and PC2. All five quality characteristics had high loading values in the first two principal components, ranging from 0.73 to 0.90, indicating their importance as S. scabra descriptors.
Cluster II and IV with 28 and 24 accessions, respectively, were the largest, representing together 65% of the total accessions. Cluster I with 16 accessions and Cluster III with 12 accessions represented the remaining 35% of the total number of accessions (Table 6). The analyses of variance among clusters for each trait are presented in Table 7. There were highly significant differences among clusters for CP, IVDMD and ADF, indicating substantial genetic variability. Cluster IV included accessions with the highest CP and IVDMD concentrations and the lowest ADF concentration, representing the group of accessions with the higher forage quality, and may be used for hybridization in breeding programmes. Clusters I and II had the lowest CP and IVDMD, as well as the highest ADF concentrations, representing the lowest nutritive value cluster. Cluster III had intermediate values for all traits and its CP concentration was significantly different from all other clusters.
|
Cluster |
Nº of Accessions |
Accessions ID |
|
I |
16 |
1, 3, 4, 7, 9, 13, 18, 19, 25, 27, 31, 32, 35, 36, 41, 44 |
|
II |
28 |
2, 5, 6, 8, 10, 11, 12, 15, 16, 17, 20, 21, 22, 23, 28, 38, 39, 48, 49, 51, 53, 56, 59, 60, 61, 66, 71, 80 |
|
III |
12 |
14, 3033, 34, 37, 42, 43, 52, 57, 63, 68, 69 |
|
IV |
24 |
24, 26, 29, 40, 45, 46, 47, 50, 54, 55, 58, 62, 64, 65, 67, 70, 72, 73, 74, 75, 76, 77, 78, 79 |
Formation of similarity groups and respective estimation of their divergence is useful when choosing accessions to be used as progenitors for superior hybrid combinations in breeding programmes. Divergence estimates by Mahalanobis D distances are presented in Table 8. The intra-group distances were very similar for all four clusters, ranging from 3.15 to 3.37, and were consistently lower than the inter-cluster distances, which ranged from 6.92 to 12.47, as expected. These distances clearly suggest a great deal of genetic similarity within and genetic divergence among clusters. The shortest inter-cluster distance was between Cluster II, indicating lower divergence. The highest inter-group distance was 12.46 between Clusters I and III, followed by 11.99 between Clusters III and IV, and 11.98 between Clusters I and IV. High divergences among groups were consistent with the ANOVA results where Cluster IV was significantly different from Clusters I and III, for CP, IVDMD and ADF. In a breeding programme, crosses between accessions with maximum divergence may give rise to genetically diverse lines and the potential production of heterotic transgressive segregants. A great deal of variation in subsequent generations is expected from crosses among plants of maximum inter-class distances clusters. This may not be true between low-divergent clusters as Clusters I and II.
|
|
CP (%) |
IVDMD (%) |
NDF (%) |
ADF (%) |
LIG (%) |
|
Cluster I |
21,58 ± 2.21c |
50,35 ± 4.27c |
50,98 ± 3.32 |
36,73 ± 2.64 a |
6,13 ± 0.72 |
|
Cluster II |
21,25 ± 1.35c |
54,81 ± 4.40b |
52,06 ± 2.99 |
38,36 ± 2.77 a |
7,63 ± 0.63 |
|
Cluster III |
22,97 ± 1.74b |
55,96 ± 3.88b |
58,36 ± 3.52 |
37,65 ± 3.66 a |
7,19 ± 1.24 |
|
Cluster IV |
24,82 ± 1.41a |
61,18 ± 3.72a |
48,37 ± 2.51 |
34,60 ± 2.98 b |
6,55 ± 0.54 |
|
Mean |
22.65 ± 1.72** |
56,00 ± 4.12** |
51.68 ± 4.37n.s |
36.80 ± 3.14** |
6,94 ± 0.95n.s. |
|
Range |
18.53–27.92 |
42.79–71.88 |
44.13–52.41 |
33.18–40.23 |
4.57–7.56 |
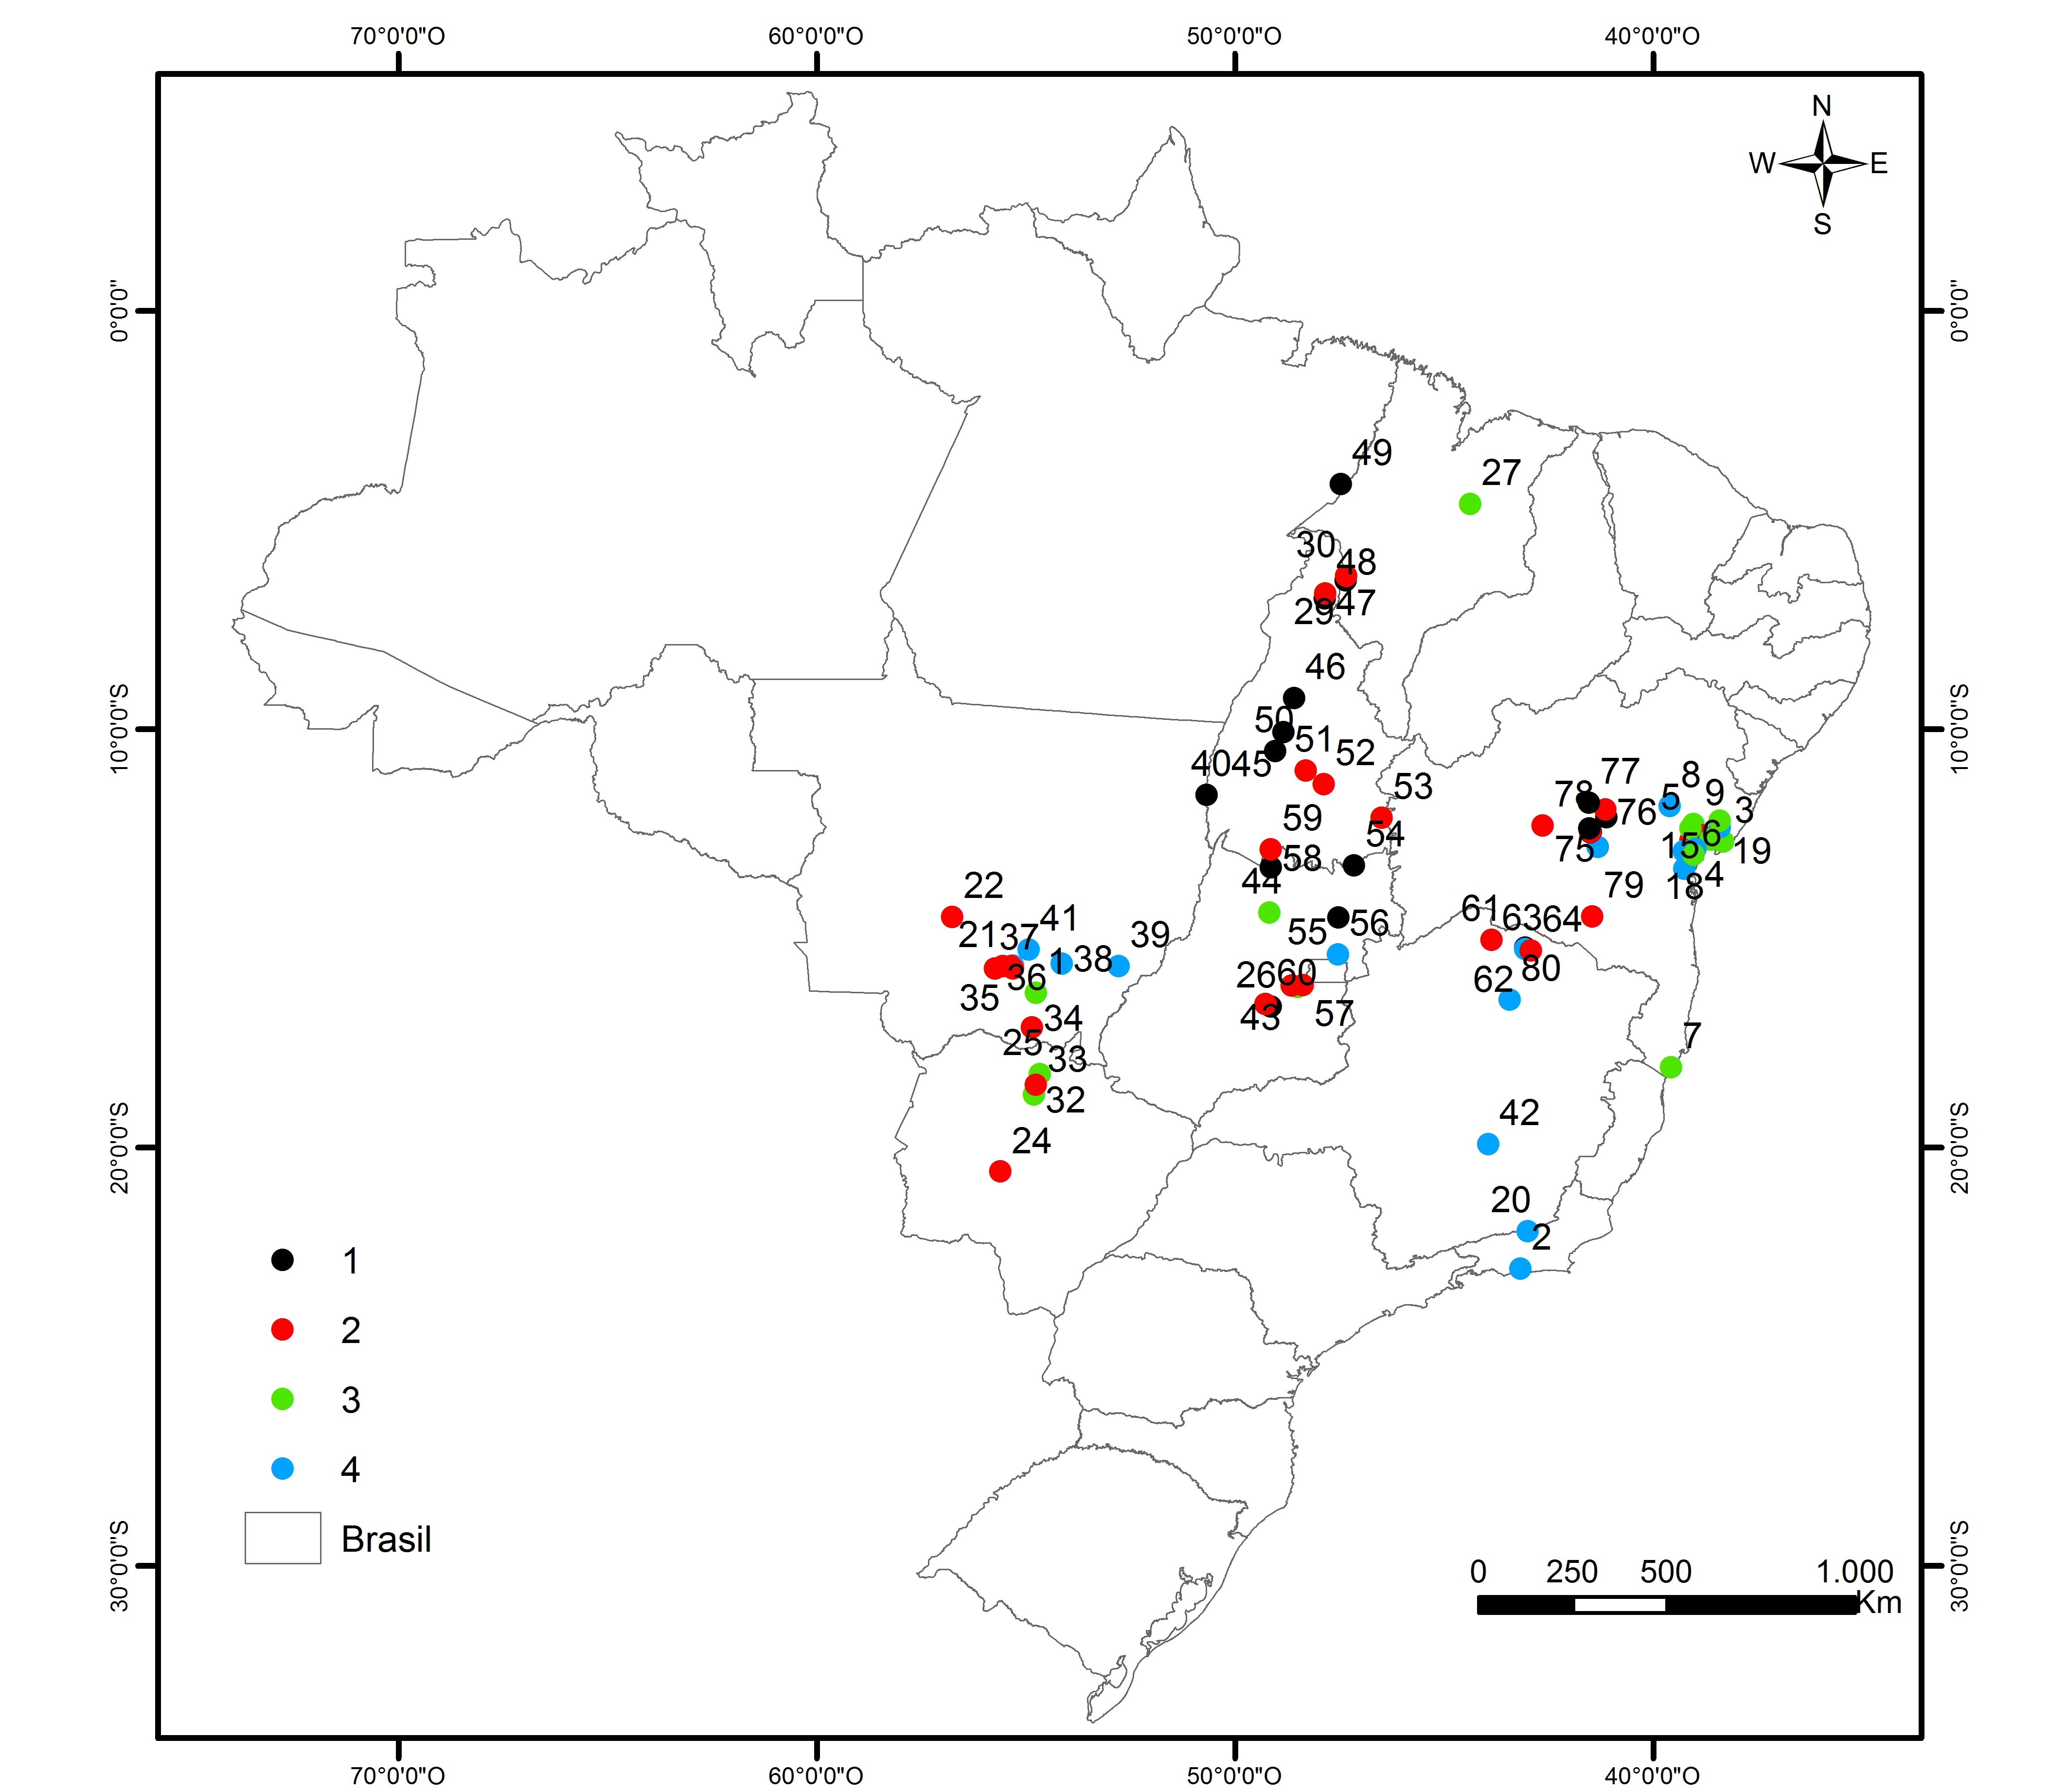
The pattern of distribution of accessions in different clusters did not reflect the geographical diversity of the site of collection (states). Accessions from each state were consistently distributed among the four clusters of forage quality (Figure 4). Cluster I presented accessions from five states, Cluster II from eight, Cluster III from seven, and Cluster IV from six, all out of a total of nine states. Thus, the observed traits diversity was somewhat similar among the different collection sites, leading to a lack of effect of the source locations on the four quality groups definition considering this germplasm collection.
|
Cluster |
I |
II |
III |
IV |
|
I |
3.22 |
|
|
|
|
II |
6.92 |
3.15 |
|
|
|
III |
12.47 |
9.71 |
3.37 |
|
|
IV |
11.98 |
9.79 |
11.99 |
3.18 |
Simpson’s and Shannon–Weaver’s indices expressed the diversity among accessions within each population, in this case, each different Brazilian state where collecting was done. High values for both indices suggest a significant amount of genetic variation for forage quality traits.
Conclusions
There is considerable genetic diversity for forage nutritive values among the S. scabra accessions from Embrapa Cerrado’s germplasm bank. This variability was reflected across geographic areas in Brazil for in vitro digestibility, acid detergent fibre, and cellulose concentrations.
Independent of the site of collection (Brazilian states), 24 high-quality S. scabra accessions are promising parents for breeding due to their higher digestibility and protein content, as well as lower lignin concentrations.
S. scabra accessions from Embrapa Cerrado’s germplasm bank presented significant genetic diversity that may be useful for developing new high-quality improved forage populations in a breeding programme.
Author contributions
All authors contributed to the study conception and design. Fabiana Karla de Araújo Américo, Marcelo Ayres Carvalho, Allan Kardec Braga Ramos and Claudio Takao Karia did all genetic material preparation, experiment implementation and conduction, and data collection and organization. Fabiana Karla de Araújo Américo and Carlos Eduardo Lazarini da Fonseca did the wet lab analysis. Juaci Vitória Malaquias, Marcelo Ayres Carvalho and Carlos Eduardo Lazarini da Fonseca did the data analysis. Fabiana Karla de Araújo Américo, Marcelo Ayres Carvalho and Carlos Eduardo Lazarini da Fonseca wrote the first draft of the manuscript, and all authors commented on the different versions of the manuscript. Marina de Fátima Vilela did the geographical information plots. Gustavo José Braga was responsible for reviewing the manuscript. All authors read and approved the final manuscript.
Conflict of interest statement
All authors have no affiliations with or involvement in any organization or entity with any financial interest or non-financial interest in the subject matter or materials discussed in this manuscript.
Funding
This work was partially funded by the Coordenação de Aperfeiçoamento de Pessoal de Nível Superior - CAPES (Coordination for the Improvement of Higher Education Personnel, a Federal Agency) which awarded a scholarship to the first author. This work was part of her dissertation in partial fulfilment of the requirements of Doctor of Science (DSc) in Plant Genetic Resources from the Universidade Federal de Feira de Santana.