Genetic differentiation between coexisting wild and domestic reindeer (Rangifer tarandus L. 1758) in Northern Eurasia
Abstract
Rangifer tarandus L. 1758 is one of the few modern hoofed species in which domestic and wild forms coexist in the same territory. The genetic differentiation of domestic and wild reindeer in Northern Eurasia was examined using microsatellite data. А total of 780 animals were studied at 16 microsatellite loci. Samples of wild reindeer were taken from seven populations inhabiting different natural areas, and samples of domestic animals were selected from the Evenki, Evens, Chukchi and Nenets breeds, including two ecotypes, Tofalar and Todzha reindeer. The levels of genetic diversity and variation in wild reindeer were higher than in domestic ones. Bayesian clustering analysis allowed us to distinguish domesticated reindeer populations by the degree of taming, but failed to detect differences in genetic structure between wild reindeer populations. These differences were found using the pairwise Fst values. Overall, the microsatellite analysis revealed a significant genetic differentiation between domestic and wild forms and the structuring of populations within each form, which may be important for the development of strategies for animal conservation.
Keywords
Domestic and wild forms of reindeer, geographic population, microsatellites, phylogenetic tree, biodiversity
Introduction
Reindeer (Rangifer tarandus L. 1758) is a widespread circumpolar species on the planet. The geographic distribution of reindeer mainly covers the northern part of the Arctic region, including arctic and subarctic regions of Eurasia and North America (Williams & Heard, 1986). Although the range of reindeer is very large, the species has been classified as vulnerable by the International Union for Conservation of Nature (IUCN) because of a 40% decline over the last decades (Gunn, 2016). The decline in population size is the result of the intensification of industrial development in the Arctic and climate warming (Yannic et al., 2014).
For the indigenous Arctic ethnic groups living in Northern Eurasia, reindeer are of great economic, social, cultural and ecological importance, since they are a source of meat, hide and milk, as well as a means for transportation. In the historical process, the employment of reindeer has been of crucial importance in the colonization of the northernmost parts of Eurasia. Currently, reindeer continue to play a central role in the cultures of the Indigenous Nenets, Chukchi, Evenki, Sami, Evens Peoples and other Peoples of Northern Eurasia (Bjørklund, 2013; Helskog & Indrelid, 2011).
Reindeer husbandry is undoubtedly a historical branch of animal keeping in the northern regions of Russia. Unlike other Arctic countries, reindeer husbandry in Russia is much differentiated. Representatives of 18 peoples are engaged in the industry, thereby preserving their national traditions, and 16 of them are included in the official list of Indigenous Small-Numbered People of the North (Jernsletten & Klokov, 2002).
By now, four native (Nenets, Evens, Evenki and Chukchi) breeds of reindeer have been officially registered in Russia. The Nenets breed is widespread in the Taymyr District of the Krasnoyarsk Territory, as well as in the Yamal-Nenets, Nenets and Khanty-Mansi Autonomous Districts, the Komi Republic and the Murmansk Region. Currently, this reindeer breed is the most numerous (over 880,000 heads) and prosperous. The Chukchi breed inhabits the territory of the Chukotka and Kamchatka peninsulas and the northeast of Yakutia. The Evenki breed is bred in the taiga zone of Siberia and the Far East, from the Yenisei River region to the shores of the Sea of Okhotsk and Sakhalin Island. The Evens breed habitat is the mountain-taiga regions of Yakutia and Kamchatka, as well as the region of Magadan (by its type, this breed occupies an intermediate position between the Chukchi and Evenki breeds). All breeds differ in productivity and conformation, as well as in adaptation to specific natural and climatic conditions. Based on our own observations and FAO data (Zabrodin & Borozdin, 1989), we summarized the descriptive characteristics of the four breeds mentioned above (Table 1 ). The breed-forming processes in reindeer husbandry have much in common with the breed genesis of other species of domesticated aboriginal animals, such as horses, sheep, yaks, camels, etc. The reindeer breed specialty is based on the folk traditional breeding system and the complete lack of commercial incentives, features that later also appear in stud breeding in Europe and North America (Kharzinova et al., 2015). All the reindeer breeds are aboriginal and the result of folk selection by various northern people (Kharzinova et al., 2015; Zabrodin et al., 1989). Within the breeds, there are some ecotypes that are characterized by their own morphological features, but they are taxonomically indistinguishable (Davydov et al., 2007). In particular, within the Evenki breed, two independent ecotypes, Tofalar and Todzha reindeer, have been identified (Kharzinova et al., 2015). The Tofalar reindeer, bred by the small indigenous ethnic group, Tofalars, are the largest of the domesticated reindeer. Currently, Tofalar reindeer husbandry numbers less than 100 heads, compared with several thousand in the 1990s, and the population of the Todzha reindeer, bred by Todzha-Tuvans, is less than 1,000 animals. The Tofalar and Todzha herds, which define the southern borders of reindeer husbandry, are the most isolated from other reindeer herds bred by the Indigenous Peoples. The reindeer husbandry of the Tofalars and that of the Todzha-Tuvans can be combined into one Sayan group of reindeer husbandry, based on their common characteristics. In Russia, along with domesticated reindeer, there are many wild herds, whose ranges cover almost the entire tundra, forest-tundra and taiga zones, including mountainous areas. Depending on the habitat of wild reindeer, several ecological forms (macro-ecotypes) are distinguished, namely island (inhabiting arctic deserts), tundra (migrating to the forest-tundra for the winter), taiga and mountain-taiga (carrying out vertical migrations) (Davydov et al., 2007). The most significant differences in size are observed between the tundra and taiga forms of reindeer. As a rule, forest reindeer are more long-legged animals, with elongated body. However, the intraspecific taxonomy of Rangifer tarandus L. is still controversial and needs to be specified using molecular genetic markers.
On the territory of Eurasia, several subspecies of wild reindeer are distinguished (Danilkin, 1999). The Svalbard reindeer (R. tarandus platyrhynchus) is a non-migratory tundra subspecies inhabiting the high-arctic archipelago of Svalbard. The Novaya Zemlya reindeer (R. tarandus pearsoni) is an island subspecies living only on the northern island of the Novaya Zemlya archipelago. The European reindeer (R. tarandus tarandus) is a subspecies that lives in the European part of Eurasia in the tundra and northern taiga regions up to the Ural Mountains. The Siberian reindeer (R. tarandus sibiricus) is a subspecies that lives in tundra and partly forest-tundra zones of Siberia (from the Ural Mountains to the Lena River and Lake Baikal). Finally, the Okhotsk reindeer (R. tarandus phylarchus) is a subspecies inhabiting the coast of the Sea of Okhotsk, the Amur River basin, the northern part of Sikhote-Alin, the Kamchatka peninsula and Sakhalin Island (from the Lena River and Lake Baikal to the Sea of Okhotsk). These geographic subspecies differ in the body type, increasing in size with the transition of the habitat from west to east, but genetic and phenotypic variabilities and differences in subspecies have been insufficiently studied.
It is worth noting that the bulk of the wild reindeer populations (~85%) is concentrated in the Taymyr Peninsula, northern Yakutia, and the central part of Chukotka (Kharzinova et al., 2018; Kolpaschikov, Makhailov, & Russell, 2015). The Taymyr herd of wild reindeer is the largest and most monitored wild reindeer population in Eurasia, inhabiting a vast area in the north of central Siberia (Kolpaschikov et al., 2015; Petrov, Pestereva, Kolpashchikov, & Mikhailov, 2012). Three large, relatively isolated herds of wild reindeer are found in the continental tundra of Yakutia, namely Yana-Indigirka, Sundrun (Indigirka-Kolyma) and Lena-Olenek (Bulun) (Safronov, 1996). In addition, there are sedentary taiga reindeer populations, distributed primarily in the mountains of the south and west Yakutia. In recent years, a difficult demographic situation has developed with the populations of wild reindeer on the Kola Peninsula (Baranova, Panchenko, Kholodova, Tirronen, & Danilov, 2016). The main direct cause of the decline in these populations is poaching, while forest fires and deforestation, leading to the depletion of food resources, are considered indirect causes. Wild reindeer of the Murmansk region of the Russian Federation (the Kola Peninsula) are endangered and listed in the latest Red Data Book of Murmansk Region (Konstantinova, Koryakin, Makarova, & Bianki, 2014). On the contrary, the number of wild reindeer in the Magadan region is growing thanks to constant monitoring and restrictions on poaching.
Wild and domesticated reindeer have distinct craniological parameters and differ genetically according to results obtained by various methods of biochemical genetics (Kharzinova et al., 2017). DNA markers are the most popular tool for studying genetic diversity of reindeer populations. The analysis of mitochondrial DNA polymorphism is widely used in phylogenetic studies (Davydov et al., 2007; Flagstad & Røed, 2003; Røed et al., 2020; Wang et al., 2019). Microsatellite markers are widespread for studying the genetic structure and allelic pools of individuals, as well as for their identification and differentiation (Jepsen, Siegismund, & Fredholm, 2002; Kharzinova et al., 2016; Mcdevitt et al., 2009; Mcloughlin, Paetkau, Duda, & Boutin, 2004; Røed & Midthjell, 1998; Stolpovsky et al., 2020; Zhai, Liu, Yin, Xia, & Li, 2017). With the development of high-throughput SNP genotyping platforms, SNP markers are getting more popular in animal agriculture. Although SNP platforms are becoming available for genomic research in reindeer, they are not cost-effective for genotyping several hundred animals.
This study aimed to identify genetic diversity among poorly examined wild reindeer populations and genetic differences between wild and coexisting domesticated reindeer living in different eco-climatic zones using microsatellite data.
|
Breed |
Predominant pelage colour |
Animal physique |
Live weight of males before rut (♂) and females (♀) [kg] |
Slaughter yield of live weight [%] |
|
Chukchi |
Dark brown |
Short height, squat, wide and at the same time elongated body, short limbs, well-developed skeleton and musculature. |
♂: 125-130 ♀: 93-96 |
~51-55 |
|
Nenets |
Brown and dark brown |
Medium height, rather long and wide body, well-developed skeleton, relatively wide head. |
♂: 130-135 ♀: 90-95 |
~50 |
|
Evenki |
Light brown and grey of various shades |
Tall height, rather long body, deep chest, well-developed skeleton and musculature |
♂:140-175 ♀: 108-120 |
~49 |
|
Evens |
Light brown and grey colour of various shades |
Tall height, long body, a narrow deep chest, narrow long pelvis, well-developed skeleton, narrow long head. |
♂: 130-140 ♀:91-103 |
~49-51 |
Materials and methods
Animal sample information
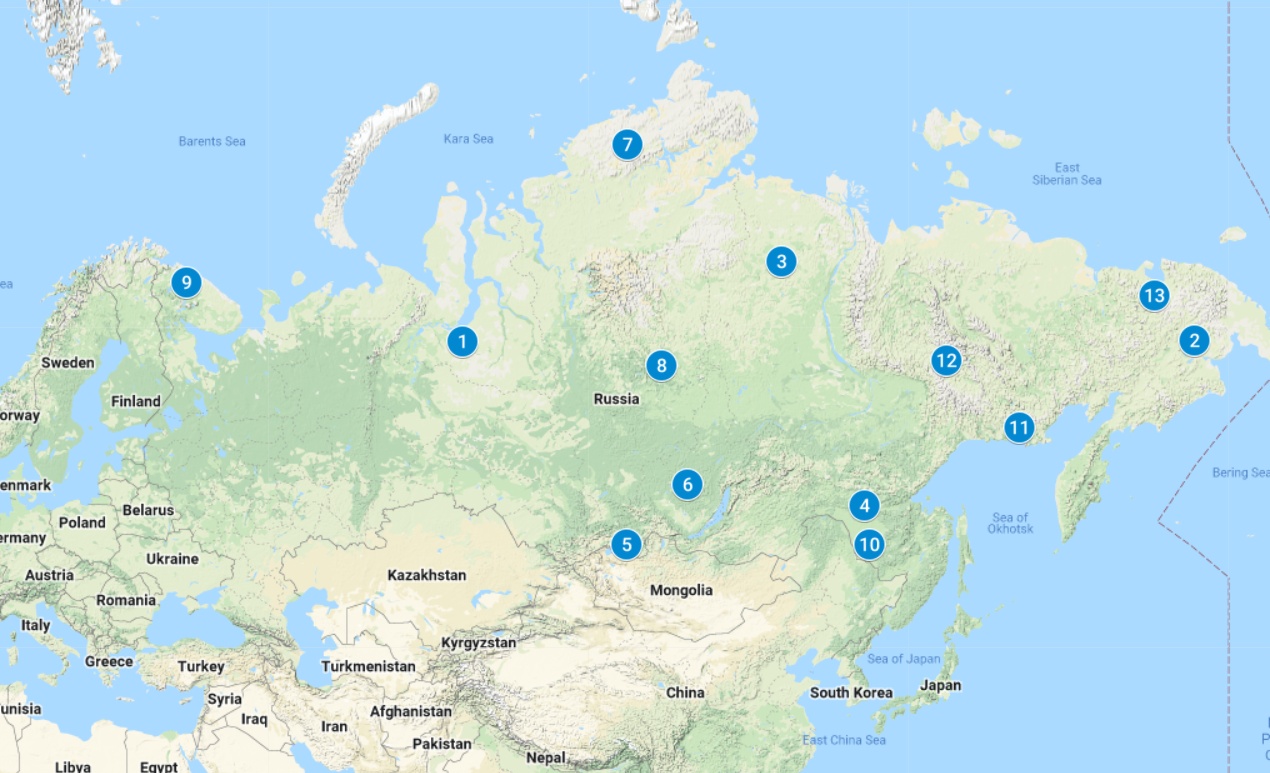
Initially, 790 animals were collected, which were selected from all breeds registered in Russia (Nenets, Evens, Evenki and Chukchi), including two ecotypes (Tofalar and Todzha reindeer), as well as from seven wild populations of Magadan, Amur, Taymyr, Yakutia, Tura, Murmansk and Chukotka regions (Figure 1 and Supplemental Table S1). For the study of domesticated reindeer, we selected clinically healthy animals according to phenotypic traits corresponding to their breeds. The age of the selected animals varied from 3 to 7 years. Special attention was paid to calving females, since only females with a good conformation, regularly bearing healthy calves and capable of raising strong offspring, should be selected for further reproduction. For females, the presence of a calf was determined by the condition of the udder and by interviewing reindeer herders. Males were selected in August-September, and females were selected in October-November, i.e. during periods of their maximum fatness. For the study of wild reindeer, we used the biological material from animals that were obtained from hunters. As biological material, pieces of the cartilaginous part of the horn or auricle were taken, which were placed in test tubes and fixed with ethanol (96%). A total of 13 population samples were tested. It is worth noting that the sample of Nenets reindeer breed combined three subsamples taken from different breeding regions, since no significant genetic differences have been found between these subsamples (Stolpovsky et al., 2020).
DNA extraction and microsatellite genotyping
Animals were genotyped using 16 polymorphic microsatellite markers (BMS1788, BMS745, C143, C217, C276, C32, FCB193, NVHRT16, OHEQ, RT1, RT24, RT30, RT6, RT7, RT9 and T40). The description of microsatellites is given in Supplemental Table S2. DNA was extracted from velvet antlers, muscles, skin, and ear notches using the COrDIS SPRINT PCR compatible reagent kit (OOO Gordiz Moscow, Russia, https://gordiz.ru/en/products/animal-kits/cordis-rangifer/) according to the protocol of the manufacturer. PCR was performed using Applied Biosystems thermal cyclers under the conditions recommended by the manufacturer of the used reagent kit. Separation of PCR products was carried out by capillary electrophoresis using an ABI 3130 automatic genetic analyzer (Applied Biosystems). Data analysis and determination of allele variants in the specimens for each locus were performed using the GeneMapper ID-X 1.4 software (Applied Biosystems). The genotyping quality was controlled using a standard specimen supplied as part of the reagent kit.
For each animal, the genotypes of microsatellites were obtained as the allelic lengths in base pairs. The used multiplex short tandem repeat (STR) panel consisted of ten dinucleotide loci (Rt6, BMS1788, Rt30, Rt1, Rt9, Rt7, Rt24, FCB193, BMS745 and NVHRT16) and six tetranucleotide STR markers (OHEQ, C217, C32, Т40, C276 and C143). Of these, ten loci have been described for caribou: NVHRT16, BMS745, FCB193, OHEQ, BMS1788, RT6, RT24, RT30, RT9, RT1 and RT7 (Yannic et al., 2014), and other six loci have been described for North American subspecies of red deer: C32, C143, C276, T40 and C217 (Jones, Levine, & Banks, 2002) (Meredith, Rodzen, Levine, & Banks, 2005) . This panel has recently been tested on reindeer (Dodokhov, Pavlova, Rumyantseva, & Kalashnikov, 2021; Stolpovsky et al., 2020).
Statistical analysis
The minimum number of markers needed to discriminate between animals was estimated using the genotype_curve() function with 50,000 replicates from the poppr R package (Kamvar, Tabima, & Grünwald, 2014). In each population sample, the individuals with duplicated genotypes were removed using the clonecorrect() function from the same package. Linkage disequilibrium between loci was assessed using the pair.ia() function with 50,000 replicates from the same package. Testing the departure from Hardy–Weinberg equilibrium (HWE) was performed using the hw.test function from the pegas R package (Paradis, 2010). Here we applied two tests: the classical c2-test based on the expected genotype frequencies calculated from the allelic frequencies, and an exact test based on Monte Carlo permutations of alleles (with 50,000 replicates). To control the false discovery rate, the p-values of both HWE tests were adjusted using the p.adjust R function with the option method=‘fdr’ (Benjamini & Hochberg, 1995). The main population genetic statistics for each reindeer sample were computed in the adegenet R package (Jombart, 2008). Allele frequencies, allelic richness and the number of private alleles were assessed by the PopGenReport R package. Polymorphism information content was estimated using the polysat R package (Clark & Jasieniuk, 2011). For each ‘locus-population’ pair, fixation index and the observed and expected heterozygosity were estimated using the divBasic() function from the the diveRsity R package (Keenan, Mcginnity, Cross, Crozier, & Prodöhl, 2013). Nei’s pairwise Fst and corresponding p-values were obtained by the pairwise.fst() function from the hierfstat R package (Goudet, 2005) and visualized by the corrplot R package (Wei et al., 2017). Fit, Fst and Fis for each locus were calculated using the Fst() function from the pegas R package. The Bayesian clustering approach implemented in the STRUCTURE v.2.3.4 programme (Pritchard, Stephens, & Donnelly, 2000) was used to study population differentiation. The optimal number of clusters was determined by the method proposed by (Evanno, Regnaut, & Goudet, 2005) and implemented in the Structure Harvester and Clumpak programs (Earl, 2012; Kopelman, Mayzel, Jakobsson, Rosenberg, & Mayrose, 2015). The dendrogram based on Nei’s genetic distances was constructed by the neighbour-joining algorithm implemented in the poppr R package, with bootstrap support from 5,000 replicates. Isolation by distance was assessed by regressing pairwise genetic distance against the natural logarithm of geographical distance (km) with the Mantel test (Mantel, 1967) with 10,000 permutations using the ade4 R package (Dray & Dufour, 2007). Slatkin’s linearized Fst was adopted as the measure of genetic distance (Rousset, 1997). The geographic centre of allelic richness among the studied populations was calculated as the weighted midpoint from a series of latitude/longitude coordinates by a method that converts longitude/latitude coordinates (in radians) to a 3D Cartesian coordinate system (x, y, z): x = cos(lat) cos(lon), y = cos(lat) sin(lon) and z = sin(lat). This method then calculates the weighted means of these coordinates ( ) and converts them back to longitude/latitude coordinates using the formulas: and , where atan2 is a function defined as the angle in the Euclidean plane.
Results
Data quality checks
Initially, 790 individuals were genotyped at 16 loci. To ensure that we had enough information to accurately identify multilocus genotypes, we estimated the minimum number of loci needed to discriminate between animals to be 15 markers and determined the presence of clones. According to the results, four individuals genotyped by less than 15 microsatellites and six individuals with duplicated genotypes were removed from further analyses. Linkage disequilibrium between loci was assessed using the standardized index of association, rd (Agapow & Burt, 2001), which corrects for sample size; rd between loci was not high and varied from -0.019 to 0.072. A significant deviation from HWE was detected by both HWE tests considered here only in the sample of wild Yakut reindeer at the C276 locus (Supplemental Tables S3–S5). Since deviation from HWE is most often associated with genotyping errors, we had to exclude C276 from the data for the wild Yakut sample. Thus, the final dataset included 780 individuals.
Genetic variability
For the 16 microsatellites analyzed, a total of 236 alleles were found, with 3 (C143 and C217) to 30 (OHEQ) alleles per marker. The mean number of alleles per marker across all samples was 14.8. The average percentage of the total number of alleles observed per marker varied from 40.94% (domestic Tofalar reindeer) to 81.8% (wild Yakut reindeer) (Table 2). Detailed results for each marker and reindeer population studied are available in Supplemental Table S6.
|
Domestic form |
Size |
N |
A |
% |
Ar |
Ho |
He |
Fis |
IC (se) |
|
Nenets |
224 |
223.88 |
132 |
60.94 |
4.31 |
0.64 |
0.66 |
3.03E-02 |
0.167(0.017) |
|
Todzha |
42 |
42 |
89 |
46.66 |
3.77 |
0.64 |
0.62 |
-3.23E-02 |
0.171(0.043) |
|
Tofalar |
47 |
46.94 |
77 |
40.94 |
3.31 |
0.57 |
0.56 |
-1.79E-02 |
0.182(0.039) |
|
Evens |
44 |
43.56 |
130 |
60.98 |
4.78 |
0.73 |
0.73 |
0.00E+00 |
0.152(0.040) |
|
Evenki |
50 |
50 |
113 |
52.96 |
4.27 |
0.67 |
0.68 |
1.47E-02 |
0.165(0.041) |
|
Chukchi |
118 |
118 |
131 |
58.87 |
4.43 |
0.7 |
0.7 |
0.00E+00 |
0.156(0.023) |
|
Wild form |
|
|
|
|
|
|
|
|
|
|
W.Taym |
21 |
21 |
142 |
65.88 |
5.34 |
0.77 |
0.76 |
-1.32E-02 |
0.130(0.047) |
|
W.Tura |
12 |
11.81 |
115 |
54.12 |
5.01 |
0.73 |
0.75 |
2.67E-02 |
0.138(0.048) |
|
W.Murm |
29 |
28.94 |
124 |
57.44 |
4.83 |
0.7 |
0.71 |
1.41E-02 |
0.161(0.053) |
|
W.Amur |
20 |
20 |
111 |
52.76 |
4.53 |
0.71 |
0.7 |
-1.43E-02 |
0.154(0.058) |
|
W.Magad |
6 |
6 |
89 |
43.31 |
4.44 |
0.71 |
0.68 |
-4.41E-02 |
0.134(0.075) |
|
W.Yakut |
126 |
118.12 |
193 |
81.8 |
5.27 |
0.74 |
0.77 |
3.90E-02 |
0.151(0.024) |
|
W.Chuk |
41 |
41 |
163 |
73.89 |
5.38 |
0.74 |
0.76 |
2.63E-02 |
0.154(0.043) |
In all studied samples of reindeer, we found alleles with high frequency (AF) (AF > 0.7). In particular, C217.215, T40.302, C32.330 and C143.180 had the highest frequencies. The polymorphism information content (PIC) values were calculated for each combination ‘sample-locus’ (Supplemental Table S7). The highest polymorphism levels were found for pairs ‘W.Yakut–OHEQ’ (PIC = 0.920), ‘W.Taym–BMS1788’ (PIC = 0.915) and ‘W.Yakut–BMS1788’ (PIC = 0.911). The mean PIC value over loci and samples appeared to be rather high, 0.71 ± 0.05.
Out of 236 alleles in 780 reindeer genotyped, 16 alleles were private alleles with allelic counts ≥ 2 and AF > 0.008 (Table 3). The largest number of private alleles per marker (3) was detected for BMS1788 and OHEQ, and the largest numbers of private alleles adjusted for sample size were in the wild Chukchi herd and Todzha ecotype (24.4% and 14.4%, respectively of their total numbers). The presence of private alleles with frequencies above 0.01 in the wild herds suggests that each of these herds most likely has a unique genepool (Svishcheva et al., 2020). In total, private alleles were found in four wild reindeer herds and two domesticated ones (Table 3).
|
Sample |
Locus |
Allele size [bp] |
Allelic Frequency |
Allelic count |
|
W.Yakut |
RT6 |
168 |
0.036 |
9 |
|
W.Yakut |
OHEQ |
302 |
0.024 |
6 |
|
W.Yakut |
RT24 |
260 |
0.02 |
5 |
|
W.Yakut |
RT24 |
262 |
0.02 |
5 |
|
W.Yakut |
BMS1788 |
162 |
0.008 |
2 |
|
W.Yakut |
C32 |
314 |
0.008 |
2 |
|
W.Taym |
T40 |
335 |
0.045 |
2 |
|
W.Murm |
OHEQ |
268 |
0.052 |
3 |
|
W.Chuk |
RT7 |
262 |
0.122 |
10 |
|
W.Chuk |
FCB193 |
124 |
0.049 |
4 |
|
W.Chuk |
BMS1788 |
176 |
0.024 |
2 |
|
W.Chuk |
FCB193 |
120 |
0.024 |
2 |
|
Todzha |
BMS745 |
131 |
0.071 |
6 |
|
Todzha |
OHEQ |
322 |
0.024 |
2 |
|
Chukchi |
RT6 |
192 |
0.042 |
10 |
|
Chukchi |
BMS1788 |
166 |
0.008 |
2 |
In each sample of animals, we evaluated genetic variability in terms of the number of alleles (A), allelic richness (Ar), observed (Ho) and expected (He) heterozygosity, and fixation index (Fis) (Table 2 and Supplemental Table S6). Ar ranged from 3.29 (Tofalar herd) to 5.39 (wild Yakut herd) with a mean of 4.60 ± 0.17. Overall, we found a significant correlation between Ar and He (R2 = 0.96, p-value = 2.92 × 10⁻⁹). The highest Ho value (0.77) corresponded to the wild Taymyr herd and the lowest (0.57) to the Tofalar herd. For each sample, we computed Fis as (He-Ho)/He. For Evens and Chukchi breeds the Fis values were equal to zero, while for other samples, we observed a slight deficiency and excess of microsatellite heterozygotes. The mean Fis value in the pooled sample was 0.0023 ± 0.0071.
Pairwise Fst values
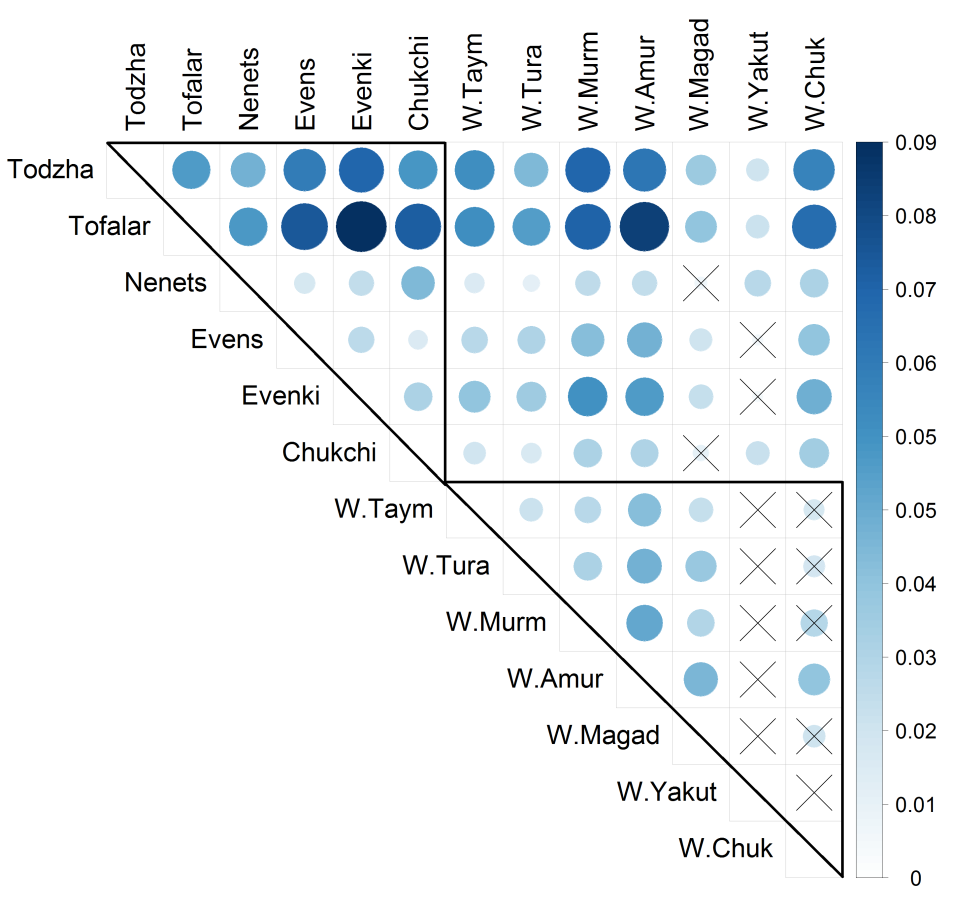
To assess the levels of genetic differentiation between the populations over all microsatellites, Nei’s pairwise Fst values were computed (Figure 2, Supplemental Table S8). According to a 5% significance level, the wild reindeer samples, except for ‘W.Yakut’ and ‘W.Chuk’, were genetically differentiated. The wild reindeer from Chukotka differed only from the Amur wild population sample, and the wild reindeer from Yakutia were genetically similar to all sampled wild reindeer populations. When comparing only domesticated reindeer, we found stronger genetic differentiation relative to each other (all p-values < 0.03) than in group of wild reindeer. When comparing wild and domestic forms, we found significant differences (p-values < 0.05) for most (38 out of 42) pairs of populations, except for the pairs ‘W.Magad'–'Nenets’, ‘W.Magad'–'Chukchi’, ‘W.Yakut'–'Evens’ and ‘W.Yakut'–'Evenki’. The Tofalar and Todzha samples were the most distant from all other breeds and from each other (all p-values < 0.03).
Wright’s F statistics for each locus
For 16 loci, the overall inbreeding coefficient (Fit) varied from 0.0411 to 0.2296 (Table 4) with a mean of 0.0077. The highest Fit value reflecting a heterozygosity deficiency corresponded to marker C143, likely due to the small number of alleles at this locus (Cornuet & Luikart, 1996). The inbreeding coefficient, Fis, ranged from -0.0388 to 0.0977 with a mean of 0.0188, and the fixation index, Fst, ranged from 0.0486 to 0.1462 with a mean of 0.0808. Based on Fst, all loci (especially C143, RT30 and RT6) contributed to the differentiation between the herds.
|
Locus |
Number of alleles |
Fit |
Fst |
Fis |
|
BMS1788 |
28 |
0.109 |
0.078 |
0.034 |
|
BMS745 |
13 |
0.071 |
0.049 |
0.023 |
|
C143 |
3 |
0.23 |
0.146 |
0.098 |
|
C217 |
3 |
0.041 |
0.077 |
-0.039 |
|
C276 |
8 |
0.085 |
0.066 |
0.021 |
|
C32 |
9 |
0.118 |
0.085 |
0.037 |
|
FCB193 |
15 |
0.099 |
0.081 |
0.019 |
|
NVHRT16 |
13 |
0.047 |
0.052 |
-0.005 |
|
OHEQ |
30 |
0.078 |
0.077 |
0.001 |
|
RT1 |
17 |
0.072 |
0.074 |
-0.002 |
|
RT24 |
17 |
0.117 |
0.084 |
0.037 |
|
RT30 |
15 |
0.163 |
0.131 |
0.037 |
|
RT6 |
17 |
0.087 |
0.091 |
-0.004 |
|
RT7 |
14 |
0.055 |
0.074 |
-0.02 |
|
RT9 |
14 |
0.081 |
0.08 |
0.001 |
|
T40 |
20 |
0.11 |
0.049 |
0.065 |
Bayesian clustering analysis
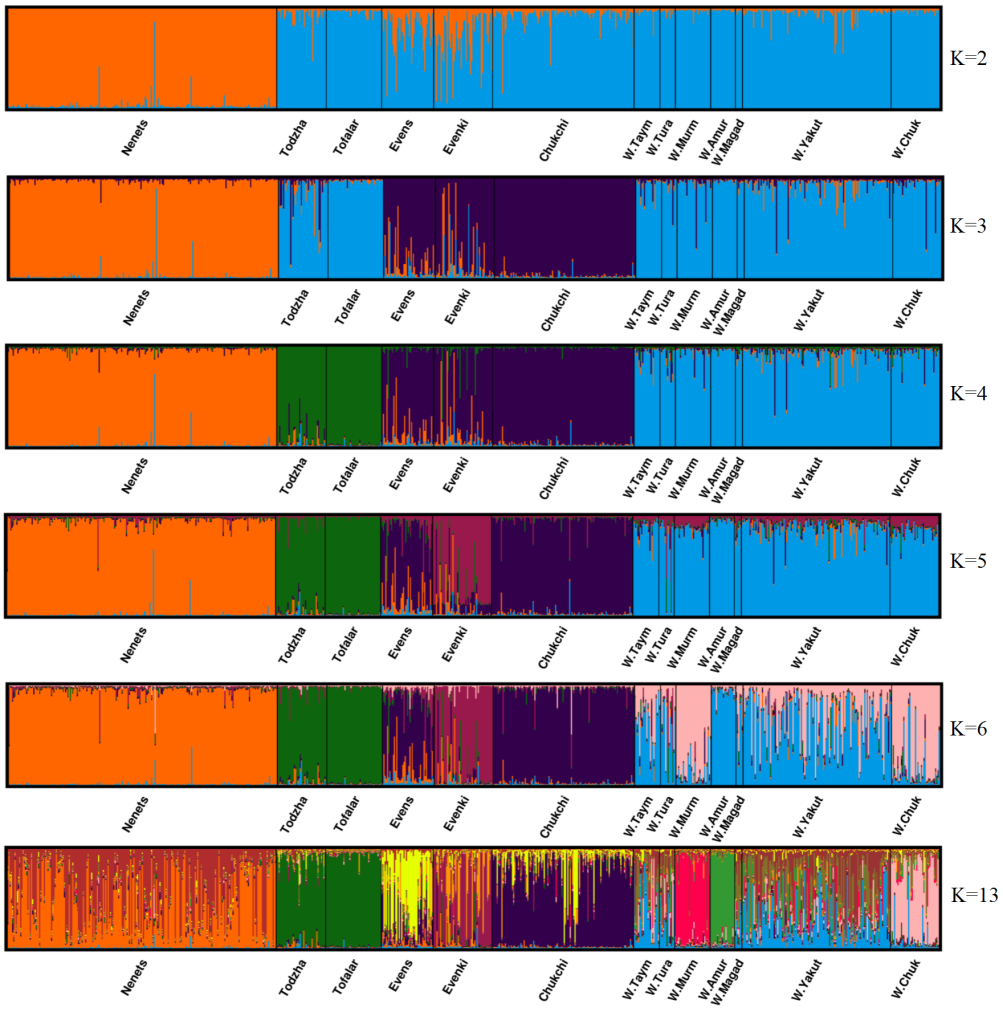
To infer the population structure, Bayesian clustering was carried out using the Markov chain Monte Carlo methods. We performed 50 runs for each number of clusters from 1 to 13. We selected an admixture model with correlated allele frequencies. To find the optimal number of clusters, we performed simulations of 1,000,000 iterations with a burn-in period of 100,000 generations. For each animal, the genetic origin was assessed as the proportion of genetic membership to each cluster. Based on the statistic DeltaK with values of 216.98, 2.58, 520.04, 2.97, 0.14 and 0.72 for K = 2-6 and K13, respectively, we found the optimal number of clusters, (K = 4, DeltaK = 520.04) (Figure 3). The first cluster consists only of the Nenets breed (red bars), the second one includes Tofalar and Todzha ecotypes (green bars), the third one (purple bars) comprises the remaining three breeds (Evens, Evenki and Chukchi), while the fourth cluster combines all wild reindeer. At K = 13, when the maximum proportion of a sample’s membership in any of these clusters (Pm) is above 75%, we acknowledge ‘pure ancestry’ (Svishcheva et al., 2020). Pure ancestry was thus detected at four population samples: Tofalar (92.5%), wild Amur (87%), Todzha (82%) and wild Murmansk reindeer (79%). Other samples were found to have mixed ancestry. The wild reindeer sample from Tura showed the lowest Pm values (< 20%).
Phylogenetic analysis
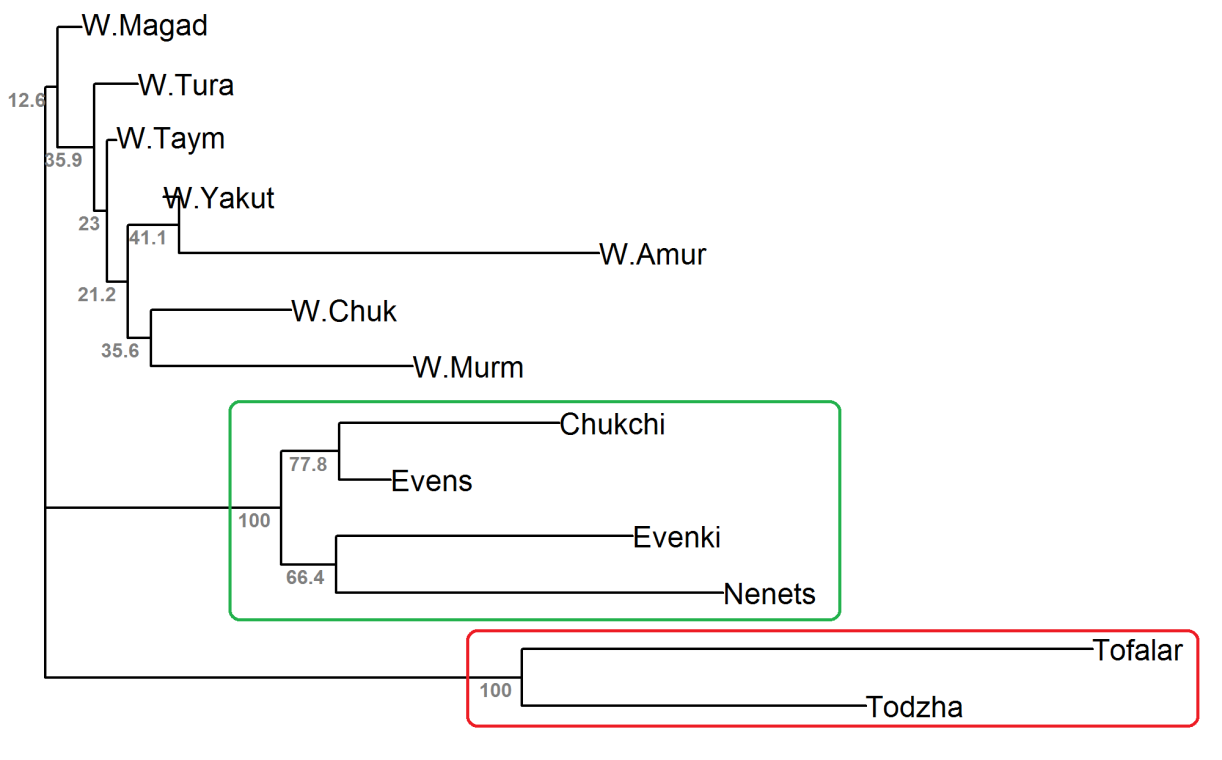
We reconstructed an unrooted phylogenetic tree by the neighbour-joining algorithm using Nei’s genetic distances (Figure 4). The domestic reindeer were grouped into two clusters with 100% bootstrap support (BS). The cluster highlighted in green contained only main breeds (BS = 100%), while the cluster highlighted in red included two ecotypes (BS = 100%). Among the wild populations, we did not identify any group (all BS < 45%).
Isolation by distance analysis and centre of allelic richness
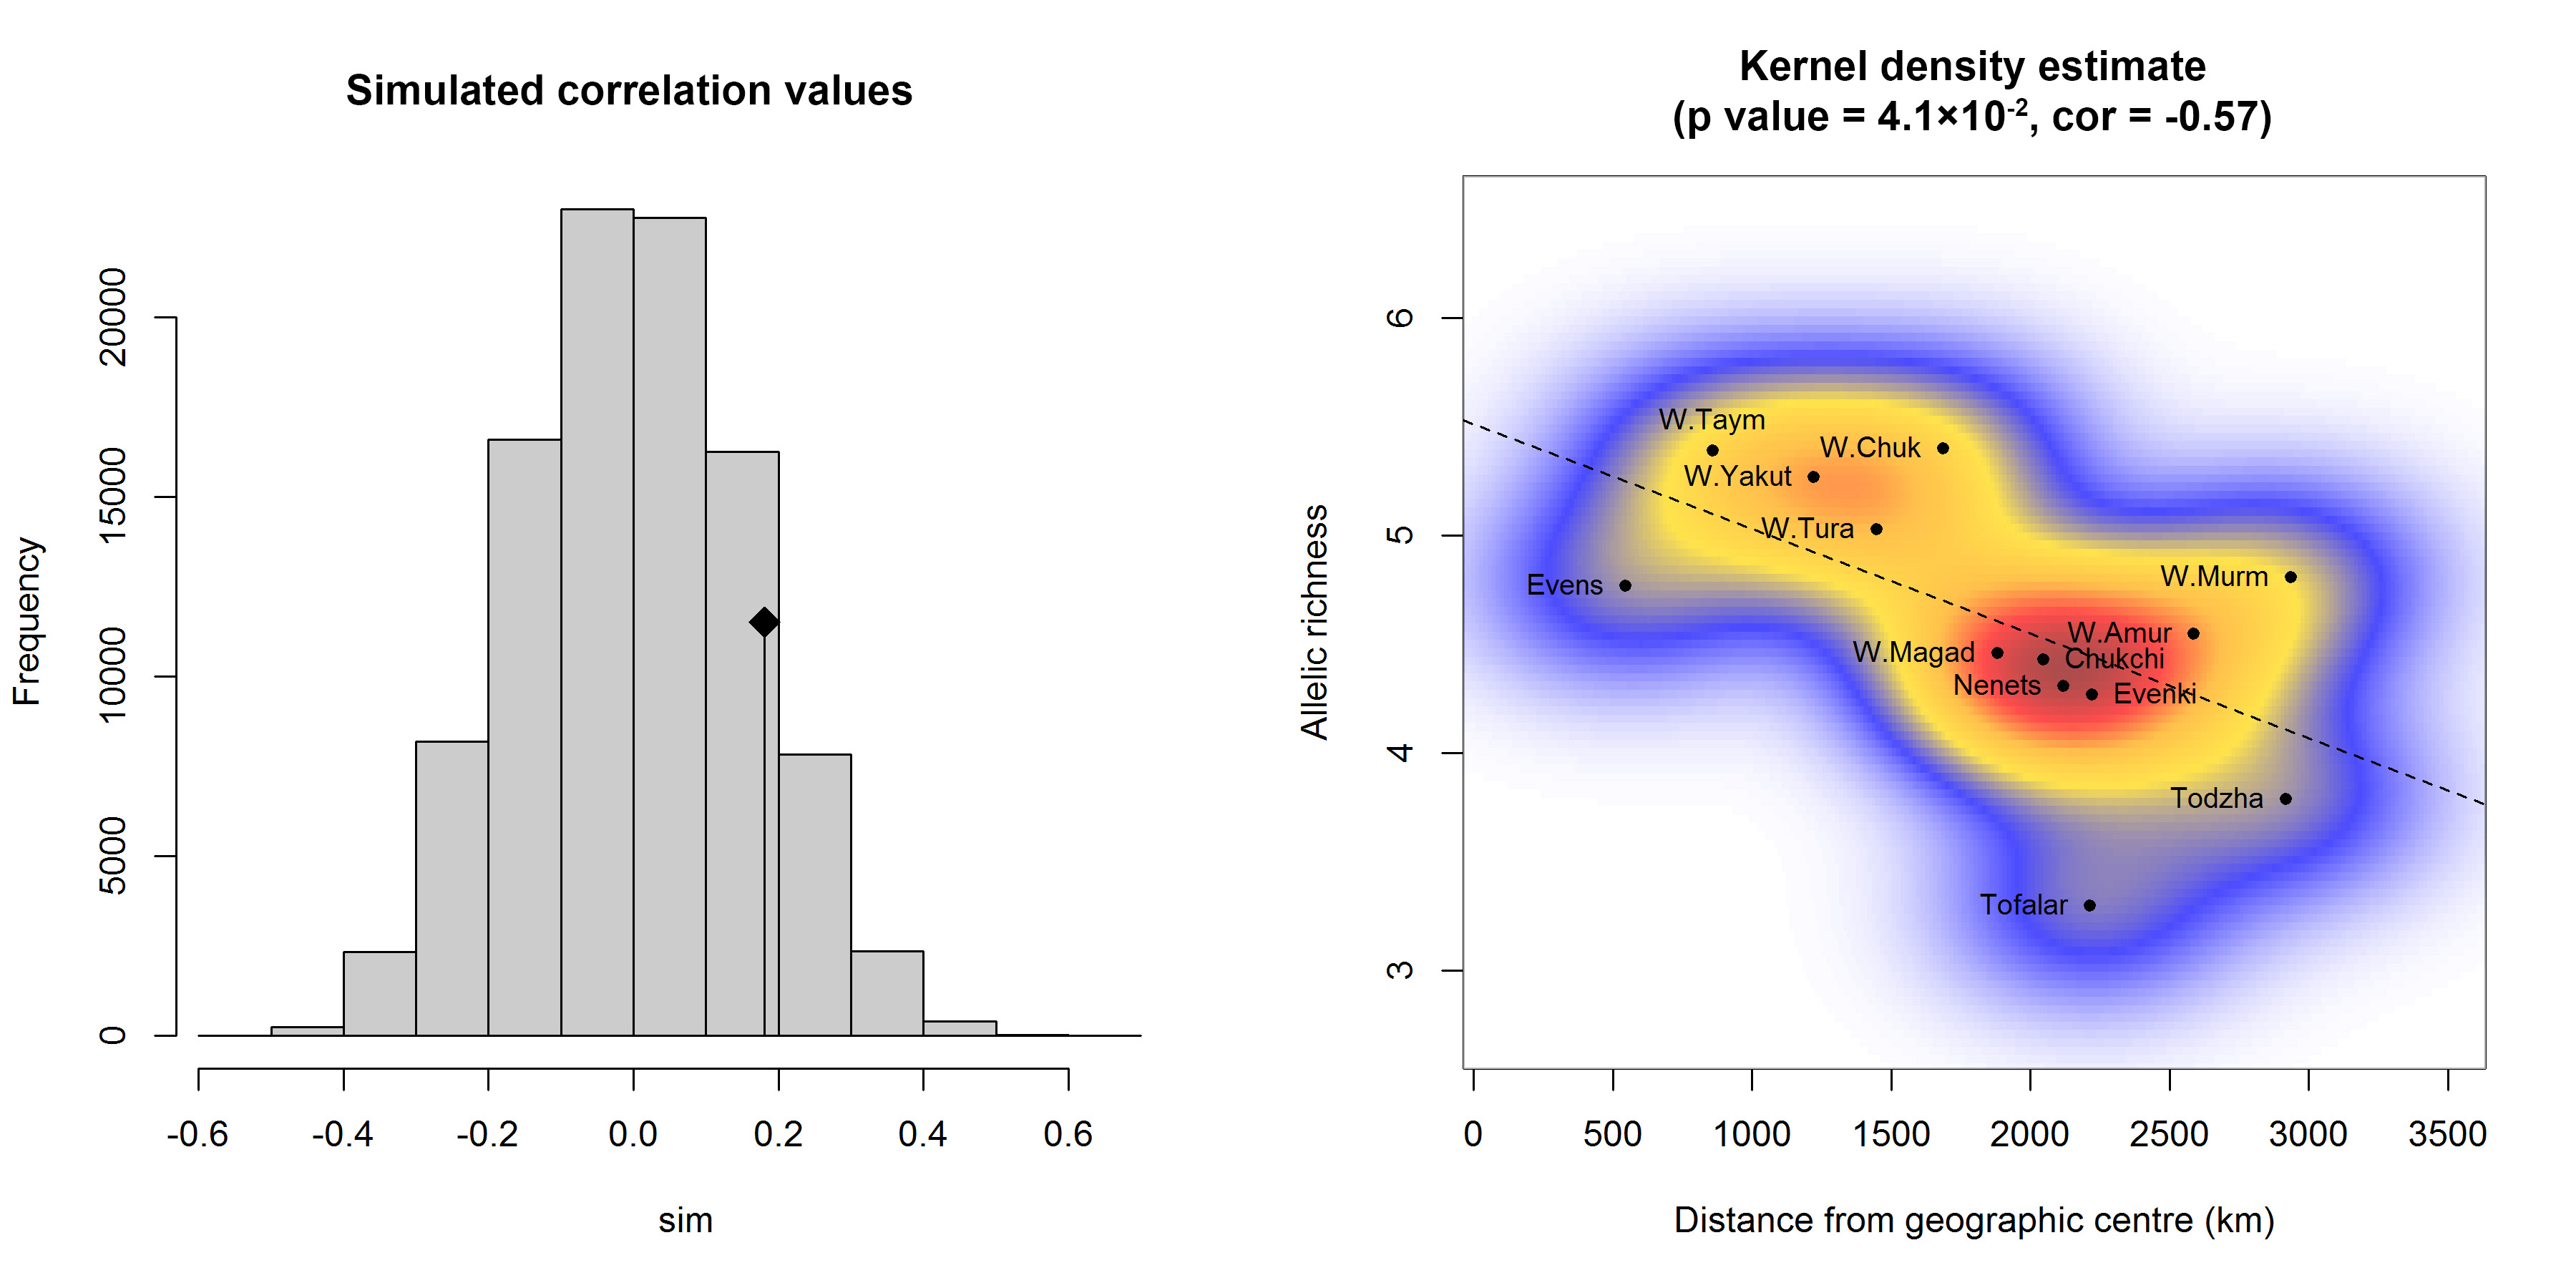
We performed an isolation-by-distance (IBD) analysis based on the Mantel test. The original value of the correlation between genetic distances, measured as pairwise Fst/(1−Fst), and geographic (Euclid) distances is represented by the black dot (Figure 5a), and the histogram describes the permuted values in the absence of spatial structure. Since the original value is inside the reference distribution, the spatial structure is non-significant (p-value = 0.135, R2 = 0.03). For the studied population samples, we theoretically determined the geographic region/centre of allelic diversity using their geographic coordinates as well as allelic richness and indices defining natural (climatic) zones as weights (see Supplemental Table S1). We estimated that this region is located in the north-western part of Yakutia (along the coast of the Laptev Sea), which is the core area of seasonal ranges and migration routes traditionally used by reindeer. We detected a significant negative correlation (cor = -0.57, p = 4.1×10⁻²) between the level of allelic richness in the population sample and the geographic distance from the sample to the theoretically calculated geographic centre (latitude ≈72°, longitude ≈125°). Figure 5b demonstrates the distribution density of population samples plotted using a bivariate kernel density estimate.
Discussion
In recent years, a difficult demographic situation has developed in wild reindeer herds of some geographic regions of Eurasia due to the industrial development of the Arctic and adjacent territories, uncontrolled hunting, loss of grazing land and climatic changes (Kirpotin et al., 2021). A severe economic and cultural disruption has been observed in some herds of domesticated reindeer, such as Tofalar and Todzha ecotypes. These reindeer are bred by small Indigenous groups and mark the southern limits of reindeer husbandry. Although the reindeer is an extremely important species for the Indigenous Arctic ethnic groups living in the arctic and subarctic regions of Eurasia, information on the population structure of this species is limited. It is clear that genetic studies provide knowledge that can be useful in the conservation of genetic variation by identifying the intraspecific genetic structure and also in the management of wild hunting and poaching. The first step to this is to identify the population structure of this arctic species.
We studied the genetic structure of Rangifer tarandus L. from the Eurasian part of the range. Our study included 13 population samples of animals, covering most of the range, six of which were domesticated to varying degrees, and the remaining seven samples belong to the wild form of reindeer from tundra, taiga and mountainous nature zones. The studied samples from wild reindeer populations relate to the different subspecies according to (Danilkin, 1999). The Murmansk reindeer selected from the western part of the range, namely from the Kola Peninsula, belongs to a subspecies R. tarandus tarandus; the Taymyr and Tura reindeer selected from the central part of the range, namely from the Taymyr Peninsula and Central Siberian Plateau, belong to a subspecies R. tarandus sibiricus; the Amur, Magadan, Yakutia and Chukotka reindeer samples selected from the eastern part of the range belong to a subspecies R. tarandus phylarchus. All studied wild populations of reindeer differ in morphological features. Our population structure analysis used a newly developed panel of 16 polymorphic microsatellites with high polymorphism information content.
When analyzing allele content, we detected private alleles specific for four wild reindeer herds (‘W.Yakut’, ‘W.Taym’, ‘W.Murm’ and ‘W.Chuk’) and for two domesticated ones (‘Todzha’ and ‘Chukchi’), which suggests that each of these herds probably has formed a unique genepool under different (selection, geographical or feed) conditions. Besides, for the Todzha ecotype and the wild Murmansk reindeer, we found a high degree of ‘pure ancestry’, since the estimated maximum proportion of animal membership in these herds was 82.0% and 79%, respectively. Along with these two herds, we identified two more genetically homogeneous herds: the Tofalar ecotype (92.5%) and the wild Amur (87%) reindeer. For the Todzha and Tofalar samples, this is explained by a high degree of taming of reindeer due to taiga-specific (spatially limited) breeding and keeping conditions and, of course, indigenous traditions (Klokov, 2020). For the wild population samples from the Amur and Murmansk regions, ‘pure ancestry’ can be explained by their geographical remoteness from the crossings of major migration routes. By analyzing the heterozygosity and allelic richness, we suggest a comparatively low genetic variability in the Tofalar and Todzha ecotypes, whereas a high genetic variability was observed in the wild herds from the Taymyr, Chukotka and Yakut regions. This is due to the large population sizes and long-distance migration capability of the wild reindeer herds compared to domestic Tofalar and Todzha reindeer. It is interesting that according to the Fis index (Table 2), we observed no noticeable inbreeding in the studied populations. However, analysis of the distribution of inbreeding coefficients calculated for each animal, based on maximum likelihood method, showed comparably high inbreeding in the isolated samples of Todzha and Tofalar reindeer (Supplemental Table S9).
Results of Bayesian clustering analysis showed that all wild reindeer herds were clustered together. However, the samples of domesticated animals were distributed among the three clusters according to the degree of their domestication. As expected, the Todzha and Tofalar herds having the deepest level of taming, without seasonal migrations, formed a separate cluster, while the main breeds living in conditions of large herd formation, including long seasonal migrations (Stolpovsky et al., 2020), formed a cluster including only the Nenets breed and a cluster including the remaining breeds. The special genetic status of the domesticated Nenets reindeer is associated with the peculiarities of their historical formation (Dotsev et al., 2017) (Kharzinova et al., 2015). However, the phylogenetic analysis did not provide a high bootstrap support for joint clustering of wild herds and did not distinguish the Nenets breed from the rest, but confirmed the joint clustering of two ecotypes of reindeer, as well as the joint grouping of reindeer from three breeds (Evenki, Evens and Chukchi), adding to them the Nenets breed.
The analysis of paired Fst confirmed the population genetic differentiation between domestic and wild forms of the Eurasian reindeer, as well as the genetic structuring within each form (Figure 3). When comparing these two forms, we found significant differences only for 4 out of 42 pairs of populations. We suppose that for pairs ‘W.Magad’–‘Nenets’, ‘W.Magad’–‘Chukchi’ this can be attributed to the small size of the Magadan sample (n = 6) versus the large sample sizes of the Chukchi (n = 120) and Nenets breeds (n = 228). The genetic isolation of tame reindeer from wild ones living in the same geographic region is also worth mentioning. In particular, for the ‘W.Amur’–‘Evenki’ pair from the Stanovoy Range region and the ‘W.Chuk’–‘Chukchi’ pair from the Chukotka Mountains region we did not see the effect from an exchange of some individuals. The comparison of only the five population samples of the wild herds (‘W.Taym’, ‘W.Tura’, ‘W.Murm’, ‘W.Amur’ and ‘W.Magad’) showed that they are genetically differentiated from each other, but to a lesser extent than breed samples. The ‘W.Yakut’ sample has no genetic differences from all others, and ‘W.Chuk’ differs only from ‘W.Murm’ and ‘W.Amur’, which have characteristic feeding and behaviour patterns (Baskin, 1986). The wild reindeer from Yakutia and Chukotka belong to very large herds (with a high level of genetic diversity) that during seasonal migrations cover vast territories of the tundra and taiga. Probably, the exchange of genetic material between the wild reindeer herds takes place on overlapping migration routes. The population from Yakutia is especially distinguished in the group of samples of wild reindeer, which occupies the central part of the range relative to the studied populations, and has the maximum level of genetic diversity. We showed that the number of common alleles in ‘W. Yakut’ is about 82% of the total allelic diversity of the studied population samples, which significantly exceeds these indicators for the rest of the regional reindeer samples (Table 3). According to the results of our study, Yakutia is the centre of the allelic diversity of the genepool of the Rangifer tarandus L. species in the Eurasian part of the range. When comparing only the domestic herds, we found a higher level of genetic differentiation than among wild reindeer. This fact is consistent with an ecologically determined selection process that led to the emergence of divergent breeds in different geographic regions due to their different adaptability. In particular, the isolated samples of the Todzha and Tofalar herds showed the highest level of differentiation from all the breed samples (Fst = 0.019-0.091, p-values < 0.05), while a low but significant difference was observed between the Evens and Chukchi breed samples (Fst = 0.014, p-value < 0.05), which can be explained by the fact that the breeds have been created on the basis of the same constantly migrating natural populations of the eastern part of the reindeer range.
Although the IBD analysis did not reveal a spatial structure of the population samples, which may be associated with long-term seasonal migrations of animals, we theoretically determined the geographic region of allelic diversity for the studied group of population samples. As expected, this region is located in the north-western part of Yakutia: the coast of the Laptev Sea, where the major seasonal ranges and migration routes pass. The Yakutsk, Taymyr and Chukotka wild populations were the geographically closest to the centre of allelic diversity.
Among the factors that limit species distributions and effect on genetic structure, undoubtedly the last glacial maximum (LGM) has been the major force shaping reindeer geographic ranges in northern Eurasia. As it has been shown (Grosswald, 1999), in this part of the continent, exactly in the area of the Taymyr Peninsula, the LGM boundary has been discovered, extending to the northeast. However, the Laptev Sea region, which is part of West Beringia, has not been glaciated since at least the Tazov Glacial (Wetterich et al., 2011). Therefore, an eastern part of the species range has been significantly preserved. The species Rangifer tarandus L. has lived here both during the ice age and in the subsequent period of natural disasters caused by the melting of glaciers. The Pleistocene glaciation undoubtedly has influenced the genogeography of the species. This confirms the maximum genotypic diversity of reindeer in the eastern part of the range. From this region, resettlement has likely occurred throughout Eurasia range at the end of the LGM period. Long-term migrations have been inevitably accompanied by a loss of genetic diversity, a fact also known from studies of other species inhabiting this territory, for example, sable (Kashtanov et al., 2015).
Conclusion
Overall, statistical analysis of microsatellite data revealed a significant genetic differentiation between domestic and wild reindeer and confirmed population structures within each form. Our results highlight the importance of collecting microsatellite data from wild and domesticated reindeer in providing new insights into the genetic diversity and population structure of reindeer, which can help design strategies for genetic conservation and improvement as well as support resource use.
Author contributions
GRS: development of statistical methods, statistical analysis, interpretation of results, development of a concept, draft of the work, writing of the manuscript, final approval of the manuscript; SNK: interpretation of results, writing of the manuscript, final approval of the manuscript; OVB: microsatellite analysis, final approval of the manuscript; TPS: collecting of biological material, discussion of the results, final approval of the manuscript; MTS: DNA extracting; MVK: collecting of biological material, discussion of the results, final approval of the manuscript; YAS: development of a concept, draft of the work, collecting of biological material, interpretation of results, writing of the manuscript, final approval of the manuscript.
Funding
This research was supported by RSF grant no. 22-16-00062.
Conflict of interest statement
The authors declare that the research was conducted in the absence of any commercial or financial relationships that could be construed as a potential conflict of interest.
Ethics statement
All experiments were approved by the Local Ethics Committee of the Vavilov Institute of General Genetics of the Russian Academy of Sciences, Russia. The animal use procedures were carried out in accordance with the national veterinary guidelines.
Data accessibility
Microsatellite genotyping data was deposited in Zenodo: 10.5281/zenodo.6376769.
Supplemental data
Supplemental Table S1. Characteristics and geographic locations of the analyzed population samples of reindeer
Supplemental Table S2. Description of microsatellite markers
Supplemental Table S3. P-values of the Hardy–Weinberg equilibrium test with the FRD-based correction for each combination of sample and locus
Supplemental Table S4. P-values of the Hardy–Weinberg equilibrium test for each locus
Supplemental Table S5. The proportions of loci that are out of HWE for each population
Supplemental Table S6. Population parameters calculated for each locus and each population sample.
Supplemental Table S7. The polymorphism information content values for each combination of sample and locus
Supplemental Table S8. Nei’s pairwise Fst values among samples.
Supplemental Table S9. The distribution of maximum-likelihood-based estimates of inbreeding coefficients