Phenomic characterization of Crotalaria germplasm in Embrapa’s genebank, Brazil
João Marcelo Machado Squarisia, Mariane Rodrigues Ferreirab, Juaci Vitoria Malaquiasb, Allan Kardec Braga Ramosb, Claudio Takao Kariab, Gustavo Jose Bragab, Marcelo Ayres Carvalhob,*
a UniCeub, Campus da Asa Norte: SEPN 707/907 - Campus Universitário, Brazil
b Embrapa Cerrados, BR 020, km 18, Planaltina-DF, ZIP 73310-970, Brazil
* Corresponding author: Marcelo Ayres Carvalho (marcelo.ayres@embrapa.br)
Abstract: This study aimed to evaluate the morphological diversity of 22 Crotalaria accessions conserved in the Embrapa Cerrados germplasm bank, Brazil, with emphasis on their potential use in breeding and genetic resource management. Sixteen morphological descriptors were analyzed, revealing substantial phenotypic variation among accessions. Plant height ranged from 45 to 146cm, and leaflet and seed traits also showed broad variation, reflecting a wide adaptive spectrum. The Shannon–Weaver (H) and Simpson (D) diversity indices indicated consistently high diversity across traits (mean H = 0.964; mean D = 0.940), confirming the existence of a rich genetic base within the collection. Principal component analysis showed that the first two components explained 63.72% of total variance, with reproductive traits such as seed length, seed width, and 100-seed weight contributing most to variation among accessions. Cluster analysis grouped the accessions into five distinct morphological clusters, identifying genotypes with superior plant vigour, leaf area, or seed characteristics as potential parents for future breeding programmes. The observed morphological variability highlights the significant genetic diversity within Crotalaria germplasm, supporting its value for selection, hybridization and conservation. The combination of diversity indices and multivariate analyses provides a robust framework for identifying promising accessions for breeding programmes targeting biomass production, seed yield and environmental adaptation. These findings reinforce the importance of maintaining and characterizing germplasm collections as strategic reservoirs for sustainable crop improvement and the long-term conservation of genetic resources.
Keywords: Tropical legume, genetic resources, genetic diversity, morphology, cluster analysis
Introduction
The use of legumes in sustainable agricultural production systems has been widely recommended due to their ability to fix atmospheric nitrogen, produce high biomass, and promote physical, chemical and biological soil improvements. Among these legumes, the genus Crotalaria (Fabaceae) has stood out due to its hardiness, adaptation to tropical regions, and high potential for use as a cover crop and green manure (Daimon, 2006).
Studies by Koudahe et al (2022), Silva et al (2019) and Arone et al (2024) highlight the strategic role of Crotalaria in agroecological systems focused on the sustainability of tropical soils, especially due to its efficiency in nutrient cycling, restoration of degraded areas, and ecological multifunctionality.
The genus Crotalaria comprises over 300 species, some of which are popularly known as ’rattlepod‘ due to the characteristic rattling sound their mature seeds make inside their dry pods (Polhill, 1968). These fast-growing plants are widely used in agricultural systems, performing various ecological functions, such as green manure through biological nitrogen fixation (BNF), carbon fixation, nutrient cycling, nematode control, and attracting pollinating insects (Muller-Salmann and Kotschi, 1994). Despite this agricultural potential, which can be utilized in a variety of ways, there is still little information available on the genetic diversity stored in biological collections of the species. These genetic resources are extremely important for the selection and development of new cultivars for agricultural use.
Crotalaria species are mostly annual herbaceous plants, with some perennial or shrubby species. They have erect stems, which can reach 0.5 to 3 metres in height, with variable branching and the presence of trichomes, giving the plant a pubescent appearance (National Research Council, 1979). The leaves are alternate, simple (as in C. juncea) or trifoliate, and vary in shape from lanceolate to elliptical (Devecchi et al, 2014).
The root system is taproot-like, with a deep, well-developed taproot, accompanied by a vigorous secondary root system (Bolleddu et al, 2023). This morphological characteristic favours nutrient absorption at depth, improves soil porosity, and contributes to soil decompaction (Lanna et al, 2021). The flowers are papilionate, usually yellow, and arranged on terminal branches. The fruits are legume-like, with several seeds that produce a characteristic sound when dry, giving rise to the common name ‘rattlepods’ (Muli et al, 2025).
The conservation and characterization of genetic resources, both in situ and ex situ, is strategic to ensure the functional resilience of the genus in the face of climate change and agricultural intensification. National and international germplasm banks, such as those of Embrapa Cerrados, the International Livestock Research Institute (ILRI), the International Center for Tropical Agriculture (CIAT) and the US Department of Agriculture (USDA), have played a relevant role in the collection, characterization and provision of Crotalaria accessions for use in research and development (Muli et al, 2022).
Genetic and morphological studies reveal significant intraspecific and interspecific variability between cultivated and native Crotalaria species, offering significant selection potential for breeding programmes aimed at developing new cultivars with pest resistance, greater biomass production, adaptation to low-fertility soils, and greater efficiency in biological nitrogen fixation (Muli et al, 2022; Odhoch et al, 2025).
Crotalaria species exhibit a high adaptability to the Brazilian Cerrado, particularly C. ochroleuca, C. juncea, C. breviflora and C. spectabilis, which have been extensively evaluated for biomass production, BNF, and their effects on soil fertility and biology (Silva et al, 2025). Dry matter production can range from 5 to 18t/ha, depending on soil and climate conditions and management practices (Abranches et al 2021; Lima Filho et al, 2023).
Studies conducted in the Cerrado region indicate that species such as C. ochroleuca and C. juncea are particularly efficient at accumulating nutrients: average N, P and K contents in the shoots can reach 25g/kg, 3.5g/kg, and 15g/kg, respectively (Silva et al, 2025). Furthermore, these legumes accumulate high amounts of fibres such as cellulose and lignin, contributing to the formation of stable organic matter in the soil (Guerra et al, 2007; Arone et al, 2024).
BNF is one of the most valued attributes of the Crotalaria genus, with reports of fixation exceeding 300kg N/ha in crops of C. juncea and C. spectabilis in association with efficient strains of Bradyrhizobium (Ferreira et al, 2021). This symbiosis significantly reduces the need for nitrogen fertilizers and improves nutrient use efficiency in integrated systems (Ferreira et al, 2021).
Furthermore, Crotalaria possesses bioactive compounds with allelopathic and nematicidal properties. Species such as C. spectabilis and C. juncea are used in the management of plant-parasitic nematodes, such as Meloidogyne incognita and Pratylenchus brachyurus, due to the production of alkaloids that are toxic to these organisms (Wang et al, 2002; Oka, 2010).
Despite the traditional focus on its use as a cover crop, there is growing interest in improving Crotalaria seed productivity, especially given its expanding use in sustainable agricultural systems. Average seed production ranges from 500 to 1,200kg/ha, depending on the species, planting density, and environmental conditions (da Silva et al, 2022). Research focused on genetic improvement and harvest management has sought to optimize the viability and vigour of the seeds produced (da Silva et al, 2022).
Characterizing and evaluating the genetic diversity of these materials is essential to promote the use of genetic resources stored in germplasm banks, in addition to guiding actions to expand the available genetic base. Breeding programmes and the development of new cultivars can utilize the information resulting from efforts to characterize genetic variability and identify superior genotypes, helping to meet the demands of current and future agriculture. In this context, the study aimed to evaluate the genetic variability among the Crotalaria accessions stored in Embrapa Cerrados Germplasm Bank using morphological descriptors.
Materials and methods
Twenty-two accessions of Crotalaria spp. in the Embrapa Cerrados Germplasm Bank, located at Planaltina/DF, Brazil, were evaluated to determine their phenomic diversity (Table 1).
Table 1. List of Crotalaria spp. accessions in the Germplasm Bank of Embrapa Cerrados. *, Brazilian germplasm system number.
|
Id Number |
BRA Number* |
Species |
|
2 |
00158911-8 |
Crotalaria mitosa |
|
3 |
00158912-6 |
Crotalaria spectabilis Roth |
|
4 |
00158913-4 |
Crotalaria sp. |
|
6 |
00158921-7 |
Crotalaria anagyroides Kunth |
|
7 |
00158916-7 |
Crotalaria sp. |
|
8 |
00158917-5 |
Crotalaria sp. |
|
10 |
00158919-1 |
Crotalaria sp. |
|
11 |
00158920-9 |
Crotalaria sp. |
|
12 |
00158914-2 |
Crotalaria sp. |
|
13 |
00158915-9 |
Crotalaria retusa L. |
|
14 |
00158922-5 |
Crotalaria spectabilis Roth |
|
16 |
00158925-8 |
Crotalaria sp. |
|
19 |
00158928-2 |
Crotalaria striata DC. |
|
20 |
00158929-0 |
Crotalaria ochroleuca G. Don |
|
21 |
00158939-9 |
Crotalaria incana L. |
|
22 |
00158930-8 |
Crotalaria mucronata Desv. |
|
24 |
00158932-4 |
Crotalaria spectabilis Roth |
|
25 |
00158933-2 |
Crotalaria retusa L. |
|
26 |
00158934-0 |
Crotalaria retusa L. |
|
28 |
00158936-5 |
Crotalaria grantiana Harv. |
|
29 |
00158937-3 |
Crotalaria paulina Schrank |
|
30 |
00158938-1 |
Crotalaria pallida Aiton |
Seeds of each accession were sown in 60-cell plastic trays filled with a suitable substrate, remaining there for 90 days after germination. After this period, they were transplanted to the field at Embrapa Cerrados Research Center, in Planaltina/DF/Brazil (15°35'34,42"S e 47°43'53,41"W), in a clayey red latosol, in single-row plots containing seven plants per plot, spaced with 0,5m among plants and 1,5m between lines. After 90 days, the vegetative measures were performed and the seeds characteristics were collected according to the maturation of the seeds, from each accession, using 16 qualitative and quantitative descriptors as presented in Table 2.
Table 2. List of evaluated morphological descriptors for Crotalaria sp.
|
Morphological descriptor |
Code |
Replications |
Unit |
Equipment used |
|---|---|---|---|---|
|
Plant height |
AP |
7 |
cm |
Graduated ruler |
|
Plant diameter |
DP |
7 |
cm |
Graduated ruler |
|
Growth habit |
HC |
7 |
Categories |
Visual evaluation |
|
Main branch diameter |
CM |
7 |
mm |
Digital callipers |
|
Main branch length |
CRP |
7 |
mm |
Digital callipers |
|
Number of primary branches |
NRP |
7 |
Count |
Manual counting |
|
Central leaflet length |
CFC |
7 |
mm |
Digital callipers |
|
Central leaflet width |
LFC |
7 |
mm |
Digital callipers |
|
Central leaflet L/W ratio |
RC_LFC |
7 |
mm |
Calculated |
|
Petiole length |
CP |
7 |
mm |
Digital callipers |
|
Leaflet shape |
LS |
7 |
Categories |
Visual evaluation |
|
Seed length |
CS |
7 |
mm |
Digital callipers |
|
Seed width |
WS |
7 |
mm |
Digital callipers |
|
Seed shape |
FDS |
7 |
Categories |
Visual evaluation |
|
Seed colour |
Srgb |
7 |
Colour chart |
Visual evaluation |
|
100-seed weight |
PCS |
5 |
g |
Precision scale |
A graduated ruler and precision callipers were used to accurately measure morphological data. Seed weight was measured using samples of 100 seeds, with five replicates per accession. Seed colour was classified according to the Royal Horticultural Society (RHS, 2015) colour chart, and seed shape was defined based on pre-existing morphological classes (heart and kidney).
Genetic variability among the accessions with respect to the morphological descriptors was examined by calculating Simpson’s (1949) and Shannon and Weaver’s (1949) diversity indices. These indices give a measure of phenotypic diversity and range from zero to one, where one represents great genetic diversity and zero the opposite or no genetic diversity. The indices correspond to the probability that two individuals randomly selected from a group of populations will have the same morphological feature. The formulas for calculating both indices are presented below.
- Shannon–Weaver (H):
- Simpson (D):
where i = 1 to n, and p is the proportion of the total morphotypes made up of the ith morphotype.
The data were organized in digital spreadsheets and subjected to descriptive and multivariate analyses using R software (R Core Team, 2024). Principal component analysis (PCA) and cluster analysis were performed using the Ward method (Ward, 1963), with the aim of observing the genetic variability among the accessions and separating them into similarity groups. Qualitative descriptors were not used for PCA due to their categorical nature, making them unsuitable for PCA analysis.
Results
A wide range of variation was observed among the evaluated morphological descriptors (Table 3), indicating substantial phenotypic diversity within the studied accessions. Plant height exhibited the largest variation, with a mean of 81.4cm and a broad range from 45 to 146cm (SD = 26.8), reflecting differences in overall plant vigour and architecture. Similarly, plant diameter varied considerably (20.5–99cm, mean = 63.6cm), suggesting diverse growth habits and canopy structures among genotypes.
Table 3. Descriptive statistics of quantitative descriptors
|
Morphological descriptor |
Mean |
Standard deviation |
Variance |
Range |
|
Plant height (cm) |
81.4 |
26.8 |
718.3 |
45–146 |
|
Plant diameter (cm) |
63.6 |
18.7 |
350.2 |
20.5–99 |
|
Main branch diameter (cm) |
9.7 |
3.2 |
10.2 |
4.6–17 |
|
Main branch length (cm) |
31.6 |
13.5 |
182.3 |
9–61.5 |
|
Number of primary branches |
10.7 |
4.7 |
22.3 |
6–25 |
|
Central leaflet length (mm) |
60.1 |
26.3 |
692.7 |
10.7–105 |
|
Central leaflet width (mm) |
27.0 |
11.2 |
125.4 |
4.6–51 |
|
Central leaflet L/W ratio |
2.6 |
1.5 |
2.3 |
1.47–8.4 |
|
Petiole length (mm) |
20.9 |
15.3 |
233.9 |
2–44 |
|
Seed length (mm) |
2.5 |
0.6 |
0.36 |
2–3.57 |
|
Seed width (mm) |
3.3 |
0.9 |
0.87 |
2.16–4.68 |
|
100-seed weight (g) |
1.2 |
0.7 |
0.52 |
0.40–2.19 |
Traits related to branching showed moderate variability. The main branch diameter ranged from 4.6 to 17cm, while main branch length varied between 9 and 61.5cm. The number of primary branches exhibited a relatively high dispersion, highlighting morphological heterogeneity in plant architecture.
Comparing the individual accessions, accession #25 (BGF 6494) had plants with the tallest average height (145cm) and largest average diameter (92cm), exhibiting an upright growth habit. The smallest accession #13 (BGF 6476) had an average height of 45cm and a diameter of 54cm, exhibiting a semi-upright growth habit. Both accessions are Crotalaria retusa L. (Table 4).
Leaflet traits also displayed marked variation. Central leaflet length ranged from 10.7 to 105mm, and leaflet width from 4.6 to 51mm. The length-to-width ratio (L/W) varied from 1.47 to 8.4, suggesting the coexistence of both broad and elongated leaflet morphotypes. Petiole length ranged from 2 to 44mm, showing substantial variability in leaf structure.
Seed-related traits were comparatively less variable. Seed length and width ranged from 2 to 3.57mm and 2.16 to 4.68mm, respectively, with low standard deviations. The 100-seed weight exhibited moderate variation, consistent with the general trend of smaller seed-size diversity compared with vegetative descriptors.
Regarding leaflet shape, it was observed that ten accessions had trifoliate leaves, 11 had simple leaves, and only one had a digitate leaf, demonstrating significant morphological variation in this characteristic (Figure 1). In addition, significant differences in shape and colour of the seeds were observed. The majority of the accessions (18) presented a kidney shape, and the remaining accessions (4) presented a heart shape seed (Figure 1). In relation to the colour of the seeds, six different types were observed: yellow (6), green (6), orange (2), black (4), red (1), and striped (1) were observed (Figure 1).

Table 4. Plant height (AP); plant diameter (DP); growth habit (HC); main branch diameter (DHP); main branch length (CHP); number of primary branches (NRP); central leaflet length (CFC); central leaflet width (LFC); petiole length (CP); leaflet shape (LS); seed length (CS); seed width (WS); Seed shape (FDS); Seed colour (Srgb) and 100-seed weight (PCS) of Crotalaria accessions.
|
ID # |
AP (cm) |
DP (cm) |
HC |
CM (mm) |
CRP (cm) |
NRP |
CFC (mm) |
LFC (mm) |
RC_LFC (cm) |
CP (mm) |
LS |
CS (mm) |
WS (mm) |
FDS |
Srgb |
PCS (g) |
|
2 |
78 |
62 |
Upright |
11 |
30 |
6 |
60.75 |
34 |
1.81 |
31 |
trifoliate |
2.3 |
2.18 |
heart |
yellow |
0.532 |
|
3 |
83 |
63 |
Upright |
9 |
26 |
7 |
43.4 |
24.9 |
1.76 |
33.2 |
trifoliate |
2.15 |
2.8 |
kidney |
green |
0.693 |
|
4 |
69 |
60 |
Upright |
6 |
25 |
7 |
65 |
36 |
1.8 |
35 |
trifoliate |
2.18 |
2.88 |
kidney |
green |
0.664 |
|
6 |
93 |
64 |
Upright |
12 |
22.5 |
10 |
39 |
20.5 |
1.92 |
31 |
trifoliate |
2.65 |
2.47 |
heart |
yellow |
0.661 |
|
7 |
59 |
68 |
Semi-erect |
7 |
42.2 |
9 |
47.5 |
18.7 |
2.52 |
2.7 |
simple |
3.19 |
4.2 |
kidney |
yellow |
1.88 |
|
8 |
53 |
51 |
Semi-erect |
6.5 |
42.5 |
10 |
50.3 |
16.4 |
3.1 |
2.3 |
simple |
3.28 |
4 |
kidney |
yellow |
1.77 |
|
10 |
102 |
75 |
Semi-erect |
6.3 |
61.5 |
9 |
85 |
3.5 |
26.8 |
2 |
simple |
2.5 |
2.79 |
kidney |
black |
0.760 |
|
11 |
54 |
49 |
Semi-erect |
6 |
41 |
8 |
48.8 |
17.5 |
2.81 |
2.1 |
simple |
3.28 |
4.13 |
kidney |
yellow |
1.83 |
|
12 |
58 |
99 |
Prostate |
10 |
38 |
15 |
42.5 |
17.5 |
2.5 |
44 |
trifoliate |
2.37 |
3 |
kidney |
orange |
0.777 |
|
13 |
45 |
54 |
Semi-erect |
7 |
48 |
8 |
58.2 |
20.7 |
2.88 |
2.4 |
simple |
3.36 |
4.35 |
kidney |
yellow |
2.09 |
|
14 |
99 |
51 |
Semi-erect |
13 |
28 |
19 |
105 |
42.5 |
2.5 |
4.5 |
simple |
3.57 |
4.61 |
kidney |
black |
2.19 |
|
16 |
67 |
53 |
Upright |
12 |
32 |
11 |
98.9 |
40.2 |
2.48 |
4.8 |
simple |
3.01 |
3.68 |
kidney |
red |
1.08 |
|
19 |
115 |
83 |
Upright |
16 |
16 |
8 |
48.1 |
32.8 |
1.47 |
28.5 |
trifoliate |
3.08 |
2.7 |
heart |
green |
0.878 |
|
20 |
146 |
92 |
Upright |
17 |
9 |
25 |
57.5 |
7.75 |
8.4 |
31.2 |
trifoliate |
2 |
3,31 |
kidney |
orange |
1.13 |
|
21 |
115 |
76 |
Upright |
7.6 |
14 |
12 |
82 |
29 |
2.8 |
8 |
simple |
2.4 |
2.87 |
kidney |
green |
0.719 |
|
22 |
67 |
20.5 |
Semi-erect |
4.6 |
18 |
10 |
46 |
21.7 |
2.22 |
36 |
trifoliate |
2.48 |
2.85 |
kidney |
striped |
0.766 |
|
24 |
63 |
36 |
Semi-erect |
8.8 |
22 |
6 |
103.7 |
51 |
2 |
5.6 |
simple |
3.57 |
4.68 |
kidney |
black |
2.04 |
|
25 |
52 |
44 |
Semi-erect |
7 |
26.5 |
9 |
48 |
16.8 |
2.9 |
2.9 |
simple |
3.27 |
4.42 |
kidney |
yellow |
1.96 |
|
26 |
54 |
47 |
Semi-erect |
6 |
35 |
7 |
43.2 |
14.8 |
2.9 |
2.5 |
simple |
3.41 |
4.31 |
kidney |
yellow |
2.1 |
|
28 |
70 |
46 |
Semi-erect |
7.8 |
19.5 |
9 |
10.7 |
4.6 |
2.5 |
5.4 |
digitate |
2 |
2.16 |
kidney |
orange |
0.4 |
|
29 |
82 |
84 |
Upright |
11 |
28 |
6 |
41.6 |
21 |
1.97 |
39.4 |
trifoliate |
2.34 |
2.54 |
kidney |
green |
0.583 |
|
30 |
90 |
80 |
Semi-erect |
10.5 |
24.6 |
8 |
53.5 |
24.7 |
2.1 |
38.6 |
trifoliate |
2.62 |
2.43 |
heart |
green |
0.634 |
Shannon–Weaver (H) and Simpson (D) indices were calculated using the continuous values of quantitative morphological descriptors, treating each accession as a unique morphotype (Table 5).
Diversity values were consistently high across all evaluated traits. Shannon accurately represents class richness and the presence of rare classes, showing values closer to 1 when morphologically unique accessions are present, even if at low frequency. Simpson, on the other hand, is guided by the concentration in a few classes (dominance). The value is high when many accessions are very closely related/duplicated.
Table 5. Shannon–Weaver (H) and Simpson (D) diversity indices for quantitative descriptors
|
Descriptor |
Shannon–Weaver (H) |
Simpson (D) |
|---|---|---|
|
Plant height (cm) |
0.984 |
0.950 |
|
Plant diameter (cm) |
0.985 |
0.950 |
|
Main branch diameter (cm) |
0.981 |
0.949 |
|
Main branch length (cm) |
0.974 |
0.947 |
|
Number of primary branches |
0.974 |
0.946 |
|
Central leaflet length (mm) |
0.975 |
0.948 |
|
Central leaflet width (mm) |
0.966 |
0.945 |
|
Central leaflet L/W ratio |
0.971 |
0.943 |
|
Petiole length (mm) |
0.865 |
0.920 |
|
Seed length (mm) |
0.990 |
0.952 |
|
Seed width (mm) |
0.942 |
0.939 |
|
100-seed weight (g) |
0.956 |
0.942 |
|
Total |
0.964 |
0.940 |
The Shannon–Weaver index (H) ranged from 0.865 for petiole length to 0.990 for seed length, with a total mean of 0.964. Similarly, Simpson’s index (D) varied from 0.920 for petiole length to 0.952 for seed length, with a total mean of 0.940.
Among vegetative traits, plant height (H = 0.984; D = 0.950), plant diameter (H = 0.985; D = 0.950), and main branch diameter (H = 0.981; D = 0.949) showed the highest diversity values. Leaflet traits displayed slightly lower but still high values, with central leaflet length (H = 0.975; D = 0.948) and width (H = 0.966; D = 0.945) presenting similar diversity patterns.
Seed traits exhibited high and uniform diversity levels. Seed length had the highest indices among all descriptors (H = 0.990; D = 0.952), followed by seed width (H = 0.942; D = 0.939) and 100-seed weight (H = 0.956; D = 0.942). Overall, both indices indicated substantial phenotypic variability among the evaluated quantitative traits.
PCA was performed to discriminate among accessions and group them into different clusters/groups. The goal of PCA is to provide a reduced dimension model that would indicate measured differences among groups. It can also contribute to a better understanding of the set of variables by describing how much of the total variance is explained by each one. With this objective, PCA was performed only on quantitative variables. Thus, only 11 variables were used: plant height (AP); plant diameter (DP); main branch diameter (DHP); main branch length (CHP); number of primary branches (NRP); central leaflet length (CFC); central leaflet width (LFC); petiole length (CP); seed length (CS); seed width (WS); and 100-seed weight (PCS).
The PCA revealed that the first two components explain 63.72% of the total data variation, which indicates a good representation of the genetic variability among the evaluated accessions (Table 6).
Table 6. Vector loadings and percentage of variation explained by the first three principal components for morphological characteristics of Crotalaria sp.
|
Variable |
PC1 |
PC2 |
PC3 |
|
Eigen Value |
4.56 |
2.45 |
1.47 |
|
% Explained |
41.48 |
22.24 |
13.37 |
The loadings of morphological descriptors on each component indicated that PC1 was primarily influenced by seed length, seed width, and 100-seed weight (Table 7). PC2 was formed based on main branch diameter (CM), central leaflet length (CFC) and number of primary branches (NRP).
Table 7. Loadings of morphological descriptors on principal components. AP (plant height); DP (plant diameter); CM (main branch diameter); CRP (main branch length); NRP (number of primary branches); CFC (central leaflet length); LFC (central leaflet width); CP (petiole length); CS (seed length); WS (seed width); PCS (100-seed weight).
|
Descriptor |
PC1 |
PC2 |
|
AP |
-0.686 |
0.555 |
|
DP |
-0.651 |
0.194 |
|
CM |
-0.538 |
0.692 |
|
CRP |
0.517 |
-0.357 |
|
NRP |
-0.269 |
0.632 |
|
CFC |
0.329 |
0.699 |
|
LFC |
0.199 |
0.541 |
|
CP |
-0.788 |
-0.079 |
|
CS |
0.868 |
0.295 |
|
WS |
0.871 |
0.356 |
|
PCS |
0.872 |
0.306 |
The first two principal components were used to execute a cluster analysis using the complete linkage clusters method (Sokal and Michener, 1958). The dendrogram resulting from this analysis is presented in Figure 2.
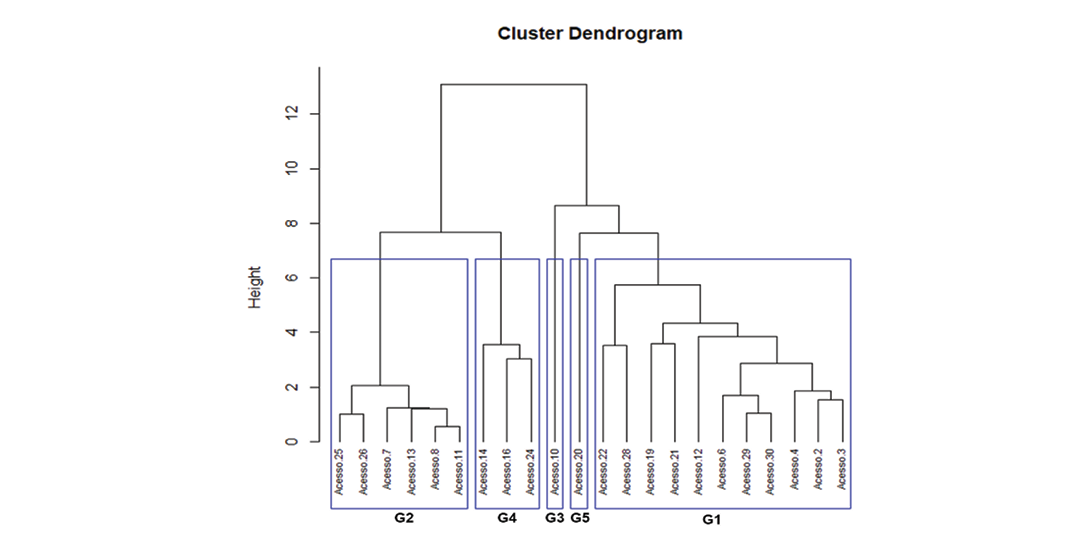
A cluster analysis using the Ward method allowed the 22 accessions to be divided into five groups based on similarity. Group 1 was the largest, with 11 accessions, followed by Group 2 with six accessions, and Group 4 with three accessions. Groups 3 and 5 each had only one accession; these accessions correspond to the tallest and largest plants (Table 8).
Table 8. Averages of morphological descriptors by group AP (plant height); DP (plant diameter); CM (main branch diameter); CRP (main branch length); NRP (number of primary branches); CFC (central leaflet length); LFC (central leaflet width); CP (petiole length); CS (seed length); WS (seed width); PCS (100-seed weight).
|
Cluster |
Nº |
AP |
DP |
CM |
CRP |
NRP |
CFC |
LFC |
CP |
WS |
CS |
PCS |
|
G1 |
11 |
83.6 |
67.0 |
9.6 |
23.8 |
8.9 |
48.4 |
24.2 |
30.0 |
2.4 |
2.6 |
0.7 |
|
G2 |
6 |
52.8 |
52.6 |
8.7 |
16.0 |
5.7 |
42.5 |
17.5 |
25.0 |
3.3 |
3.4 |
2.1 |
|
G3 |
1 |
102.0 |
75.0 |
6.1 |
18.0 |
9.0 |
55.0 |
34.5 |
20.0 |
2.5 |
2.8 |
0.8 |
|
G4 |
3 |
80.0 |
72.0 |
17.0 |
40.0 |
5.0 |
65.0 |
30.0 |
14.0 |
2.0 |
2.0 |
1.0 |
|
G5 |
1 |
146.0 |
92.0 |
17.0 |
90.0 |
25.0 |
57.5 |
7.8 |
31.2 |
2.0 |
3.3 |
1.1 |
Group 1 was represented by nine different species, demonstrating that it included the largest diversity. Group 2 was mostly represented by C. retusa accessions. Group 3 was formed by a single Crotalaria sp. accession. Group 4 gathered mostly accessions of C. spectabilis and Group 5 was formed by a single accession of C. ochroleuca.
Discussion
Phenotypic variation
The morphological evaluation of the accessions revealed substantial variability across all traits, indicating a high degree of phenotypic diversity. Most of the accessions presented an upright (11 accessions) or a semi-erect growth habit (10). This variation is critical for selection depending on the intended agronomic purpose, such as forage production or adaptation to specific environments (Sayed et al, 2022). Similarly, plant diameter (DP) showed moderate variation, reflecting differences in plant architecture that may influence light interception and biomass accumulation (Solbrig, 1994). Accessions with greater height and diameter may be prioritized in breeding programmes aiming to maximize biomass, while more compact forms could be selected for environments requiring denser planting or easier management.
Branch traits, including main branch diameter (DHP) and main branch length (CHP), exhibited considerable diversity. Such variation affects structural stability and biomass yield, particularly in accessions with higher numbers of branches (NRP), which ranged from 6 to 25. These branching traits are important for breeding strategies targeting canopy architecture optimization, light distribution and overall productivity (Nelson and Moser, 1994).
Leaf size influences photosynthetic capacity, transpiration and overall plant growth, contributing to adaptation under different environmental conditions. Accessions with larger leaf areas could be prioritized for breeding programmes focused on maximizing biomass accumulation, while smaller leaves may be advantageous for water-limited environments (Weraduwage et al, 2015). Accessions #2, 4, 14, 16, 19, 21 and 24 presented the larger leaf area among the germplasm.
Seed weight (PCS) ranged from 0.40 to 2.19g, indicating potential differences in seedling vigour and establishment. Twelve of the 24 accessions (half) had a seed weight below 1g, while the other half exceeded 1g. The presence of approximately seven accessions classified only as Crotalaria sp. within these two groups complicates the determination of whether this difference is genuinely species-related. Nevertheless, there are three accessions classified as C. spectabilis. The PCS for these accessions presented large variability: 0,7g; 2g and 2.2g. Variation in seed weight is a critical trait for germplasm evaluation and breeding, as it often correlates with seedling performance, establishment success, and yield potential (Gnan et al, 2014). Accessions with higher seed weights may be selected to enhance early growth and establishment in breeding programmes targeting improved crop performance.
The observed diversity in seed shape and colour, as well as in leaf morphology (trifoliate, simple, and digitated), confirms significant genetic variability and underscores the importance of ex situ conservation in the Embrapa Cerrados germplasm bank. The presence of accessions with unique characteristics, such as heart- or kidney-shaped seeds and distinct growth habits, highlights the availability of genetic resources for breeding programmes targeting seed production, biomass yield and nutrient-use efficiency (Arone et al, 2024; Muli et al, 2021).
Overall, the observed morphological variation suggests a rich genetic base within the evaluated accessions. Vegetative traits, particularly plant height, leaflet size and branching characteristics, exhibited higher coefficients of variation than reproductive traits, emphasizing their contribution to morphological differentiation among accessions. Integrating these phenotypic evaluations into germplasm selection strategies can facilitate the identification of superior accessions, providing a foundation for efficient breeding programmes. This broad genetic diversity could also be exploited in breeding programmes targeting plant architecture and leaf morphology, resulting in new cultivars with improved adaptability, biomass productivity, or specific agronomic characteristics. Future studies combining molecular marker analysis with these morphological traits would provide a more comprehensive understanding of the genetic potential and heritability of key traits.
Diversity index
The analysis of morphological traits in this study provides valuable insights into the genetic diversity of the evaluated accessions. The Shannon–Weaver (H) and Simpson (D) diversity indices offer a quantitative assessment of this diversity, which is crucial for effective breeding and germplasm selection strategies.
The quantitative morphological descriptors showed an average Shannon–Weaver diversity index (H) of 0.964 and an average Simpson diversity index (D) of 0.940. When H and D values are high and close to 1 in a germplasm collection calculated from morphological descriptors, this generally indicates high phenotypic diversity and low dominance of a morphological state. Traits such as AP (H = 0.984), DP (H = 0.985), and CS (H = 0.990) exhibited high diversity, indicating a broad genetic base. Conversely, traits like NRP (H = 0.65) showed lower diversity, suggesting potential areas for improvement through breeding.
A high H value indicates many states present (class richness) and/or a relatively balanced distribution among these states (evenness). In practice, this means that the collection covers a wide range of phenotypes and is not concentrated in a few morphological types.
A high D value (approaching 1) indicates the absence of a clearly dominant morphological state among the analyzed descriptors. This suggests that, based on these descriptors, the germplasm bank contains few ‘identical’ accessions, resulting in lower redundancy (fewer evident phenotypic duplicates).
These results indicate that the collection exhibits good stratification and represents a wide variation, which is valuable for ex situ conservation. The existing diversity, already well distributed, increases the potential for assembling core collections with minimal loss of variability, while the presence of extreme or rare phenotypes provides additional options for pre-breeding.
Accessions with unique trait profiles, especially those with lower diversity, can serve as valuable sources of novel alleles. Incorporating these into breeding programmes can broaden the genetic base and introduce beneficial traits (Fu et al, 2015).
The diversity indices can inform the development of selection indices that prioritize traits with optimal diversity levels, balancing the need for improvement with the preservation of genetic variability.
Diversity assessments in other legume species have demonstrated that combining diversity indices such as Shannon–Weaver and Simpson with multivariate analyses is an effective approach for characterizing germplasm collections and guiding breeding and conservation strategies (Upadhyaya et al, 2002; Carvalho and Quesenberry, 2009).
Principal component analysis
PC1 was primarily influenced by reproductive characteristics, specifically seed length, seed width, and 100-seed weight (Table 6). These positive loadings suggest that seed size and weight were the main sources of variation among the accessions. Conversely, a morphological trade-off was indicated by the negative correlations of PC1 with vegetative traits, such as petiole length (-0.788), plant height (-0.686), and plant diameter (-0.651). This pattern – a trade-off between vegetative growth and seed size – is consistent with findings reported by Devecchi et al (2014), Lanna et al (2021) and Carvalho and Quesenberry (2009).
PC2 was predominantly associated with plant height (AP), main branch diameter (CM), number of primary branches (NRP), central leaflet length (CFC) and central leaflet width (LFC).
Cluster analysis
Group 1 (11 accessions) represents the ‘mainstream’ ideotype: medium plant height and canopy diameter, moderate stem and primary-branch development, intermediate leaflet and petiole dimensions and the smallest seeds with the lowest 100-seed weight. Agronomically, this profile fits a general-purpose cover/green-manure pool with reasonably balanced architecture. Group 2 (6 accessions) is a compact pool but clearly stands out for larger, heavier seeds, which is typically associated with better field emergence and seed-lot robustness – useful for seed production and for service-crop cultivars where establishment reliability is a priority, including intercropping scenarios where lower stature reduces competition. Group 3 (1 accession) and Group 4 (3 accessions) concentrate ‘leaf-and-structure’ extremes: Group 3 has tall and wide plants with large central leaflets and moderate branching, suggesting strong shading potential for weed suppression and fast canopy closure (Abranches et al, 2021). Group 4 combines medium height with thick stems and very large leaflets but fewer primary branches, pointing to structural robustness and a broad-leaf canopy that can be valuable for biomass/canopy design depending on lodging behaviour. Group 5 (1 accession) is the most extreme architecture ideotype – very tall, very wide, exceptionally branched (#25) with very long main-branch length – indicating a high-biomass, high-competitiveness pool for aggressive cover, soil protection, and rehabilitation, while its comparatively heavier seeds support establishment.
These findings are consistent with previous studies on Crotalaria species, where PCA and cluster analyses have been employed to assess morphological diversity and accessions grouping based on phenotypic traits (Muli et al, 2021; Yaradua et al, 2018). The combination of PCA and cluster analysis in this study provides a comprehensive understanding of the morphological variation among Crotalaria accessions, highlighting the potential for selection and breeding programmes aimed at improving agronomic performance.
The comprehensive morphological evaluation of the Crotalaria accessions revealed a high degree of phenotypic and genetic diversity across vegetative and reproductive traits. The wide variation observed in plant height, diameter, branching pattern, leaflet morphology and seed characteristics underscores the existence of a rich and heterogeneous genetic base within the studied germplasm. The consistently high Shannon–Weaver and Simpson diversity indices confirm that the collection maintains a broad spectrum of variability, which is essential for effective germplasm conservation and future breeding initiatives.
The principal component and cluster analyses provided a clear separation of accessions into distinct morphological groups, indicating that the evaluated traits successfully captured meaningful genetic differentiation. Accessions exhibiting superior plant vigour, leaf area, or seed size were identified as potential parents for breeding programmes targeting biomass accumulation, seed production, or adaptability to diverse environments. Meanwhile, genotypes with contrasting phenotypes represent valuable resources for introgressing novel alleles and maintaining broad genetic variability within the species.
Conclusion
The results of this study have practical implications for both breeding and germplasm conservation. The identification of distinct phenotypic groups and accessions with superior agronomic traits provides a solid foundation for developing improved cultivars with enhanced biomass production, seed yield and environmental adaptability. Accessions representing divergent morphological clusters should be prioritized in hybridization programmes to maximize heterosis and maintain broad genetic variability. Furthermore, the high within-collection diversity observed reinforces the importance of continuous phenotypic and molecular characterization in germplasm banks to ensure the long-term preservation of genetic resources and their effective utilization in sustainable agricultural systems.
In summary, the study demonstrates that morphological characterization, combined with diversity indices and multivariate analyses, is a powerful approach for assessing genetic variability in Crotalaria. The identified diversity provides a solid foundation for future breeding efforts aimed at optimizing plant architecture, seed yield, and adaptation, while supporting the conservation and strategic utilization of genetic resources essential for crop improvement and ecosystem sustainability.
Author contributions
JMMS conducted data collection and manuscript writing. JVM performed the data analysis. AKBR, CTK, MRF and GJB contributed to manuscript review. MAC served as germplasm curator and contributed to experimental planning, data analysis and manuscript writing.
Conflict of interest statement
The authors declare that the research was conducted in the absence of any commercial or financial relationships that could be construed as a potential conflict of interest.
The authors declare that this study received funding from Embrapa. The funder was not involved in the study design, collection, analysis, interpretation of data, the writing of this article or the decision to submit it for publication.
References
Abranches, M. de O., da Silva, G. A. M., dos Santos, L. C., Pereira, L. F., de Freitas, G. B. (2021). Contribution of green fertilization to the chemical, physical and biological characteristics of the soil and its influence on the nutrition of vegetables. Research, Society and Development 10, e3210716351. doi: https://doi.org/10.33448/rsd-v10i7.16351
Arone, G. J., Ocaña, R., Sánchez, A., Villadas, P. J., Fernández-López, M. (2024). Benefits of Crotalaria juncea L. as green manure in fertility and soil microorganisms on the Peruvian coast. Microorganisms 12, 2241. doi: https://doi.org/10.3390/microorganisms12112241
Bolleddu, R., Debajyoti, D., Das, M., Sahu, D., Mangal, A., Babu, G., Venkata, P., Prasad, P. (2023). Pharmacognostical and phytochemical studies of Crotalaria retusa L. (Shanapuspi) dried roots. Journal of Drug Research in Ayurvedic Sciences 8, 370–376. doi: https://doi.org/10.4103/jdras.jdras_31_23
Carvalho, M. A., Quesenberry, K. H. (2009). Morphological characterization of the USA Arachis pintoi Krap. and Greg. collection. Plant Systematics and Evolution 277, 1–11. doi: https://doi.org/10.1007/s00606-008-0089-9
da Silva, B. N. P., Masetto, T. E., Garcia, R. A., Toledo, M. Z. (2022). Row spacing and seed physiological quality of Crotalaria species. Pesq. Agropec. Trop. 52, e72674. doi: https://doi.org/10.1590/1983-40632022v5272674
Daimon, H. (2006). Traits of the Genus Crotalaria Used as a Green Manure Legume on Sustainable Cropping Systems. JARQ 40, 299–305. doi: https://doi.org/10.6090/jarq.40.299
Devecchi, M. F., Pirani, J. R., Melo-de-Pinna, G. F. d. A. (2014). Comparative leaf anatomy and morphology of some Brazilian species of Crotalaria L. (Leguminosae: Papilionoideae: Crotalarieae). Acta Botanica Brasilica 28, 583–593. doi: https://doi.org/10.1590/0102-33062014abb3517
Ferreira, E. A., et al (2021). Fixação biológica de nitrogênio em leguminosas de cobertura. Cadernos de Agroecologia 16, 2. doi: https://doi.org/10.22308/cadernosdeagroecologia.v16i2.17256
Fu, Y. B., et al (2015). Understanding crop genetic diversity under modern plant breeding. Theor Appl Genet 128, 2131–2142. https://doi.org/10.1007/s00122-015-2585-y
Gnan, S., Priest, A. and Kover, P.X., 2014. The genetic basis of natural variation in seed size and seed number and their trade-off using Arabidopsis thaliana MAGIC lines. Genetics, 198(4), pp.1751-1758. doi: https://doi.org/10.1534/genetics.114.170746
Guerra, J. G. M., Espíndola, J. A. A., Perin, A., Teixeira, M. G., Almeida, D. L. de, Assis, R. L. de (2007). Desempenho de leguminosas tropicais perenes como plantas de cobertura do solo. Embrapa Agrobiologia, Boletim de Pesquisa e Desenvolvimento 20. url: https://www.infoteca.cnptia.embrapa.br/infoteca/handle/doc/622591
Koudahe, K., Allen, S. C., Djaman, K. (2022). Critical review of the impact of cover crops on soil properties. International Soil and Water Conservation Research 10, 343–354. doi: https://doi.org/10.1016/j.iswcr.2022.03.003
Lanna, A. C., Silva, M. A., Moreira, A. S., Nascente, A. S., Filippi, M. C. C. de (2021). Improved nutrient uptake in three Crotalaria species inoculated with multifunctional microorganisms. Rev. Bras. Eng. Agríc. Ambient. 25, 460–465. doi: https://doi.org/10.1590/1807-1929/agriambi.v25n7p460-465
Lima Filho, O. F., et al, eds. (2023). Adubação verde e plantas de cobertura no Brasil: fundamentos e prática (Brasília, DF: Embrapa), 586 p.
Muli, J. K., Neondo, J.O., Kamau, P.K. et al. Phenomic characterization of Crotalaria germplasm for crop improvement. CABI Agric Biosci 2, 10 (2021). https://doi.org/10.1186/s43170-021-00031-0
Muli, J. K., Neondo, J. O., Kamau, P. K., Michuki, G. N., Odari, E., Budambula, N. L. M. (2022). Genetic diversity and population structure of wild and cultivated Crotalaria species based on genotyping-by-sequencing. PLOS ONE 17, e0272955. doi: https://doi.org/10.1371/journal.pone.0272955
Muli, J. K., Neondo, J. O., Budambula, N. L. M. (2025). Agro-morphological diversity of edible Kenyan Crotalaria accessions. Scientific African 27, e02620. doi: https://doi.org/10.1016/j.sciaf.2025.e02620
Müller-Samann, K. M., Kotschi, J. (1994). Sustaining growth: soil fertility management in tropical small holdings (United Kingdom: Technical Centre for Agricultural and Rural Cooperation), 486 p.
National Research Council. (1979). Tropical legumes: resources for the future (Washington, D.C.: National Academy of Science), 331 p.
Nelson, C. J., Moser, L. E. (1994). Plant factors affecting forage quality. In Forage Quality, Evaluation, and Utilization, ed. G. C. Fahey Jr., M. Collins, D. R. Mertens, L. E. Moser (Madison, WI: ASA, CSSA, SSSA), 115–154.
Odhoch, P. S., Budambula, N. L. M., Kiprotich, F., Muli, J. K. (2025). Exploring genetic diversity: Optimizing simple sequence repeat (SSR) markers in Crotalaria for enhanced precision in biodiversity research. Scientifica (Cairo) 2025, 2409286. doi: https://doi.org/10.1155/sci5/2409286
Oka, Y. (2010). Mechanisms of nematode suppression by organic soil amendments—A review. Appl. Soil Ecol. 44, 101–115. doi: https://doi.org/10.1016/j.apsoil.2009.11.003
Polhill, R. M. (1968). Miscellaneous notes on African species of Crotalaria L. II. Kew Bulletin 22, 169–337. doi: https://doi.org/10.2307/4107762
R Core Team. (2024) R: A Language and Environment for Statistical Computing. R Foundation for Statistical Computing. https://www.R-project.org/
Royal Horticultural Society (2015). RHS Colour Chart (6th ed.). London: Royal Horticultural Society. [Plate 155D]
Sayed, M. R. I., et al (2022). Genetic diversity, analysis of some agro-morphological and quality traits and utilization of plant resources of alfalfa. Genes 13, 1521. doi: https://doi.org/10.3390/genes13091521
Silva, J. L., Almeida, J., Sousa, M., Silva, E. (2018). Crotalária: usos e potencialidades no Cerrado. In Anais do III Congresso Internacional das Ciências Agrárias (COINTER PDVAgro), João Pessoa. doi: https://doi.org/10.31692/2526-7701.XCOINTERPDVAgro.2018.00033
Shannon, C.E., Weaver, W., 1949. The Mathematical Theory Communication. University of Illinois Press, Urbana.
Simpson, E. H. (1949). Measurement of diversity. Nature 163, 688. doi: https://doi.org/10.1038/163688a0
Solbrig, O. T. (1994). Plant traits and adaptive strategies: their role in ecosystem function. In Biodiversity and Ecosystem Function, ed. E.-D. Schulze, H. A. Mooney (Berlin: Springer), 97–116.
Sokal, R. R., & Michener, C. D. (1958). A statistical method for evaluating systematic relationships. University of Kansas Science Bulletin, 38, 1409-1438. [1, 2, 3]
Upadhyaya, H. D., Bramel, P.J., Ortiz, R. et al. (2002) Geographical patterns of diversity for morphological and agronomic traits in the groundnut germplasm collection. Euphytica 128, 191–204. https://doi.org/10.1023/A:1020835419262
Wang, K.-H., Sipes, B. S., Schmitt, D. P. (2002). Crotalaria as a cover crop for nematode management: a review. Nematropica 32, 35–58. url: https://journals.flvc.org/nematropica/article/view/69643
Ward, J. H., Jr. (1963). "Hierarchical grouping to optimize an objective function." Journal of the American Statistical Association, 58(301), 236-244.
Weraduwage, S. M., Chen, J., Anozie, F. C., Morales, A., Weise, S. E., Sharkey, T. D. (2015). The relationship between leaf area growth and biomass accumulation in Arabidopsis thaliana. Frontiers in Plant Science 6, 167. doi: https://doi.org/10.3389/fpls.2015.00167
Yaradua, S. S., et al (2018). Numerical taxonomic study of the genus Crotalaria L. (Crotalarieae, Fabaceae) in Nigeria. Biodiversity Research and Conservation, vol. 50, no. 1, Adam Mickiewicz University, pp. 25-32. https://doi.org/10.2478/biorc-2018-0005