Participatory assessment of potato landrace diversity and conservation vulnerability in northern Peru
Juan F. Seminarioa,*, Kevin Quispe Lucanoa, Anderson J. Mijahuanca Grandaa, Joselito Sánchez Hernándeza, Silvia Y. Rodríguez Lópezb, Fernando Escobal Valenciab, Yover Rubio Llatasc, Jorge L. Vásquez-Orrillod, Wilsser Silvae,*
a Programa de Raíces y Tubérculos Andinos, Facultad de Ciencias Agrarias, Universidad Nacional de Cajamarca, Peru
b Estación Experimental Baños del Inca, Instituto Nacional de Innovación Agraria, Peru
c Laboratorio de Fisiología Vegetal, Facultad de Ciencias Agrarias, Universidad Nacional de Cajamarca, Peru
d Estación Experimental Agraria Baños del Inca, Instituto Nacional de Innovación Agraria (INIA), Jirón Wiracocha s/n, 06004, Baños del Inca, Peru
e Programa de Doctorado en Ingeniería y Ciencias Ambientales, Universidad Nacional Agraria La Molina, Av. La Molina s/n, La Molina-Lima, Peru
* Corresponding authors: Wilsser Silva (20240313@lamolina.edu.pe), Juan F. Seminario (jfseminario@yahoo.es)
Abstract: Crop genetic diversity is fundamental to the resilience and adaptive capacity of agricultural systems. However, the conservation of native potato varieties is increasingly under threat. This study assessed the diversity currently maintained, varietal vulnerability, locally lost varieties, and farmer-perceived factors associated with varietal loss in 12 high-Andean communities of Cajamarca, Peru. A participatory Four-Cell Analysis (FCA), expanded to include a fifth cell for locally lost varieties, was conducted through workshops with farmers recognized for their knowledge of potato diversity. A total of 151 potato varieties were identified, comprising 128 native and 23 modern varieties. Most varieties (97) were classified in cell D, indicating high vulnerability because they were cultivated by few households and over small areas, whereas relatively few varieties occurred in the lower-risk cells A–C. In addition, 50 locally lost varieties were recorded, including 41 native and 9 modern varieties. Farmer-perceived drivers of varietal loss included the increasing preference for modern and commercially oriented native varieties, expansion of dairy farming, government social programmes, and declining household labour availability. Despite the substantial diversity maintained in these communities, its concentration in vulnerable categories and the number of locally lost varieties indicate ongoing loss of potato varieties. Strengthening in situ conservation, complemented by periodic participatory monitoring, is therefore essential to maintain threatened native potato diversity.
Keywords: Genetic diversity, Native potato, In situ conservation, Agrobiodiversity, Local knowledge
Introduction
Crop diversity underpins agricultural productivity, ecological resilience, and the long-term adaptive capacity of agricultural systems. Although concerns about declining crop diversity have been documented for over a century, the scale, trajectory, and underlying factors of these losses remain insufficiently clear (Khoury et al, 2022; Dawson et al, 2023). Genetic erosion, the progressive reduction of intraspecific genetic diversity caused by the loss of populations, varieties, or alleles due to environmental and anthropogenic pressures (Maxted and Guarino, 2006), is a central component of this decline. As environmental pressures intensify, the disappearance of genetic resources has accelerated, leading to the loss of local varieties, related wild species, and other important components of agrobiodiversity (Zevallos et al, 2023). These resources represent some of the most important foundations for future crop improvement (Kumar and Singh, 2023).
Monitoring crop genetic diversity directly on farms remains a crucial yet challenging task, largely because there is still no consensus on key definitions, measurement objectives, methodological standards, or appropriate temporal and spatial scales (Dulloo et al, 2021; Khoury et al, 2022; Nagel et al, 2022). Monitoring changes in genetic diversity involves some of the following indicators: (1) the number of intraspecific entities, such as subspecies, ecotypes, chromosomal races, and traditional local varieties, which reflects the internal complexity of the gene pool, (2) population size, abundance, and degree of isolation, factors that significantly influence the probability of allele loss, inbreeding, and vulnerability to stochastic events, and (3) the species’ environmental range, defined by the variety of habitats it occupies within the study area (Brown, 2008).
A practical tool for assessing these indicators is the Four-Cell Method (FCA), a participatory analytical approach used to evaluate the distribution and relative abundance of local crop diversity within a community. It allows for the identification of common, unique, and rare plant genetic resources and helps determine which species or varieties may be at risk of genetic erosion, as well as the factors contributing to their vulnerability (Sthapit et al, 2006; Mengistu et al, 2022). This method was later expanded by Padulosi and Dulloo (2012) to include a fifth category, Cell E, to record varieties that local experts consider lost, forming a preliminary red list that requires subsequent validation in the field.
The FCA method, adapted to the specific conditions of each study area, has been effectively applied to identify priority crops and assess their conservation needs (Dansi et al, 2012). It has been used to calculate varietal threat indices and to inform long-term monitoring strategies (Dulloo et al, 2021). In potato-producing communities, the method has helped establish a baseline of local cultivars and develop a preliminary red list of threatened varieties (Valdivia-Díaz et al, 2014). The approach has been tested and recommended by Bioversity International as a tool for identifying endangered genetic resources in Peru and for guiding conservation priorities and payment-for-services schemes for potatoes and other tubers (Drucker and Ramírez, 2022). Furthermore, the FCA method was applied to identify the diversity and consumption of Andean crops in Ecuador (Oyarzun et al, 2013), the diversity of orange sweet potatoes in Uganda, Kenya and Burkina Faso (Christinck et al, 1994), plantain farming systems in Uganda (Kilwinger et al, 2019) and crop diversity and seed systems in 11 rural communities in the Chhattisgarh region of India (Singh et al, 2021). Furthermore, Mulugo et al (2021) proposed practical guidelines for applying this method to interventions in root, tuber, and plantain seed systems.
The potato is an ancestral crop originating in Peru and is characterized by extensive interspecific and intraspecific diversity, the latter reflected in a large number of varieties or cultivars, particularly traditional ones (Ochoa, 2001). Despite this rich agrobiodiversity heritage, several studies have documented a progressive loss of native potato varieties in Peru (Zimmerer, 1991; Valdivia-Díaz, 2014; Seminario et al, 2025). Against this background, the present study addresses four questions: (1) What diversity of potato varieties is currently maintained? (2) Which varieties are particularly vulnerable according to the FCA? (3) Which varieties are reported to have been locally lost? and (4) What farmer-perceived drivers are associated with their loss?
Materials and methods
Study area
The study was conducted in the Cajamarca region of northern Peru, between 4°36′–7°44′ S and 77°44′–79°27′ W (Seminario et al, 2025). The region encompasses a broad altitudinal gradient, extending from 175 to 4,496m a.s.l. (INDECI, 2005). Fieldwork was carried out in 12 rural communities: La Calzada, Chanta Alta, Cumbico, Los Ángeles, La Travesía, Carbón Alto, Huangashanga, Alto Verde, Rodacocha, Chucmar, Cruzpampa, and Morán Alto. These communities are located in high-Andean environments at elevations ranging from 2,747 to 3,857m a.s.l. (Figure 1).
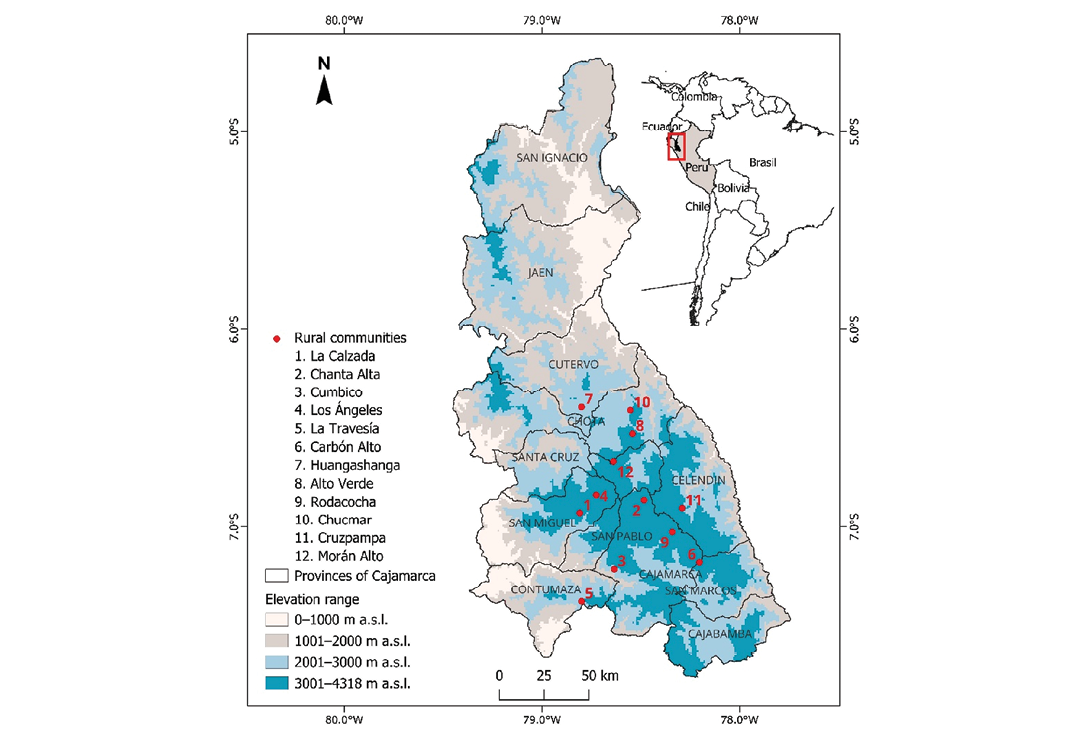
Participatory classification of varieties into the five cells
The assessment of diversity of potato varieties was conducted using the Five-Cell Analysis, a participatory approach developed to assess the abundance and distribution of local crop diversity within farming communities. The method serves two main purposes. First, it identifies common, unique, and rare crop varieties within a given locality based on their relative area of cultivation and the number of households growing them, distinguishing varieties cultivated over large or small areas and by many or few households (Sthapit et al. 2006; Dulloo et al, 2017; 2021). Second, it facilitates the identification of varieties that are no longer cultivated and are considered locally lost, represented by Cell E (Figure 2) (Padulosi and Dulloo, 2012; OXFAM, 2018). In this study, Cell E included potato varieties that farmers identified as lost from the community. To identify potato varieties considered lost by farmers in the studied communities, participants from each community were asked to recall the varieties that had ceased to be cultivated over approximately the previous 25 years (1990–2025). Accordingly, varietal loss was defined at the community level, referring specifically to the absence of a variety from the rural community in which it was reported, rather than from the entire study region. The total number of lost varieties reported for the study therefore represents the aggregate across all rural communities evaluated. The retrospective nature of this assessment may be subject to recall bias, as farmers’ recollections may influence the identification and timing of varietal loss; this constitutes a potential limitation of the study.
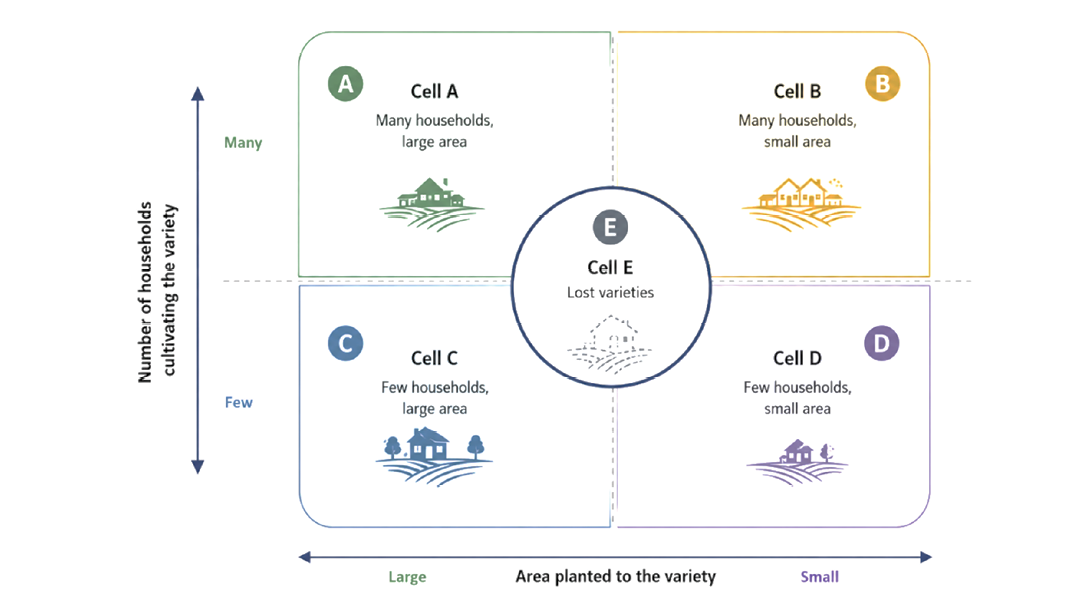
Identification and inventory of potato varieties
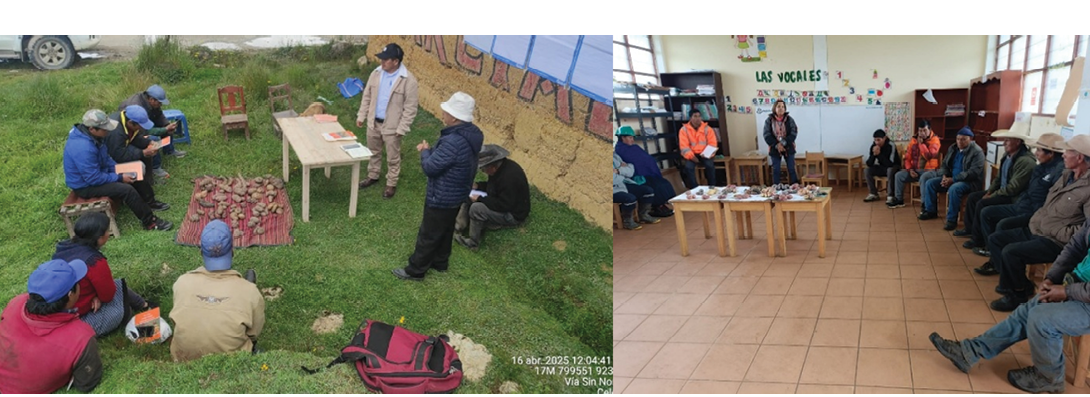
Participatory workshops were conducted with male and female farmers who were locally recognized for their knowledge and experience in potato cultivation and for their involvement in the conservation of varietal diversity, either currently or in previous years (Figure 3). Participants were identified and invited in coordination with collaborating institutions in each study locality. Selection prioritized farmers with extensive experience in crop management who were recognized within their communities for maintaining a high diversity of potato varieties. This approach was intended to ensure that the information collected reflected locally held knowledge of potato varietal diversity and its management. Whenever possible, each participant was asked to bring one or two representative tubers of each cultivated variety to the workshop. However, this was not feasible in all cases because of seasonal availability and the timing of the workshops, which were conducted between March 2024 and June 2025. For varieties that were not available during the workshops, participants were asked to add to the list the names of varieties that they were unable to bring but continued to cultivate. The number of participants per locality ranged from 8 to 20 (Table 1). The mean age of participants ranged from 43 to 58 years across localities, with individual ages ranging from 28 to 76 years. Overall, 69% of participants were male. Regarding educational attainment, 66% had completed or partially completed primary education, 27% had completed or partially completed secondary education, and 7% had no formal education. Participants collectively reviewed the varieties included in the previously established inventory and reached a consensus on the placement of each variety within the corresponding cell.
Definition of thresholds for planted area and number of households
The thresholds used to distinguish between small and large planted areas and between few and many households were established through consensus among workshop participants. Following the approach described by Sthapit et al (2006), Padulosi and Dulloo (2012) and Mengistu et al (2022), participants defined the thresholds according to the area typically planted with each variety and the number of households cultivating the variety within their community. For planted area, participants initially reported the amount of seed used in terms of bags. These quantities were subsequently converted to hectares using the agreed-upon parameters: a seed-bag weight of 90kg, an average seed-tuber weight of 40g, and an average planting density of 27,778 plants per hectare. Based on these criteria, the threshold for a small planted area ranged from 0.04ha (equivalent to 0.5 bags of seed) to 0.81ha (equivalent to 10 bags of seed), with an overall mean threshold of 0.20ha. Similarly, the threshold for a small number of households ranged from 8 to 15 families, with an overall mean of 11 families (Table 1). Areas and numbers of households exceeding the threshold values represent a large cultivation area and many households.
Table 1. Rural communities participating in this study, participant characteristics, and locally defined threshold values used in the Four-Cell Method.
|
Rural communities and their coordinates (Latitude, Longitude) |
Province |
Elevation (m a.s.l.) |
Participants |
Thresholds values |
||
|
Number |
Average age |
Small area (ha) |
Few families |
|||
|
La Calzada (-6.928419, -78.808693) |
San Miguel |
3,300 |
17 |
49 |
0.04 |
9 |
|
Chanta Alta (-6.863307039, -78.48343713) |
Cajamarca |
3,438 |
18 |
43 |
0.08 |
10 |
|
Cumbico (-7.213842391, -78.63401676) |
Cajamarca |
2,588 |
12 |
57 |
0.04 |
12 |
|
Los Ángeles (-6.838001874; -78.72539855) |
San Miguel |
3,386 |
20 |
52 |
0.81 |
10 |
|
La Travesía (-7.380161358, -78.7994847) |
Contumazá |
2,941 |
10 |
53 |
0.24 |
8 |
|
Carbón Alto (-7.1775; -78.1971) |
San Marcos |
3,857 |
10 |
50 |
0.24 |
8 |
|
Huangashanga (-6.396218327, -78.79982406) |
Cutervo |
2,747 |
8 |
44 |
0.4 |
15 |
|
Alto Verde (-6.530517733; -78.54177033) |
Chota |
3,487 |
18 |
48 |
0.12 |
10 |
|
Rodacocha (-7.027859345, -78.34089839) |
Cajamarca |
3,616 |
11 |
55 |
0.08 |
12 |
|
Chucmar (-6.412356659, -78.55285945) |
Chota |
2,973 |
20 |
58 |
0.08 |
10 |
|
Cruzpampa (-6.903689536, -78.29085249) |
Celendín |
3,577 |
10 |
46 |
0.08 |
10 |
|
Morán Alto (-6.669762739, -78.63841671) |
Hualgayoc |
3,653 |
15 |
51 |
0.2 |
12 |
|
Average |
51 |
0.2 |
11 |
|||
Standardization of names
We standardized variety names based on the local knowledge and terminology reported by the participants. All variety names are presented in Spanish. During the interviews, participants were asked to identify alternative names (synonyms) and variants associated with each variety. When multiple names referred to the same variety, the name most frequently used by participants or agreed upon by consensus was adopted as the standardized designation. Conversely, when the same name was used to refer to distinct varieties (homonyms), these were differentiated by assigning sequential numbers (e.g. Negra 1 and Negra 2; Pañuelita 1 and Pañuelita 2) to avoid ambiguity. This procedure standardized the farmer-recognized varietal diversity documented in the study; therefore, the resulting classification reflects locally recognized varieties and their nomenclature rather than genetically characterized diversity, as no molecular or other direct genetic assessment was performed.
Native potato varieties were defined as traditional farmer-maintained cultivars that have been selected and conserved over generations within Andean farming systems and are characterized by substantial phenotypic and genetic diversity and adaptation to local agroecological conditions. In contrast, modern varieties were defined as improved cultivars developed through formal breeding programmes and subsequently released for cultivation, generally involving the selection and recombination of traits related to agronomic performance, adaptation, quality, or resistance (Spooner et al, 2005; Condori et al, 2010). This distinction reflects the contrasting processes through which the varieties have been developed and maintained rather than a strict taxonomic classification. The modern varieties are denoted by the superscript M.
Varietal contribution by four-cell category
For each cell, the relative contribution of each potato variety to the varietal composition was calculated from its mean abundance among the corresponding observations, following a relative contribution approach previously used to quantify the proportional importance of individual taxa within a community (Reiss and Schmid-Araya, 2007). For variety i, the relative contribution (δ̄ᵢ) was calculated as:
δ̄ᵢ = Aᵢ / Σ Aᵢ
Where Aᵢ is the mean abundance of variety i within a given cell and ΣAᵢ is the sum of the mean abundances of all varieties assigned to that cell. The contribution of each variety was then expressed as a percentage:
Contributionᵢ (%) = δ̄ᵢ × 100
This calculation was performed independently for Cells A–D; consequently, the contribution percentages within each cell sum to approximately 100%, with minor deviations attributable to rounding. The analyses were performed using RStudio software (R Core Team, 2024). The analysis was used to identify the varieties that represented the largest proportional shares of the observed varietal composition within each cultivation category. Because these values are derived directly from mean abundance, they should be interpreted as relative abundance contributions rather than as contributions to between-community dissimilarity or similarity.
Participatory identification of factors potentially contributing to varietal loss
We conducted an exploratory survey during participatory workshops to identify factors that may be associated with the loss of potato cultivars in the rural communities. Five thematic blocks were considered to explore potential associations with varietal loss:
- The relative prevalence of modern and native commercial varieties, recent changes in the area under potato cultivation, production destination, and changes in land use, particularly those involving pasture expansion
- Trends toward livestock farming at the expense of agriculture and other economic activities, together with the factors potentially contributing to this process
- The presence of government social programmes and non-governmental organization projects, as well as the number of local organizations, considering the time demands that these activities may place on households
- The presence of mining activities, including formal, artisanal, and informal operations, in the context of their expansion in the region
- Household composition, availability of labour for agricultural activities, and the presence of migrant family members, which may be related to the maintenance and conservation of potato cultivars.
Results
Potato diversity currently maintained in the rural communities under study
Across the 12 rural communities evaluated, 185 potato varieties currently under cultivation were initially recorded. After removing duplicates and standardizing local names, 151 unique varieties with consensual names were identified, comprising 23 modern varieties and 128 native varieties. Among the native varieties, 27 belonged to the ‘chaucha’ or phureja group, which is characterized by early maturity and the absence of tuber dormancy. The highest number of varieties was recorded in Cruzpampa (53 varieties) and Carbón Alto (46), whereas Huangashanga (13), La Travesía (12) and Morán Alto (12) had the lowest numbers of varieties. The distribution of varieties among the cells varied across the rural communities. Cell D, comprising varieties cultivated in small areas by a limited number of households, consistently contained the highest number of varieties across the communities, whereas the remaining cells showed alternating patterns in varietal representation (Figure 4).
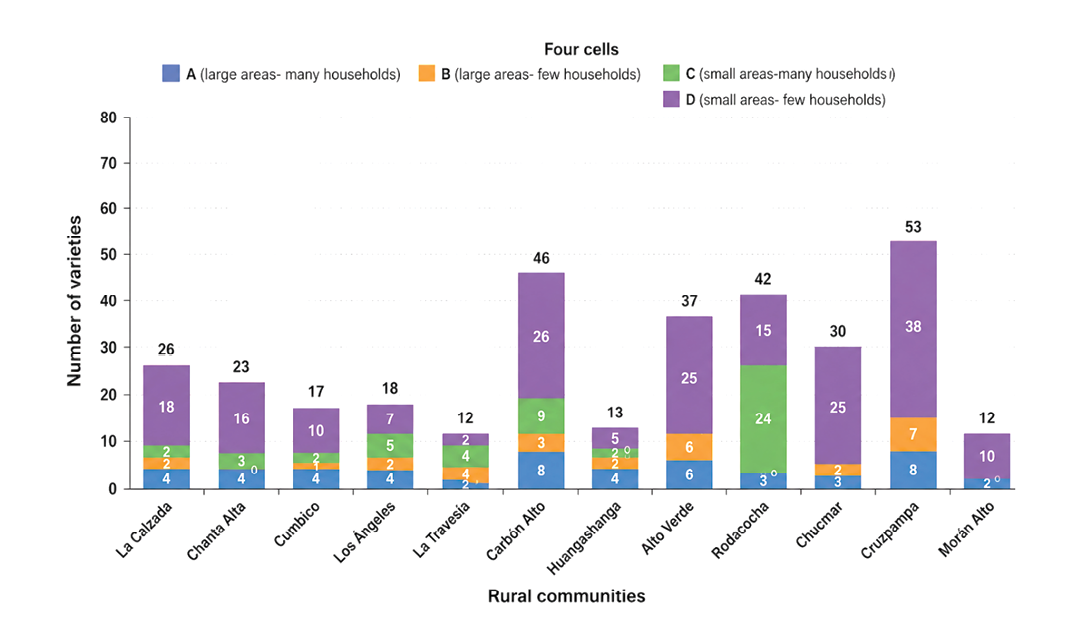
Participatory classification of varieties
Cell A: Potato varieties cultivated by many households across a large area
Cell A comprised 16 potato varieties, including 10 native and 6 modern varieties (denoted by the superscript M). AceitunaM showed the highest mean abundance (12) and the greatest relative contribution to the compositional pattern of the cell (9.92%). AmarilisM and Chaucha Amarilla Redonda followed, each with a mean abundance of 11 and a contribution of 9.09%. Peruanita had a mean abundance of 10 and contributed 8.26%, whereas CanchánM had a mean abundance of 9 and contributed 7.44%. Huagalina, Huayro, and ÚnicaM each had a mean abundance of 8 and contributed 6.61%. Chiquibonita, Huevo de Indio, LiberteñaM, and RenacimientoM each had a mean abundance of 7 and contributed 5.79%. Colegiala, Colorada, and Sapa Negra each had a mean abundance of 5 and contributed 4.13%. Alianza exhibited the lowest mean abundance (1) and the lowest relative contribution (0.83%). Overall, the distribution of mean abundance and contribution indicates variation in the representation of potato varieties within Cell A, with AceitunaM showing the highest values and Alianza the lowest (Table 2).
Table 2. Mean abundance and relative contribution of potato varieties to the compositional patterns observed in Cell A. The modern varieties are denoted by the superscript M.
|
N.º |
Variety |
Mean abundance |
Mean contribution (δ̄ᵢ) |
Contribution (%) |
|
1 |
AceitunaM |
12 |
0.099 |
9.92 |
|
2 |
AmarilisM |
11 |
0.091 |
9.09 |
|
3 |
Chaucha Amarilla Redonda |
11 |
0.091 |
9.09 |
|
4 |
Peruanita |
10 |
0.083 |
8.26 |
|
5 |
CanchánM |
9 |
0.074 |
7.44 |
|
6 |
Huagalina |
8 |
0.066 |
6.61 |
|
7 |
Huayro |
8 |
0.066 |
6.61 |
|
8 |
ÚnicaM |
8 |
0.066 |
6.61 |
|
9 |
Chiquibonita |
7 |
0.058 |
5.79 |
|
10 |
Huevo de Indio |
7 |
0.058 |
5.79 |
|
11 |
LiberteñaM |
7 |
0.058 |
5.79 |
|
12 |
RenacimientoM |
7 |
0.058 |
5.79 |
|
13 |
Colegiala |
5 |
0.041 |
4.13 |
|
14 |
Colorada |
5 |
0.041 |
4.13 |
|
15 |
Sapa Negra |
5 |
0.041 |
4.13 |
|
16 |
Alianza |
1 |
0.008 |
0.83 |
Cell B: Potato varieties cultivated by many households across a small area
Cell B comprised nine potato varieties, including four modern and five native varieties. YungayM and PerricholiM showed the highest mean abundances (9 and 8, respectively) and together accounted for 58.62% of the relative contribution. Sureña contributed 10.34%, whereas Carnera, Chaucha Ambo, and Pico de Pato each contributed 6.90%. Aliso Mahuay, LuyanitaM, and Pallay PonchoM each contributed 3.45% (Table 3). Thus, varietal representation in Cell B was predominantly associated with YungayM and PerricholiM.
Table 3. Mean abundance and relative contribution of potato varieties to the compositional patterns observed in Cell B. The modern varieties are denoted by the superscript M.
|
N.º |
Variety |
Mean abundance |
Mean contribution (δ̄ᵢ) |
Contribution (%) |
|
1 |
YungayM |
9 |
0.310 |
31.03 |
|
2 |
PerricholiM |
8 |
0.276 |
27.59 |
|
3 |
Sureña |
3 |
0.103 |
10.34 |
|
4 |
Carnera |
2 |
0.069 |
6.90 |
|
5 |
Chaucha Ambo |
2 |
0.069 |
6.90 |
|
6 |
Pico de Pato |
2 |
0.069 |
6.90 |
|
7 |
Aliso Mahuay |
1 |
0.034 |
3.45 |
|
8 |
LuyanitaM |
1 |
0.034 |
3.45 |
|
9 |
Pallay PonchoM |
1 |
0.034 |
3.45 |
Cell C: Potato varieties cultivated by few households across a large area
Cell C contained 29 potato varieties, comprising four native and 25 modern varieties. Limeña and Sapa Blanca showed the highest mean abundances (8 and 7, respectively) and contributed 15.09% and 13.21% to the compositional pattern. Lengua de Vaca and Chaucha Amarilla Larga contributed 7.55% and 5.66%, respectively, while six varieties each contributed 3.77%. The remaining 18 varieties had a mean abundance of 1, and each contributed 1.89% (Table 4). Thus, Cell C exhibited relatively high varietal richness but an uneven distribution of relative contributions, with Limeña and Sapa Blanca accounting for the largest individual shares.
Table 4. Mean abundance and relative contribution of potato varieties to the compositional patterns observed in Cell C. The modern varieties are denoted by the superscript M.
|
N.º |
Variety |
Mean abundance |
Mean contribution (δ̄ᵢ) |
Contribution (%) |
|---|---|---|---|---|
|
1 |
Limeña |
8 |
0.151 |
15.09 |
|
2 |
Sapa Blanca |
7 |
0.132 |
13.21 |
|
3 |
Lengua de Vaca |
4 |
0.075 |
7.55 |
|
4 |
Chaucha Amarilla Larga |
3 |
0.057 |
5.66 |
|
5 |
Cacho de Toro |
2 |
0.038 |
3.77 |
|
6 |
Chimbina Colorada |
2 |
0.038 |
3.77 |
|
7 |
Limeña Negra |
2 |
0.038 |
3.77 |
|
8 |
MarivaM |
2 |
0.038 |
3.77 |
|
9 |
Shingula |
2 |
0.038 |
3.77 |
|
10 |
TarmeñaM |
2 |
0.038 |
3.77 |
|
11 |
Bretaña |
1 |
0.019 |
1.89 |
|
12 |
Camotera |
1 |
0.019 |
1.89 |
|
13 |
Chimbina Oque |
1 |
0.019 |
1.89 |
|
14 |
Colorada Pintada |
1 |
0.019 |
1.89 |
|
15 |
Huamantanga |
1 |
0.019 |
1.89 |
|
16 |
Huevo de Chivo |
1 |
0.019 |
1.89 |
|
17 |
Huevo de Toro |
1 |
0.019 |
1.89 |
|
18 |
MolineraM |
1 |
0.019 |
1.89 |
|
19 |
Morada |
1 |
0.019 |
1.89 |
|
20 |
Moropollo |
1 |
0.019 |
1.89 |
|
21 |
Ojo de Oso |
1 |
0.019 |
1.89 |
|
22 |
Porpora |
1 |
0.019 |
1.89 |
|
23 |
Roja |
1 |
0.019 |
1.89 |
|
24 |
Sinchada |
1 |
0.019 |
1.89 |
|
25 |
Sinchada Amarilla |
1 |
0.019 |
1.89 |
|
26 |
Sinchada Negra |
1 |
0.019 |
1.89 |
|
27 |
TomasaM |
1 |
0.019 |
1.89 |
|
28 |
Yuquilla Colorada |
1 |
0.019 |
1.89 |
|
29 |
Zamba Señora |
1 |
0.019 |
1.89 |
Cell D: Potato varieties cultivated by few households across a small area (varietal vulnerability)
Cell D comprised 97 potato varieties, representing the highest varietal richness among the four cells. Chaucha Negra 1 showed the highest mean abundance (5) and relative contribution (4.55%), followed by Clavelilla (3; 2.73%). Thirteen additional varieties each contributed 1.82%, whereas the remaining varieties had a mean abundance of 1 and contributed 0.91% each (Table 5; Figure 5). Thus, Cell D exhibited a highly dispersed varietal composition, with no individual variety accounting for a substantial share of the total contribution.
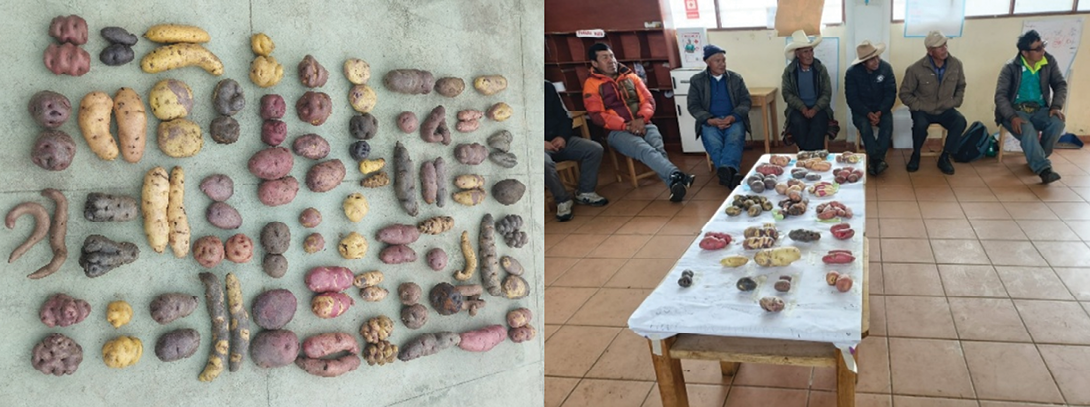
Table 5. Mean abundance and relative contribution of potato varieties to the compositional patterns observed in Cell D. The modern varieties are denoted by the superscript M.
|
N.º |
Variety |
Mean abundance |
Mean contribution (δ̄ᵢ) |
Contribution (%) |
|---|---|---|---|---|
|
1 |
Chaucha Negra 1 |
5 |
0.045 |
4.55 |
|
2 |
Clavelilla |
3 |
0.027 |
2.73 |
|
3 |
Canastera |
2 |
0.018 |
1.82 |
|
4 |
Canilla de Buitre |
2 |
0.018 |
1.82 |
|
5 |
Chaucha Colorada |
2 |
0.018 |
1.82 |
|
6 |
Chaucha Roja |
2 |
0.018 |
1.82 |
|
7 |
Clavelilla Negra |
2 |
0.018 |
1.82 |
|
8 |
Grandibonita |
2 |
0.018 |
1.82 |
|
9 |
Mishunga Blanca |
2 |
0.018 |
1.82 |
|
10 |
Ollera |
2 |
0.018 |
1.82 |
|
11 |
Rana |
2 |
0.018 |
1.82 |
|
12 |
RevoluciónM |
2 |
0.018 |
1.82 |
|
13 |
Rodilla de Viuda |
2 |
0.018 |
1.82 |
|
14 |
Santo Domingo |
2 |
0.018 |
1.82 |
|
15 |
Ahogadora Morada |
1 |
0.009 |
0.91 |
|
16 |
Añil |
1 |
0.009 |
0.91 |
|
17 |
AtahualpaM |
1 |
0.009 |
0.91 |
|
18 |
Avellana |
1 |
0.009 |
0.91 |
|
19 |
Beso de Novia |
1 |
0.009 |
0.91 |
|
20 |
Bola de Potro |
1 |
0.009 |
0.91 |
|
21 |
Cacho de Venao |
1 |
0.009 |
0.91 |
|
22 |
Calabacera |
1 |
0.009 |
0.91 |
|
23 |
Camarona |
1 |
0.009 |
0.91 |
|
24 |
Canchán BlancaM |
1 |
0.009 |
0.91 |
|
25 |
Cashpada |
1 |
0.009 |
0.91 |
|
26 |
Centro Morado |
1 |
0.009 |
0.91 |
|
27 |
Cero 21M |
1 |
0.009 |
0.91 |
|
28 |
Chaucha Blanca |
1 |
0.009 |
0.91 |
|
29 |
Chaucha Granate |
1 |
0.009 |
0.91 |
|
30 |
Chaucha Huamantanga |
1 |
0.009 |
0.91 |
|
31 |
Chaucha Huayro |
1 |
0.009 |
0.91 |
|
32 |
Chaucha Huevo de Perdiz |
1 |
0.009 |
0.91 |
|
33 |
Chaucha Huevo de Ruco |
1 |
0.009 |
0.91 |
|
34 |
Chaucha Limeña |
1 |
0.009 |
0.91 |
|
35 |
Chaucha Morada |
1 |
0.009 |
0.91 |
|
36 |
Chaucha Montañera |
1 |
0.009 |
0.91 |
|
37 |
Chaucha Negra 2 |
1 |
0.009 |
0.91 |
|
38 |
Chaucha Pabla |
1 |
0.009 |
0.91 |
|
39 |
Chaucha Peruanita |
1 |
0.009 |
0.91 |
|
40 |
Chaglina- INIAM |
1 |
0.009 |
0.91 |
|
41 |
Chata Roja |
1 |
0.009 |
0.91 |
|
42 |
Chiquibonita Blanca |
1 |
0.009 |
0.91 |
|
43 |
Chiricha |
1 |
0.009 |
0.91 |
|
44 |
Chocolatera |
1 |
0.009 |
0.91 |
|
45 |
ChucmarinaM |
1 |
0.009 |
0.91 |
|
46 |
Clavelilla Española |
1 |
0.009 |
0.91 |
|
47 |
Clavelilla Roja |
1 |
0.009 |
0.91 |
|
48 |
Clavelina |
1 |
0.009 |
0.91 |
|
49 |
Cojón de Burro |
1 |
0.009 |
0.91 |
|
50 |
Combaina |
1 |
0.009 |
0.91 |
|
51 |
Conda |
1 |
0.009 |
0.91 |
|
52 |
Cucula |
1 |
0.009 |
0.91 |
|
53 |
Culebrita |
1 |
0.009 |
0.91 |
|
54 |
Curao |
1 |
0.009 |
0.91 |
|
55 |
Curao blanco |
1 |
0.009 |
0.91 |
|
56 |
Cuaro Oque |
1 |
0.009 |
0.91 |
|
57 |
Cuaro Sureño |
1 |
0.009 |
0.91 |
|
58 |
Doralinda |
1 |
0.009 |
0.91 |
|
59 |
Hallada |
1 |
0.009 |
0.91 |
|
60 |
Hila |
1 |
0.009 |
0.91 |
|
61 |
Huacra |
1 |
0.009 |
0.91 |
|
62 |
Huacra Blanca |
1 |
0.009 |
0.91 |
|
63 |
Huancaina |
1 |
0.009 |
0.91 |
|
64 |
Huayro Blanca |
1 |
0.009 |
0.91 |
|
65 |
Kekorani |
1 |
0.009 |
0.91 |
|
66 |
Limeña Peruana |
1 |
0.009 |
0.91 |
|
67 |
Limeña Roja |
1 |
0.009 |
0.91 |
|
68 |
Lombriz |
1 |
0.009 |
0.91 |
|
69 |
LurenM |
1 |
0.009 |
0.91 |
|
70 |
Machala |
1 |
0.009 |
0.91 |
|
71 |
Maga |
1 |
0.009 |
0.91 |
|
72 |
Mano de Obrero |
1 |
0.009 |
0.91 |
|
73 |
MerpataM |
1 |
0.009 |
0.91 |
|
74 |
Mona |
1 |
0.009 |
0.91 |
|
75 |
Nariz de Toro |
1 |
0.009 |
0.91 |
|
76 |
Nativicha |
1 |
0.009 |
0.91 |
|
77 |
Ojo de Venao |
1 |
0.009 |
0.91 |
|
78 |
Pagadroga |
1 |
0.009 |
0.91 |
|
79 |
Panchitas |
1 |
0.009 |
0.91 |
|
80 |
Panera |
1 |
0.009 |
0.91 |
|
81 |
Pañuelita |
1 |
0.009 |
0.91 |
|
82 |
Peruanita Larga |
1 |
0.009 |
0.91 |
|
83 |
Piña |
1 |
0.009 |
0.91 |
|
84 |
Platanera |
1 |
0.009 |
0.91 |
|
85 |
Pollera |
1 |
0.009 |
0.91 |
|
86 |
Prada |
1 |
0.009 |
0.91 |
|
87 |
Pumamaqui |
1 |
0.009 |
0.91 |
|
88 |
Riñonera |
1 |
0.009 |
0.91 |
|
89 |
Sangre de Toro |
1 |
0.009 |
0.91 |
|
80 |
Santa María |
1 |
0.009 |
0.91 |
|
91 |
Sentada |
1 |
0.009 |
0.91 |
|
92 |
Shatuca Blanca |
1 |
0.009 |
0.91 |
|
93 |
Suela |
1 |
0.009 |
0.91 |
|
94 |
Sumac Sunco |
1 |
0.009 |
0.91 |
|
95 |
Yungay RojaM |
1 |
0.009 |
0.91 |
|
96 |
Yuquilla Blanca |
1 |
0.009 |
0.91 |
|
97 |
Zarca Gordita |
1 |
0.009 |
0.91 |
Varieties reported as lost in the study communities
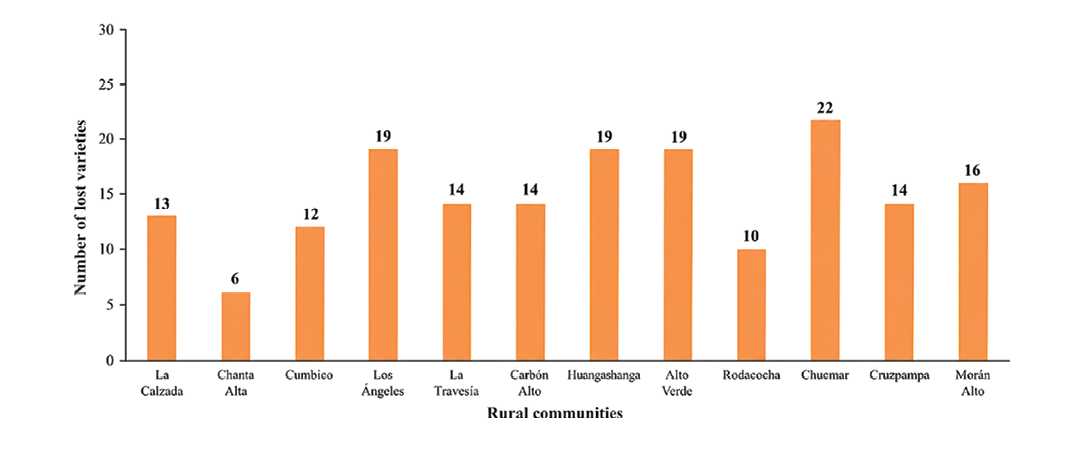
Cell E comprised potato varieties that farmers considered to have been locally lost between approximately 1990 and 2025 in the study communities. Across the 12 rural communities, 199 records of lost varieties were documented. After removing duplicate records, 50 distinct potato varieties were identified. The highest numbers of records were reported in Chucmar (22), Huangashanga (19), Alto Verde (19), and Los Ángeles (19) (Figure 6). Of the 50 varieties, 41 were native and 9 were modern. The varieties reported as lost were: Aliso Colorada, AmapolaM, Ampay, AntarquiM, Bella, Chaucha ecuatoriana, Chaucha Huagalina, Chaucha Llanqui, Chaucha Pañuelita, Chaucha Porpora, Chilena, Chupurka, Costeña, Cotosique, Crespa, Curao Blanco, Cuaro Oque, Curao Sureño, Cusqueña, HuarenaM, Huayro Amarilla, IntiM, KoriM, Llanqueja, Maguey, Manzana, María HuancaM, Mi PerúM, Montañera, Noria, Perla, Perrita, Picuda, Picusha, Pierna de Viuda, Quilgayana, Ranrairca, Reina, Reina Blanca, Renacimiento BlancaM, Rompe Queso, Rucucunga, Shiga, Shoga Blanca, Sipa VirúM, Trola de Coche, Tumbay, Verdolaga, Washipuma, Yuquilla Negra.
Factors potentially associated with varietal loss
The socioeconomic factors potentially associated with potato varietal loss in the rural communities under study were grouped into five aspects (Table 6):
- Potato cultivar prevalence and land-use dynamics: across the 12 rural communities, modern and commercially cultivated native varieties predominated over other native varieties; in eight communities, potato cultivation area tended to decline, production was primarily oriented toward household consumption, and land use increasingly favoured pasture establishment.
- Livestock expansion and agricultural change: in eight communities, livestock farming tended to predominate, with 44% of working hours devoted to livestock activities and 56% to agriculture and other tasks. This pattern coincided with dairy-related infrastructure, including large milk collection centres in four communities and smaller centres in 11, as well as livestock-support projects in three communities. Government interventions led by Agrorural, the Ministry of Agriculture, and local governments have focused on strengthening the dairy supply chain and promoting dairy enterprises, potentially reducing the relative emphasis on subsistence agriculture and the maintenance of native potato varieties
- Social programmes, NGO interventions, and local organizations: all 12 communities had state social programmes and community organizations operating concurrently. Programmes such as Juntos, Pensión 65, Comedores Populares, Cuna Más, Vaso de Leche, Wasi Mikuna, and the Social Energy Inclusion Fund (FISE), together with participation in peasant patrols, producer associations, water and sanitation management boards (JASS), irrigation boards, and religious groups, may increase organizational demands on rural households, although these initiatives also contribute to reducing economic vulnerability.
- Mining activity and territorial expansion: formal mining was identified in three communities and informal or artisanal mining in two; the expansion of these activities may place additional pressure on traditional agricultural systems by diverting labour from farming and potentially reducing continuity in native potato cultivation practices.
- Household labour availability and family migration: households comprised an average of five members, of whom two actively participated in agricultural work, while one member had migrated on average. This household structure may limit labour availability for agricultural activities and, potentially, for the maintenance of diverse potato varieties.
Table 6. Factors that could potentially contribute to the loss of potato varieties. S, self-consumption; M, market; Δ, Of the eight most widely grown varieties in this area, only one was a modern variety; the rest were native commercial varieties. Each colour represents a socioeconomic aspect.
|
|
Potato cultivar prevalence and land-use dynamics |
Livestock expansion and drivers of agricultural change |
Social programmes, NGO interventions, and local organizations |
Mining activity and territorial expansion |
Household labour availability and family migration |
||||||||||||
|
Predominance of modern and native commercial varieties |
Potato-growing area has decreased over the past 20 years |
Main destination for the potato harvest |
Changes in land use over the past years |
A clear trend toward livestock farming |
Time: crops + other activities/livestock (%) |
Large milk collection companies |
Small milk collection companies |
Livestock Support Project |
Average number of cattle per household |
Number of State Social Programmes |
Number of local social organizations |
Formal mining project |
Artisanal and informal mining |
Number of people in the household |
Number of people working on the farm/in the household |
Number of migrants per household |
|
|
Yes |
Yes |
S |
Yes |
Yes |
70/30 |
No |
Yes |
No |
7 |
9 |
5 |
No |
No |
4 |
2 |
0 |
|
|
Chanta Alta |
Yes |
Yes |
S |
Yes |
Yes |
40/60 |
Yes |
Yes |
Yes |
15 |
4 |
1 |
Yes |
Yes |
4 |
2 |
2 |
|
Cumbico |
Yes |
Yes |
S |
Yes |
No |
70/30 |
No |
Yes |
No |
5 |
6 |
3 |
No |
No |
5 |
2 |
1 |
|
Los Ángeles |
Yes |
Yes |
M |
Yes |
Yes |
40/60 |
Yes |
Yes |
No |
12 |
5 |
2 |
No |
No |
7 |
4 |
2 |
|
La Travesía |
Yes |
No |
M |
No |
No |
40/60 |
No |
No |
No |
4 |
6 |
2 |
No |
No |
5 |
2 |
1 |
|
Carbón AltoΔ |
Yes |
Yes |
S |
No |
Yes |
50/50 |
Yes |
Yes |
No |
8 |
5 |
2 |
No |
No |
5 |
2 |
2 |
|
Huangashanga |
Yes |
Yes |
S |
Yes |
Yes |
70/30 |
No |
Yes |
No |
5 |
7 |
4 |
No |
No |
4 |
2 |
1 |
|
Alto Verde |
Yes |
No |
M |
Yes |
Yes |
50/50 |
No |
Yes |
Yes |
6 |
6 |
3 |
No |
No |
4 |
1 |
1 |
|
Rodacocha |
Yes |
Yes |
S |
Yes |
Yes |
40/60 |
Yes |
Yes |
Yes |
10 |
6 |
5 |
Yes |
No |
4 |
1 |
2 |
|
Chucmar |
Yes |
No |
M |
No |
No |
60/40 |
No |
Yes |
No |
7 |
6 |
3 |
No |
No |
4 |
2 |
1 |
|
Cruzpampa |
Yes |
Yes |
S |
No |
Yes |
50/50 |
No |
Yes |
No |
8 |
7 |
3 |
Yes |
No |
5 |
3 |
1 |
|
Morán Alto |
Yes |
No |
S |
Yes |
No |
75/25 |
No |
Yes |
No |
6 |
4 |
3 |
No |
Yes |
7 |
3 |
2 |
|
Average |
|
|
|
|
|
56/44 |
|
|
|
8 |
6 |
3 |
|
|
5 |
2 |
1 |
Discussion
Diversity of potato varieties
Across the 12 rural communities assessed in Cajamarca, 153 potato varieties were recorded, including 135 native and 18 modern varieties. This level of diversity is comparable to that reported elsewhere in the Peruvian Andes, with 96 varieties documented in a locality of Pasco (Arce et al, 2019), 260 across six rural communities in Cusco (Cossio, 2006), and 296 across 35 communities in Huánuco (Egúsquiza, 2015). The predominance of native varieties is consistent with national patterns, where modern varieties constitute a relatively small fraction of cultivated diversity despite occupying a larger proportion of the agricultural area (Pradel et al, 2017). Among the modern varieties identified, ’Renacimiento’ is particularly notable as the first improved potato variety developed in Peru (Egúsquiza, 2000).
Northern Peru has received comparatively less attention in studies of native potato diversity and conservation than central and southern Peru. Nevertheless, the substantial varietal diversity recorded in Cajamarca suggests that the region may represent an important reservoir of potato genetic resources. Although Cajamarca has not been identified as a priority area for native potato conservation and monitoring (Dawson et al, 2023), it harbours a moderate diversity of wild potato relatives (MINAM, 2019; Dawson et al, 2023). These findings support greater consideration of Cajamarca in future efforts to document, monitor, and conserve potato agrobiodiversity.
Vulnerable varieties
Sixty-four percent of the potato varieties recorded in this study were classified in Cell D, suggesting a potentially high level of varietal vulnerability associated with cultivation by few households across small cultivated areas. This pattern is consistent with observations from Bolivia (Platform for Agrobiodiversity Research [PAR], 2018) and India (Singh et al, 2021), where a large proportion of local varieties also occurred within this risk category. Particularly noteworthy are the chaucha potato varieties, for which fewer than 50% of those previously reported in Cajamarca were recorded in the present study (Seminario and Zarpán, 2011; Seminario et al, 2025). Of the chaucha varieties recorded here, 14 were classified in Cell D, further indicating their potential vulnerability to varietal loss.
Varieties reported as lost
We identified 50 potato varieties that were potentially lost in the study communities, representing approximately 24.6% of the recorded diversity. This finding is consistent with the decline reported for chaucha potatoes in Cajamarca, where a 17% reduction was documented between 1990 and 2010 (Seminario et al, 2025), and with losses reported in Colombia, including 15% of Solanum tuberosum subsp. andigena and 5% of S. phureja over a 14-year period (Moreno and Valbuena, 2006). Collectively, these findings provide evidence of varietal loss across Andean potato systems and support the need to strengthen conservation and monitoring efforts for potentially at-risk varieties (Padulosi and Dulloo, 2012).
Factors potentially associated with varietal loss
The loss of potato varieties likely reflects the interaction of social, economic and environmental processes whose effects are complex and context-dependent (Khoury et al, 2022). In Cajamarca, five interrelated aspects may be particularly relevant:
Productive transition and biophysical constraints: the predominance of modern and commercially cultivated native varieties among subsistence farmers may reflect preferences for higher productivity and income opportunities when market prices are favourable (Ortíz et al, 1999), potentially displacing traditional native varieties, as reported elsewhere in the Andes (Ortíz et al, 1999; De Haan and Thiele, 2004; Seminario et al, 2025). This transition occurs alongside persistent constraints, including weak seed systems for native varieties, pests and diseases, low temperatures, and irregular rainfall (Zimmerer, 1991; De Haan and Thiele, 2004; Seminario and Zarpán, 2011; Seminario et al, 2025).
Dairy intensification: the expansion of dairy farming may influence land-use and crop-management decisions, particularly where milk production represents a major source of household income. National milk production increased by 4.5% annually between 1996 and 2023, while smallholder farms in Cajamarca with five to six cows may obtain up to 80% of household income from milk sales (García and Gómez, 2006). The reported replacement of native cattle by specialized breeds, including Holstein, Brown Swiss, and Jersey (INIA, 2021; GRC, 2024), is consistent with the increasing importance of livestock within mixed farming systems since the early 2000s (Winters et al, 2006). Although our findings do not establish a direct causal relationship, these trends suggest that the relative profitability of livestock may potentially reduce the allocation of land and labour to potato cultivation.
Social programmes and organizational demands: household participation in government social programmes and community organizations may affect labour allocation. In our study, households participated in an average of two to three social programmes and devoted approximately 24–40 hours per month to meetings and associated obligations, potentially reducing time available for agricultural activities. This pattern is broadly consistent with national estimates indicating that 61% of households participate in at least one social programme, requiring approximately 8–21 hours per month for related activities (INEI, 2019).
Mining and employment opportunities: formal mining activities involving three companies and informal or artisanal mining in two communities may compete with agriculture for household labour by providing alternative employment and, in some cases, higher wages (Cano and Quiñón, 2021). However, within the communities studied, mining appeared to represent a comparatively smaller potential influence than other structural changes in agricultural livelihoods.
Household labour availability and migration: households averaged five members (INEI, 2024), with one to three directly engaged in farm work and approximately one permanent migrant per household, in addition to seasonal migration to coastal and jungle areas for employment. This reduction in available agricultural labour may constrain the management of diverse cropping systems and potentially affect the maintenance of cultivated potato diversity (Zimmerer, 1991; Seminario et al, 2025).
Limitations and future research
This study has some limitations that should be considered when interpreting its findings. The identification of locally lost varieties was retrospective and relied on farmers’ recollections, which may introduce recall bias and limit the accuracy of estimates of the timing and extent of varietal loss. The Four-Cell Analysis provides a participatory assessment of varietal abundance and distribution based on cultivated area and the number of farming families maintaining each variety; however, it does not directly quantify genetic diversity or confirm genetic differentiation among locally recognized varieties. Likewise, the factors identified should be interpreted as farmer-perceived factors potentially associated with varietal loss rather than as causal relationships. Future research should combine periodic participatory assessments with field validation of varieties reported as lost, molecular characterization of priority native varieties, and longitudinal monitoring of changes in the number of households cultivating them and the areas allocated to their production. This integrated approach would help validate the preliminary conservation status identified here, establish temporal trajectories of varietal loss, and clarify the interactions among production, socioeconomic, and institutional processes that influence the persistence of native potato diversity.
Conclusions
Participatory assessment in the 12 rural communities identified 151 potato varieties currently maintained, including 128 native and 23 modern varieties; however, 97 varieties (64.2%) were classified in Cell D of the Four-Cell Analysis, indicating that they are cultivated by few households and over small areas, with 14 chaucha varieties particularly represented in this vulnerable category. Farmers additionally reported 50 varieties as locally lost, comprising 41 native and 9 modern varieties. From farmers’ perspectives, varietal loss was associated with the increasing predominance of modern and commercially oriented native varieties, expansion of livestock production and related land-use changes, participation in government social programmes, and declining household labour availability, while mining-related employment appeared to have a comparatively smaller influence. These findings provide a participatory baseline of potato diversity and vulnerability in the study communities, and support continued participatory monitoring and targeted in situ conservation, particularly for varieties maintained by few households and over small areas; nevertheless, the reported losses and associated factors should be interpreted as community-level, retrospective perceptions rather than evidence of regional extinction or demonstrated causal relationships.
Acknowledgements
We thank the National University of Cajamarca for sponsoring this research through the Mining Canon, according to the grant agreement signed on December 11, 2023. We also appreciate the support provided by the collaborating institutions: the Baños del Inca Experimental Station-INIA, the municipalities of Cumbico and Sorochuco, the Michiquillay Mining Fund, the farmers’ associations of La Calzada, Chanta Alta and Carbón Alto, Los Ángeles, and Alto Verde, as well as the NGO ESCAES in Cutervo. We would like to give special recognition to the valuable participation and willingness of the farmers who collaborated in the workshops held during the research.
Author contributions
JFSC, conceptualization, data collection, reviews, approval. KQL, Collection and first draft. AJMG, Data curation, writing. JSH, Data collection and curation. SYRL, Writing and revisions. FEV, Data collection, inter-institutional coordination. YRL, Data collection, administration. JLVO, Data analysis, visualization. WS, Methodology, Visualization, Writing, and Reviews
Ethics statement
The authors declare that this research did not require approval from an ethics committee, as it did not involve clinical or experimental procedures subject to formal ethical review. However, the study was conducted in accordance with the ethical principles applicable to research involving human subjects. Prior to each interview, the research objectives, the voluntary nature of participation, and the option to withdraw at any time without any consequences were explained to the participants in a clear and understandable manner. Informed consent was obtained verbally, using language appropriate to the context of each interviewee. Respect for the dignity, rights, and autonomy of the participants was ensured at all times.
Conflict of interest statement
The authors declare that there are no financial, personal, or professional conflicts of interest that may have influenced the conduct or results of this research.
References
Arce, A., de Haan, S., Juarez, H., Burra, D. D., Plasencia, F., Ccanto, R., Polreich, S., Scurrah, M. (2019). The spatial-temporal dynamics of potato agrobiodiversity in the highlands of central Peru: A case study of smallholder management across farming landscapes. Land, 8 (1), 1–30. https://doi.org/10.3390/land8110169
Brown, A. H. (2008). Indicators of genetic diversity, genetic erosion and genetic vulnerability for plant genetic resources for food and agriculture. FAO, Rome. Thematic background study. https://www.fao.org/4/i1500e/i1500e20.pdf
Cano, A., Quiñón, A. (2021). Superposición del régimen general formal y la minería artesanal informal en el Perú. Explorando las condiciones para su integración. Documento de trabajo N° 3. Centro de estudios sobre Minería y Sostenibilidad. https://cems.up.edu.pe/publicacion/superposicion-del-regimen-general-formal-y-la-mineria-artesanal-informal-en-el-peru-explorando-las-condiciones-para-su-integracion/
Christinck, A., Doka, M., Horneber, G., Rugunda, G., Palé, G., Whitney, C. (1994). From breeding to nutrition: Orange-fleshed sweetpotatoes in farming and food systems of Uganda. https://www.ccrp.org/wp-content/uploads/2019/05/ofsp_case_study.pdf.
Condori, B., Hijmans, R. J., Quiroz, R., Ledent, J. F. (2010). Quantifying the expression of potato genetic diversity in the high Andes through growth analysis and modeling. Field Crops Research, 119 (1), 135-144. https://doi.org/10.1016/j.fcr.2010.07.003
Cossio, P. (2006). Variabilidad de papas nativas en seis comunidades de Calca y Urubamba, Cusco. Asociacion Arariwa. https://es.scribd.com/document/638790755/CUSCO-VARIABILIDAD-NOMINAL-DE-PAPAS-I#google_vignette
Dansi, A., Vodouhè, R., Azokpota, P., Yedomonhan, H., Assogba, P., Adjatin, A., Loko, Y. L., Dossou-Aminon, I., Akpagana, K. (2012). Diversity of the neglected and underutilized crop species of importance in Benin. The Scientific World Journal, ID 932947. https://doi.org/10.1100/2012/932947
Dawson, T., Juarez, H., Maxted, N., de Haan, S. (2023). Identifying priority sites for the on-farm conservation of landraces and systematic diversity monitoring through an integrated multi-level hotspot analysis: the case of potatoes in Peru. Frontiers in Conservation Science, 4. https://doi.org/10.3389/fcosc.2023.1130138
Egúsquiza, R. (2015). Catálogo de papas nativas cultivadas en Huánuco. Universidad Nacional Agraria La Molina, Lima.
Egúsquiza, R. (2000). La papa. Producción, transformación y comercialización. Universidad Nacional Agraria La Molina, Asociación de exportadores. https://books.google.com.pe/s?id=6ciGbBX0uFwC&printsec=frontcover&hl=es#v=onepage&q&f=false
De Haan, S., and Thiele, G. (2004). In situ conservation and potato seed systems in the Andes. In: Jarvis DI, , Sevilla-Panizo R, Chávez-Servia JL, Hodgkin T (Eds.), Seed systems and crop genetic diversity on-farm (pp. 126–132). IPGRI (International Plant Genetic Resources Institute). https://hdl.handle.net/10568/104980
Drucker, A. G., Ramírez, M. (2022). Application of four cell method prioritisation to orient government conservation strategy and PACS interventions on potato and tuber crops in 4 Peruvian regions. https://hdl.handle.net/10568/117587
Dulloo, M. E., Estrada, N., Rana, J. C., Yadav, R., Grazioli, F. (2021). Varietal threat index for monitoring crop diversity on farms in five agro-ecological regions in India. Diversity, 13(11). https://doi.org/10.3390/d13110514
Dulloo, M.E., Rege, J.E.O., Ramirez, M., Drucker, A.G., Padulosi, S., Maxted, N., Sthapit, B., Gauchan, D., Thormann, I., Gaisberger, H., Roux, N., Sardos, J., Ruas, M., and Roward, M. (2017). Conserving agricultural biodiversity for use in sustainable food systems. In: Bioversity International, Mainstreaming agrobiodiversity in sustainable food systems: Scientific foundations for an agrobiodiversity index, 103–140. https://hdl.handle.net/10568/89049
García, O., Gómez, C. A. (2006). The economics of milk production in Cajamarca, Peru, with particular emphasis on small-scale producers. Pro-Poor Livestock Policy Initiative, FAO. https://assets.publishing.service.gov.uk/media/57a08c18e5274a27b2000f97/PPLPIexecsumm_wp34.pdf
GRC (Gobierno Regional de Cajamarca). (2024). Más de siete mil inseminaciones artificiales impulsan la ganadería de Cajamarca. Plataforma del Estado Peruano. https://www.gob.pe/institucion/regioncajamarca/noticias/1037628-mas-de-7-mil-inseminaciones-artificiales-impulsan-la-ganaderia-de-cajamarca
INDECI (Instituto Nacional de Defensa Civil). (2005). Cajamarca. Programa de Prevención y medidas de mitigación ante desastres de la ciudad de Cajamarca. INDECI. https://sigrid.cenepred.gob.pe/sigridv3/storage/biblioteca//5225_programa-de-prevencion-y-medidas-de-mitigacion-ante-desastres-de-la-ciudad-de-cajamarca.pdf
INEI (Instituto Nacional de Estadística e Informática). (2019). Encuesta Nacional de Programas Presupuestales 2011–2019. https://www.inei.gob.pe/media/MenuRecursivo/publicaciones_digitales/Est/Lib1729/libro.pdf
INEI (Instituto Nacional de Estadística e Informática. (2024). Cajamarca. Compendio estadístico 2024. https://www.gob.pe/institucion/inei/informes-publicaciones/6580481-compendio-estadistico-cajamarca-2024
INIA (Instituto Nacional de Innovación Agraria). (2021). INIA presenta programa de mejoramiento genético de ganado para la región de Cajamarca. Gobierno del Perú. https://www.gob.pe/institucion/inia/noticias/572700-inia-presenta-programa-de-mejoramiento-genetico-de-ganado-para-la-region-de-cajamarca
Khoury, C. K., Brush, S., Costich, D. E., Curry, H. A., de Haan, S., Engels, J. M. M., Guarino, L., Hoban, S., Mercer, K. L., Miller, A. J., Nabhan, G. P., Perales, H. R., Richards, C., Riggins, C., Thormann, I. (2022). Crop genetic erosion: understanding and responding to loss of crop diversity. New Phytologist 233 (1), 84–118. https://doi.org/10.1111/nph.17733
Kilwinger, F. B. M., Rietveld, A. M., Groot, J. C. J., Almekinders, C. J. M. (2019). Culturally embedded practices of managing banana diversity and planting material in central Uganda. Journal of Crop Improvement, 33(4), 456–477. https://doi.org/10.1080/15427528.2019.1610822
Kumar, R., Singh, B. (2023). Genetic diversity, conservation, and utilization of plant genetic resources. Genes 14 (1). https://doi.org/10.3390/genes14010174
Maxted, N. and Guarino, L. (2006). Genetic erosion and genetic pollution of crop wild relatives. In: Ford-Lloyd BV, Dias SR, Bettencourt E (Eds). Genetic erosion and pollution assessment methodologies. Proceedings of PGR Forum Workshop 5, Terceira Island, Autonomous Region of the Azores, Portugal, 8–11 September 2004. 35-45. https://hdl.handle.net/10568/104626
Mengistu, D. K., Jarvis, D., Fadda, C. (2022). Participatory diagnostic toolkits and crop improvement approaches: participatory methods to assess and use plant genetic diversity in the field. https://hdl.handle.net/10568/120515
MINAM (Ministerio del Ambiente). (2019). Línea de base de la diversidad genética de la papa peruana con fines de bioseguridad. https://bioseguridad.minam.gob.pe/wp-content/uploads/2019/12/Linea_base_papa_bioseguridad_lowres.pdf
Moreno, J. D., Valbuena, I. (2006). Colección central colombiana de papa: riqueza de variabilidad genética para el mejoramiento del cultivo. Innovación y Cambio Tecnológico, 4(4), 16–24. https://repository.agrosavia.co/bitstream/handle/20.500.12324/563/43711_55403.pdf?sequence=1&isAllowed=y
Mulugo, L., Ajambo, S., Kilulwe, E. (2021). User guide to the four-square method for intervening in root, tuber and banana seed systems. (T. and B. (RTB). CGIAR Research Program on Roots, Ed.). https://doi.org/10.4160/9789290605805
Nagel, M., Dulloo, M. E., Bissessur, P., Gravrilenko, P., Bamberg, J., Ellis, D., Giovannini, P. (2022). Global strategy for the conservation of potato (Global Crop Diversity Trust, Ed.). https://doi.org/10.5447/ipk/2022/29
Ochoa, C. M. (2001). Las papas de Sudamérica: Bolivia. La Paz, Bolivia: Plural Editores/Centro Internacional de la Papa.
Ortíz, O., Winters, P., Fano, H. (1999). La percepción de los agricultores sobre el problema del tizón tardío o rancha (Phytophthora infestans) su manejo: Estudio de casos en Cajamarca, Perú. https://dialnet.unirioja.es/servlet/articulo?codigo=5512080.
OXFAM. (2018). Facilitators guide on farmers field schools on participatory plant breeding. The Hague: OXFAM, CTDT, SEARICE. https://seedsforresilience.org/assets/2022/02/Facilitators-Field-Guide_Dec2018.pdf
Oyarzun, P.J., Borja, R. M., Sherwood, S., Parra, V. (2013). Making sense of agrobiodiversity, diet, and intensification of smallholder family farming in the highland Andes of Ecuador. Ecology of Food and Nutrition, 52(6), 515–541. https://doi.org/10.1080/03670244.2013.769099
Padulosi, S. and Dulloo, E. (2012). Towards a viable system for monitoring agrobiodiversity on-farm: a proposed new approach for Red Listing of cultivated plant species. In: Padulosi N, Bergamini N, Lawrence T (Eds). On-farm conservation of neglected and underutilized species: status, trends and novel approaches to cope with climate change (pp. 171–199). https://hdl.handle.net/10568/104624
Platform for Agrobiodiversity Research (PAR). (2018). Assessing agrobiodiversity. A Compendium of methods. Rome, Italy. https://www.researchgate.net/publication/340061632_Assessing_Agrobiodiversity_A_Compendium_of_Methods
Pradel, W., Hareau, G. G., Quintanilla, L., Suarez, V. (2017). Adopcion e impacto de variedades mejoradas de papa en el Peru: Resultado de una encuesta a nivel nacional (2013). https://doi.org/10.4160/9789290602118
R Core Team. (2024). R: A language and environment for statistical computing. R Foundation for Statistical Computing, Vienna, Austria. https: //www.R-project.org/
Reiss, J., Schmid-Araya, J. (2008). Existing in plenty: abundance, biomass and diversity of ciliates and meiofauna in small streams. Freshwater Biology, 53(4), 652-668. https://doi.org/10.1111/j.1365-2427.2007.01907.x
Seminario, J. F., Concha-Tupayachi, LS., Seminario-Cunya, A., Medina-Hinostrosa, T., Silva, W. (2025). Cultivar loss and conservation of genetic resources of the phureja potato (Solanum phureja L., Phureja Group) in Peru. Genetic Resources, 6(12), 1–13. https://doi.org/10.46265/genresj.JCDC4631
Seminario, J., Zarpán, L. (2011). Conservación in situ on farm-ex situ de Solanum tuberosum L. grupo Phureja en la cuenca del Llaucano y áreas adyacentes. Arnaldoa, 18(2), 103–114.
Singh, S., Sharma, D., Rana, J.C., Ahlawat, S. (2021). Study of crop diversity and seed system in tribal Northern Hilly region of Chhattisgarh. International Journal of Botany Studies, 6(1), 329–339. https://www.researchgate.net/publication/348920265_Study_of_crop_diversity_and_seed_system_in_tribal_Northern_Hilly_region_of_Chhattisgarh
Spooner, D. M., McLean, K., Ramsay, G., Waugh, R., & Bryan, G. J. (2005). A single domestication for potato based on multilocus amplified fragment length polymorphism genotyping. Proceedings of the National Academy of Sciences of the United States of America, 102(41), 14694–14699. https://doi.org/10.1073/pnas.0507400102
Sthapit, B., Rana, R., Subedi, A., Gyawali, S., Bajracharya, J., Chuadhary, P., Joshi, B. K., Sthapit, S., Joshi, K. D., and Upadhyay, M. P. (2006). Good practice 3. Participatory four-cell analysis (FCA) for understanding local crop diversity. Sthapit B. Shrestha P, Upadhyay M (Eds). On-farm management of agricultural biodiversity in Nepal. Good practices. https://www.researchgate.net/publication/348116250_On-farm_management_of_agricultural_biodiversity_in_Nepal
Valdivia-Díaz, M., La Torre-Cuadros, M.A., Polreich, S. (2014). Knowing native potatoes: finding local experts through innovative methods in the Peruvian Andes. Gaia Sciencia, Volumen especial (Populacoes tradicionais), 79–92. https://doi.org/10.21707/gs.v8i2.22425
Winters, P., Hintze, L. H., Ortiz, O. (2006). Rural Development and on-farm potato diversity in Cajamarca, Peru. Smale M. (Ed.). Valuing crop biodiversity: on-farm genetic resources and economic change, 2005. https://ssrn.com/abstract=3307460
Zevallos, E., Marmolejo, K., Alvarez, F., Paitan, R., Viza, I., Becerra, D., Rixi, G, Silva-Diaz, C, Inga, J. (2023). Screening potato landraces to cope with climate change in the Central Andes of Peru. International Journal of Plant Biology, 14(4), 1167-1179.
Zimmerer, K. S. (1991). Labor shortages and crop diversity in the Southern Peruvian Sierra. Geographical Review, 81(4), 414–432. http://www.jstor.orgURL:http://www.jstor.org/stable/215608