Morphological and biochemical characterization of Ethiopian mustard (Brassica carinata A. Braun) germplasm grown in Central Ethiopia
Abstract
Ethiopian mustard (Brassica carinata A. Braun) shows potential for diverse applications, including as leafy greens, green manure and oilseed feedstock for biofuels. This study evaluated the seed and oil production potential and phenotypic diversity of 49 B. carinata accessions through trials conducted in 2018 at the Holeta and Asela Research Centers in Ethiopia, using a lattice design. Data were collected on phenological, morphological, agronomic and seed quality traits. The analysis revealed significant variability across most traits, except for silique width and oil and protein content at Asela, and main raceme length and total glucosinolate content at Holeta. Combined analysis showed significant genotype-by-location interactions for flowering date, seeds per silique and seed yield per hectare, indicating a strong environmental influence on these traits. Phenotypic and genotypic correlation analyses identified strong positive correlations between leaf traits and phenology, seed yield and seed quality, while oil content was negatively associated with protein and glucosinolate content. Principal component analysis identified five components at Asela and six components at Holeta with eigenvalues greater than one, explaining over 77% of the total variation at both locations. Key traits such as plant height, seed yield and oil content contributed significantly to these principal components. Cluster analysis grouped the accessions into three clusters based on distinct trait combinations. Accessions 17545, 21373, 24203 and 24495 consistently performed well across multiple traits across sites, making them strong candidates for breeding programmes focused on improving seed yield and quality in B. carinata.
Keywords
Brassica carinata, germplasm characterization, oil content, seed yield
Introduction
Brassica carinata A. Braun (Ethiopian mustard, carinata) (BBCC) known as ‘Gomenzer’ in Amharic, a natural amphidiploid hybrid between B. nigra (BB) and B. oleracea (CC), is believed to have originated in the Ethiopian highlands (Warwick & Black, 1991). It is well adapted to these highlands (Prakash & Hinata, 1980; Rakow, 2004) and to a wider range of climatic conditions (Montemurro et al., 2016). The crop is grown globally for diverse applications. In the Horn of Africa, it is primarily utilized as leafy greens and as oilseed for culinary use (Basili & Rossi, 2018; Hagos et al., 2020), while in Europe it is employed for green manure and biofuel production (Cosentino, Copani, Patanè, Mantineo, & Agosta, 2008; Montemurro et al., 2016). In North America, B. carinata is grown for biofuel and oleochemical applications (Blackshaw et al., 2011; Gesch et al., 2015; Lawton, 2019; Marillia, Francis, Falk, Smith, & Taylor, 2014; Nóia-Júnior et al., 2022; Seepaul et al., 2021), whereas in Asia it is primarily cultivated for oilseed production (Katiyar, Saran, & Giri, 1986; Lawton, 2019; Thakur, Singh, Sharma, Parmar, & Nanjundan, 2019).
B. carinata seeds are rich in oil, with contents ranging from 25% to 47% by weight (Ambaw, Abitea, & Olango, 2024; Redda, Laß-Seyoum, Yimam, Barz, & Jabasingh, 2022; Taylor et al., 2010). The oil is used as an edible oil in Ethiopia after being blended with Nuge (Guizotia abyssinica) oil and/or other vegetable oils (Alemaw & Gurmu, 2023; Belete, Yohannes, & Wami, 2012; Bosekeng, 2019; Thakur et al., 2019). Characterized by a high erucic acid content, the oil possesses desirable physicochemical properties, such as low free fatty acid content and abundant unsaponifiable matter, enhancing its stability and quality (Cardone et al., 2003; Mohdaly & Ramadan, 2022). These attributes, combined with the low moisture and acidity levels (< 1% and 0.98% as oleic acid, respectively), make B. carinata oil a versatile feedstock. Its industrial applications encompass biodiesel and bio-jet fuel production, as well as the manufacturing of lubricants, plastics, soaps and detergents (Mohdaly & Ramadan, 2022; Redda et al., 2022). The biomass, particularly its high-protein content seed meal, serves as a nutritious supplement for livestock, poultry and swine (George et al., 2021; Paula, Silva, Brandao, Dai, & Faciola, 2019). It also helps manage soil-borne pests through biofumigation, releasing biocidal compounds, particularly isothiocyanates, which are effective against various soil pathogens (Iboyi et al., 2022; dos-Santos, Abboud, & Carmo, 2021).
Studies on B. carinata revealed a complex interplay between genetic diversity, phenotypic variation and agronomic potential. Population structure analyses using SNP (Tesfaye, Feyissa, Hailesilassie, Kanagarajan, & Zhu, 2023) and SSR markers (Thakur et al., 2020; Zhou et al., 2022) indicated moderate genetic diversity, low heterozygosity and limited gene flow. Tesfaye et al. (2023) reported heterozygosity of 0.30 and nucleotide diversity of 1.31 × 10⁻⁵, while Thakur et al. (2020) observed an average of 3.03 alleles per marker. Phenotypic studies highlighted significant morphological diversity, including oil content (Ambaw, Abitea, Olango, & Aboye, 2024; Mohdaly & Ramadan, 2022). B. carinata also demonstrated superior productivity, economic returns and environmental performance compared to other mustard species (Rathore et al., 2022). Further research has explored trait correlations and identified markers for seed quality (Zhang et al., 2017), and QTL for traits like flowering time and oil content (Mohdaly & Ramadan, 2022). Characterizing germplasm is essential for understanding phenotypic and genetic diversity, and is crucial for selecting accessions for breeding programmes and designing conservation strategies (Kumari, Borah, Gupta, & Singh, 2023; Salgotra & Chauhan, 2023).
Morphological traits, such as seed size and plant height, are primary criteria for selecting accessions in breeding programmes due to their ease of measurement (El-Esawi, 2018; Swarup et al., 2021). Traits such as seed oil content and quality, as well as biomass production, help to select genotypes meeting standards for consumption or industrial use (Tesfaye, Weyessa, & Debele, 2019; Zhang et al., 2017).
Some studies have assessed several morphological traits of B. carinata, such as plant height, leaf shape, seed size and flowering time. Zada, Zakir, Rabbani, and Shinwari (2013) evaluated 132 accessions and documented significant phenotypic variability. (Hagos et al., 2020) also reported significant differences in leaf size attributes (p < 0.001) and phenological traits of 313 accessions.
Despite extensive research on the potential of Ethiopian mustard for biofuel applications, a comprehensive understanding of its morphological, agronomic, seed and oil content traits remains crucial for developing effective breeding strategies for a range of purposes, as these traits have a significant impact on seed and oil production. This study aims to evaluate B. carinata accessions to determine their seed and oil production potential and diversity to be utilized in breeding programmes.
Materials and methods
Plant material
A total of 49 Ethiopian mustard accessions were evaluated in this study. The planting materials comprised 47 landraces, randomly selected from eight geographically clustered regions within the collections of the Ethiopian Biodiversity Institute, Addis Ababa Ethiopian Biodiversity Institute (EBI, https://ebi.gov.et). Additionally, two released varieties, ‘Holetta-1’ and ‘S-67’, developed by the Holeta Agricultural Research Center, were included. The passport data of the accessions used and the pedigree of the released varieties are provided in Supplemental Table 1.
The Ethiopian Biodiversity Institute (EBI), the source of the landrace accessions, provided limited quantities of seed for each accession. Specifically, each accession was provided with only 4g of seed, which was insufficient for establishing trials at more than two locations. This limitation restricts the assessment of genotype-by-environment (G×E) interactions across a wider range of environmental conditions.
Experimental site
Field experiments were conducted at two agricultural research centres in Ethiopia during the 2018 cropping season. The first location, Holeta, is situated 40km southwest of Addis Ababa at an altitude of 2,400m above sea level (m.a.s.l.), with coordinates of 9°3′N latitude and 38°30′E longitude. The soils in this area are predominantly nitosols and vertisols with the region receiving an average annual rainfall of 1,008.14mm (Tura, Teklemichael, & Disasa, 2021) and a mean maximum and minimum temperature of 22.3°C and 6.15°C, respectively (Geleta, Kussia, & Andualem, 2024). The second location, Asela, is located 170km south of Addis Ababa at an altitude of 2,200 m.a.s.l., with coordinates of 8°1′N latitude and 39°9′E longitude. Asela's soils are primarily lateritic and black cotton, with an average annual rainfall of approximately 1,000mm ( (ETWRDEC, 2017; Fekadu, 2021)) and a mean minimum and maximum temperature of 5.0°C and 28.0°C, respectively (Megersa et al., 2024).
Experimental procedure
Experiments were conducted at two sites utilizing a 7×7 lattice design with two replications of 49 accessions. The design was chosen due to the limited seed availability from EBI. The plot size was 1.8m2, consisting of four rows 30cm apart and measuring 1.5m in length. Seeds were sown by hand drilling in rows at a rate of 5kg/ha. At both sites, fertilizers at a rate of 46kg/ha nitrogen and 69kg/ha P2O5 were applied. Following EARO (2004) guidelines, conventional agricultural practices, encompassing field preparation, nutrient application and weed control measures were implemented.
Data collection
Plant-based data: Measurements were conducted from five randomly selected plants per plot. Leaf petiole length, leaf length and leaf width were measured from five middle leaves of each selected plant. Number of leaves per plant, plant height, number of primary branches per plant and seed yield per plant were recorded from the same five plants. Main raceme length and number of siliques per main raceme were recorded from five main racemes of the same selected plants. Silique length, silique width, and number of seeds per silique were measured for five siliques selected from the main racemes of each of the same five plants. Mean values for the measured traits were calculated from these measurements. Measurements of selected traits were conducted according to the International Board for Plant Genetic Resources descriptors for Brassica and Raphanus (IBPGR, 1990).
Plot-based data: For each plot, the following data were collected from the two central rows: days to flowering, days to maturity, thousand seed weight and seed yield per hectare.
Seed quality analysis was conducted at the Agriculture and Agri-Food Canada – Saskatoon Research and Development Centre in Saskatchewan, Canada. The oil and protein content of the seeds was determined using near-infrared reflectance spectroscopy (Foss Model 6500). Oil and protein concentrations were expressed as percentages on a moisture-free basis (Hossain et al., 2018). Total glucosinolates were extracted and purified using ion-exchange chromatography and on-column enzymatic desulfation (Thies, 1980). Trimethylsilyl derivatives were prepared using the acetone and 1-methylimidazole-based method of Landerouin, Quinsac, and Ribaillier (1987).
In this study, data were collected at various growth stages according to the Biologische Bundesanstalt, Bundessortenamt und Chemische Industrie (BBCH) scale. Early leaf development traits were recorded at BBCH 19, branching and flowering traits at BBCH 50, and silique, seed, and maturity traits at BBCH 90 (Meier, 2018).
Data Analysis
Data analysis was performed using R software (R Core Team, 2023) packages. Analysis of variance (ANOVA) was conducted using the 'PBIB.test' function from the agricolae package (Mendoza, 2023) for individual location analyses, while the 'aov' function from the same package was used for the combined analysis across locations. Scatter plot mean seed yield per hectare comparison was performed by R software ggplot2 package (Wickham, 2016). Mean separation was carried out using Tukey's Honestly Significant Difference (HSD) test, also implemented in the agricolae package (Mendoza, 2023). Before doing the combined analysis of variance, a test for homogeneity of variance was performed (F-test) (Mead, Curnow, & Hasted, 2003). The phenotypic and genotypic correlation coefficients were calculated using the R software variability package (Popat, Patel, & Parmar, 2020), which implements the methods described by Singh and Chaudhary (1977) as described below:
Phenotypic correlation coefficient:
Where is the phenotypic covariance between trait x and trait y, and are the phenotypic variances of x and y, respectively.
Genotypic correlation coefficient:
Where is the genotypic covariance between trait x and trait y, and are the genotypic variances of x and y, respectively.
Heatmaps of the correlation results were created by the R software pheatmap package (Kolde, 2019). Principal component analysis (PCA) and Ward’s D2 Linkage and Euclidean distance hierarchical method cluster analysis were performed using the ‘factoextra’ (Kassambara & Mundt, 2020) and ‘FactoMineR’ (Le, Josse, & Husson, 2008) packages. The optimal number of clusters was determined using ‘NbClust’ package (Charrad, Ghazzali, Boiteau, & Niknafs, 2014).
|
Trait |
Asela |
|
Holeta |
||||||
|
Mean ± SD |
Min |
Max |
CV |
|
Mean ± SD |
Min |
Max |
CV |
|
|
LPL |
13.5 ± 3.7 |
4.9 |
21.7 |
27.6 |
|
11.4 ± 3.7 |
2.7 |
19.5 |
32.8 |
|
LL |
28.2 ± 6.5 |
9 |
40.7 |
23.1 |
|
26.3 ± 6.5 |
7 |
38.2 |
24.5 |
|
LW |
10.9 ± 2.2 |
5.8 |
15.8 |
19.9 |
|
12.4 ± 2.5 |
5.4 |
18.5 |
20.1 |
|
LPP |
99 ± 14.2 |
67 |
123.1 |
14.3 |
|
92.9 ± 14.4 |
59.5 |
118.1 |
15.5 |
|
FD |
86.7 ± 10.4 |
61 |
109 |
12 |
|
92 ± 9.7 |
66 |
114.5 |
10.5 |
|
MD |
153.1 ± 14.5 |
127 |
180.5 |
9.5 |
|
174.4 ± 8.4 |
148.5 |
188.5 |
4.8 |
|
PH |
197.7 ± 13.9 |
162 |
220.5 |
7 |
|
188.7 ± 19.2 |
114 |
219.5 |
10.2 |
|
PB |
14.3 ± 3 |
8.2 |
20.3 |
21.2 |
|
14.5 ± 3.1 |
8 |
20.3 |
21.2 |
|
MRL |
5.5 ± 0.6 |
4.5 |
6.6 |
10.8 |
|
5.2 ± 0.4 |
4.4 |
6.1 |
8 |
|
SPMR |
18.4 ± 4.5 |
11.2 |
28.6 |
24.6 |
|
18.6 ± 5.1 |
10 |
32.8 |
27.3 |
|
SL |
28.5 ± 4.4 |
19.8 |
38.6 |
15.5 |
|
30.3 ± 4.9 |
20.3 |
40.2 |
16 |
|
SW |
2.2 ± 0.2 |
1.7 |
2.8 |
10.6 |
|
2.4 ± 0.2 |
2.1 |
3.1 |
8.4 |
|
SPS |
12.8 ± 1.4 |
9.8 |
15.6 |
11.1 |
|
12.7 ± 1.5 |
9.5 |
15.6 |
12.2 |
|
TSW |
3 ± 0.5 |
1.9 |
4 |
16 |
|
3.1 ± 0.5 |
2.2 |
4.1 |
14.8 |
|
SYppl |
3.6 ± 0.8 |
2.2 |
5.2 |
22.6 |
|
3.1 ± 0.8 |
1.6 |
4.7 |
26.2 |
|
SYpha |
2,245.4 ± 500.3 |
1,262.1 |
3,074.2 |
22.3 |
|
2,161.6 ± 500 |
1,173.9 |
2,950.5 |
23.1 |
|
OIL |
37.2 ± 2.5 |
32.6 |
43.1 |
6.7 |
|
44 ± 2.2 |
37.4 |
49.1 |
5 |
|
PRO |
29.9 ± 2.1 |
25.8 |
34.6 |
7.1 |
|
26 ± 1.8 |
22.7 |
31.5 |
6.8 |
|
TG |
99.9 ± 9.7 |
82.6 |
123.3 |
9.7 |
|
83.3 ± 8.5 |
61.6 |
99.2 |
10.2 |
Results and discussion
Overview of trait variation across locations
Accessions showed coefficients of variation (CV) ranging from 4.8% to 32.8% (Table 1), consistent with the high coefficients of variation (> 20) observed for traits such as leaf petiole length, leaf length, leaf width, primary branches per plant, number of siliques per main raceme, and seed yield per hectare at both locations in this study. (Ambaw et al., 2024) also reported similarly high CVs, suggesting that these traits exhibit substantial phenotypic plasticity and/or are strongly influenced by genetic factors segregating within our accessions (Table 1). The fact that high CVs were observed at both locations implies a consistent influence, hinting at significant G×E interactions. The average seed yield per hectare was slightly higher at Asela, at 2,245.4 ± 500.3kg (ranging from 1,262.1 to 3,074.2kg), compared to 2,161.6 ± 500kg at Holeta (ranging from 1,173.9 to 2,950.5kg) (Table 1). This slight increase in mean yield at Asela, along with consistent standard deviations across locations, indicates relative similarity in environmental conditions. However, the average oil content was higher at Holeta, at 44 ± 2.2% (ranging from 37.4 to 49.1%), compared to 37.2 ± 2.5% (ranging from 32.6 to 43.1%) at Asela. The difference in trend between seed yield and oil content may be attributed to environmental differences, while the broad range in yields and location-based variation in oil content highlights the genotypic variability of B. carinata, offering valuable potential for selection in future crop improvement efforts.
Comparable yields for B. carinata have been reported in other studies. Seepaul et al. (2021), in a literature review of multiple field trials, summarized yields ranging from 1,929kg/ha to 2,732kg/ha. Furthermore, (Tesfaye et al., 2023) found a seed yield average of 3,185kg/ha on selected B. carinata genotypes in Ethiopia. Similarly, Iboyi et al. (2023) reported a range from a minimum seeding rate of 732kg/ha at a 1.12kg/ha to a maximum seeding rate of 1,087kg/ha at 5.6kg/ha in southeastern United States. For oil content, previous studies on B. carinata in Ethiopia have also reported comparable findings. (Ambaw et al., 2024) reported oil content values ranging from 37.88% to 46.98%, while (Redda et al., 2022) observed oil content between 35% and 45% in Ethiopian germplasm. These results are consistent with the findings of this study, highlighting the rich phenotypic diversity and potential for improving seed yield and oil quality in B. carinata.
Analysis of variance
Individual location analysis results showed significant variability among tested B. carinata accessions for most of the traits except silique width, oil and protein content at Asela and main raceme length and total glucosinolate content at Holeta (Table 2). Combined location analysis of variance revealed significant variation among accessions for all traits, while the interaction between accession and location showed significant variation for the traits flowering date, number of seeds per silique and seed yield per hectare (Table 3).
|
Trait |
Asela |
|
Holeta |
||||||||
|
Replication |
Genotype |
Block |
Error |
CV (%) |
|
Replication |
Genotype |
Block |
Error |
CV (%) |
|
|
LPL |
0.98 |
27.7** |
0.5 |
0.5 |
5.2 |
|
56.94** |
27.7** |
0.6 |
0.5 |
6.5 |
|
LL |
169.28** |
84.8** |
20.7 |
20.4 |
16.0 |
|
379.7** |
83.4** |
19.2 |
21.1 |
17.4 |
|
LW |
44.72** |
9.5** |
2.7 |
2.1 |
13.4 |
|
31.09** |
12.4** |
3.2 |
2.5 |
12.7 |
|
LPP |
263.19** |
403.4** |
10.8 |
13.5 |
3.7 |
|
26.13 |
416.7** |
12.9 |
14.8 |
4.1 |
|
FD |
32 |
217** |
6.7 |
7.9 |
3.2 |
|
54.38** |
186.1** |
11.1* |
4.7 |
2.4 |
|
MD |
2.3 |
420.4** |
51.1 |
43.9 |
4.3 |
|
3.31 |
142.3** |
35 |
23.3 |
2.8 |
|
PH |
1,389.4** |
387.3** |
84.6 |
141.6 |
6.0 |
|
11,100.5** |
733.3** |
120.8 |
153.3 |
6.6 |
|
PB |
0.09 |
18.5** |
2.2 |
2.9 |
11.8 |
|
266.48** |
18.9** |
3.3 |
3 |
11.9 |
|
MRL |
0.5 |
0.7** |
0.4 |
0.2 |
8.8 |
|
71.54** |
0.4 |
0.2 |
0.3 |
10.1 |
|
SPMR |
5.93 |
40.8** |
2.8 |
3.1 |
9.6 |
|
6.9 |
51.5** |
2.3 |
5.4 |
12.5 |
|
SL |
4.57 |
39** |
18.6 |
17.2 |
14.5 |
|
188.3** |
47.2** |
23.6 |
18.2 |
14.1 |
|
SW |
0.06 |
0.1 |
0.1 |
0.1 |
14.4 |
|
0.01 |
0.1** |
0.1 |
0.04 |
8.0 |
|
SPS |
0.03 |
4** |
1.6 |
1.4 |
9.4 |
|
0.74 |
4.7** |
0.8 |
1.5 |
9.7 |
|
TSW |
0.11 |
0.4** |
0.1 |
0.1 |
11.9 |
|
0.29 |
0.4** |
0.1 |
0.1 |
11.6 |
|
SYppl |
0 |
1.3** |
0.1 |
0.1 |
7.3 |
|
0.17 |
1.3** |
0.04 |
0.1 |
7.9 |
|
SYpha |
5,437.06 |
500,587.4** |
30,678.6 |
28,324.7 |
7.5 |
|
134,332.25* |
499,973.6** |
35,619.7 |
18,572.4 |
6.3 |
|
OIL |
19.2 |
12.5 |
7.4 |
9.7 |
8.4 |
|
0.52 |
9.5** |
3.9 |
3.2 |
4.1 |
|
PRO |
29.85 |
9.1 |
3.4 |
6.1 |
8.3 |
|
15.35* |
6.3* |
5.2 |
3.7 |
7.4 |
|
TG |
710.02** |
186.6** |
56.4 |
84.2 |
9.2 |
|
1,142.64** |
145.1 |
137.2 |
110.5 |
12.6 |
|
Trait |
Location |
Genotype |
(G×L) |
Error |
CV (%) |
|
LPL |
223.93** |
55.4** |
0.02 |
1.1 |
8.5 |
|
LL |
180.13** |
168.1** |
0.04 |
25.7 |
18.6 |
|
LW |
107.86** |
21.6** |
0.3 |
3.2 |
15.3 |
|
LPP |
1,836.73** |
818.5** |
1.6 |
16.2 |
4.2 |
|
FD |
1,363.72** |
391.6** |
11.5* |
7.7 |
3.1 |
|
PB |
2.17 |
37.2** |
0.2 |
5.5 |
16.3 |
|
SPMR |
2.87 |
90.3** |
2 |
3.9 |
10.6 |
|
SL |
167.15** |
83.9** |
2.3 |
20.1 |
15.3 |
|
SW |
3.12** |
0.13** |
0.06 |
0.07 |
11.3 |
|
SPS |
0.75 |
6.4** |
2.4* |
1.4 |
9.3 |
|
TSW |
0.62* |
0.8** |
0 |
0.1 |
11.2 |
|
SYppl |
13.31** |
2.5** |
0.1 |
0.1 |
7.7 |
|
SYpha |
344,348.37** |
948,487.3** |
52,073.7** |
26,771.9 |
7.4 |
|
OIL |
14,693,939.17** |
99,738** |
44,010.9 |
38,121.2 |
11.7 |
|
PRO |
765.71** |
9.4** |
6.1 |
5.1 |
8.1 |
|
TG |
13,474.13** |
206.2** |
125.5 |
114.1 |
11.7 |
The significant variations observed in most studied traits among B. carinata accessions indicate substantial genetic diversity within the species. This aligns with Tesfaye et al. (2023), who reported that 93% of the genetic variation was attributed to molecular variance, and Thakur et al. (2020), who found an average genetic diversity of 0.37. This diversity provides opportunities for breeding programmes to develop cultivars with desirable traits. The significant interaction between genotype and location for certain traits suggests that the performance of B. carinata accessions is influenced by environmental factors. This implies that selecting genotypes for specific growing conditions is crucial for optimal yield and quality. The lack of significant variation in silique width and oil and protein content at Asela (Table 2) might indicate a relatively narrow genetic variation or a strong genetic control over these traits; however, in the case of silique width, although the genotypic mean square was similar between Asela and Holeta, significance was detected only at Holeta due to its lower experimental error, which increased the F-ratio and statistical power to reveal genotypic differences. Meanwhile, the significant variation in main raceme length and total glucosinolate content recorded at Asela but not at Holeta (Table 2) suggests that there is a high environmental influence on the expression of these traits. The significant interactions between genotype and location for flowering date, seeds per silique and seed yield per hectare highlight the importance of considering both genetic factors and environmental conditions when selecting genotypes for specific regions.
Similar significant variability among B. carinata genotypes has been reported by Amsalu (2020); Amsalu (2020); Belete (2011); Dhaliwal, Mason, Banga, Bharti, and Banga (2019); Mahendra-Salam, Singh, Shraddha, Singh, and Rohit (2021); Walle, Wakjira, and Genet (2014) and (Khan et al., 2022). The observation that the majority of genotype-by-location (G×L) interactions in our combined analysis of variance were non-significant (Table 3) aligns with the findings of Adeniji and Aloyce (2012), but contrasts with the reports of significant G×L interactions by Kumar et al. (2020) and Tadesse, Tekalign, and Asmare (2021). This discrepancy in results could stem from several factors related to the experimental design, the germplasm studied and the environmental conditions.
Correlation analyses
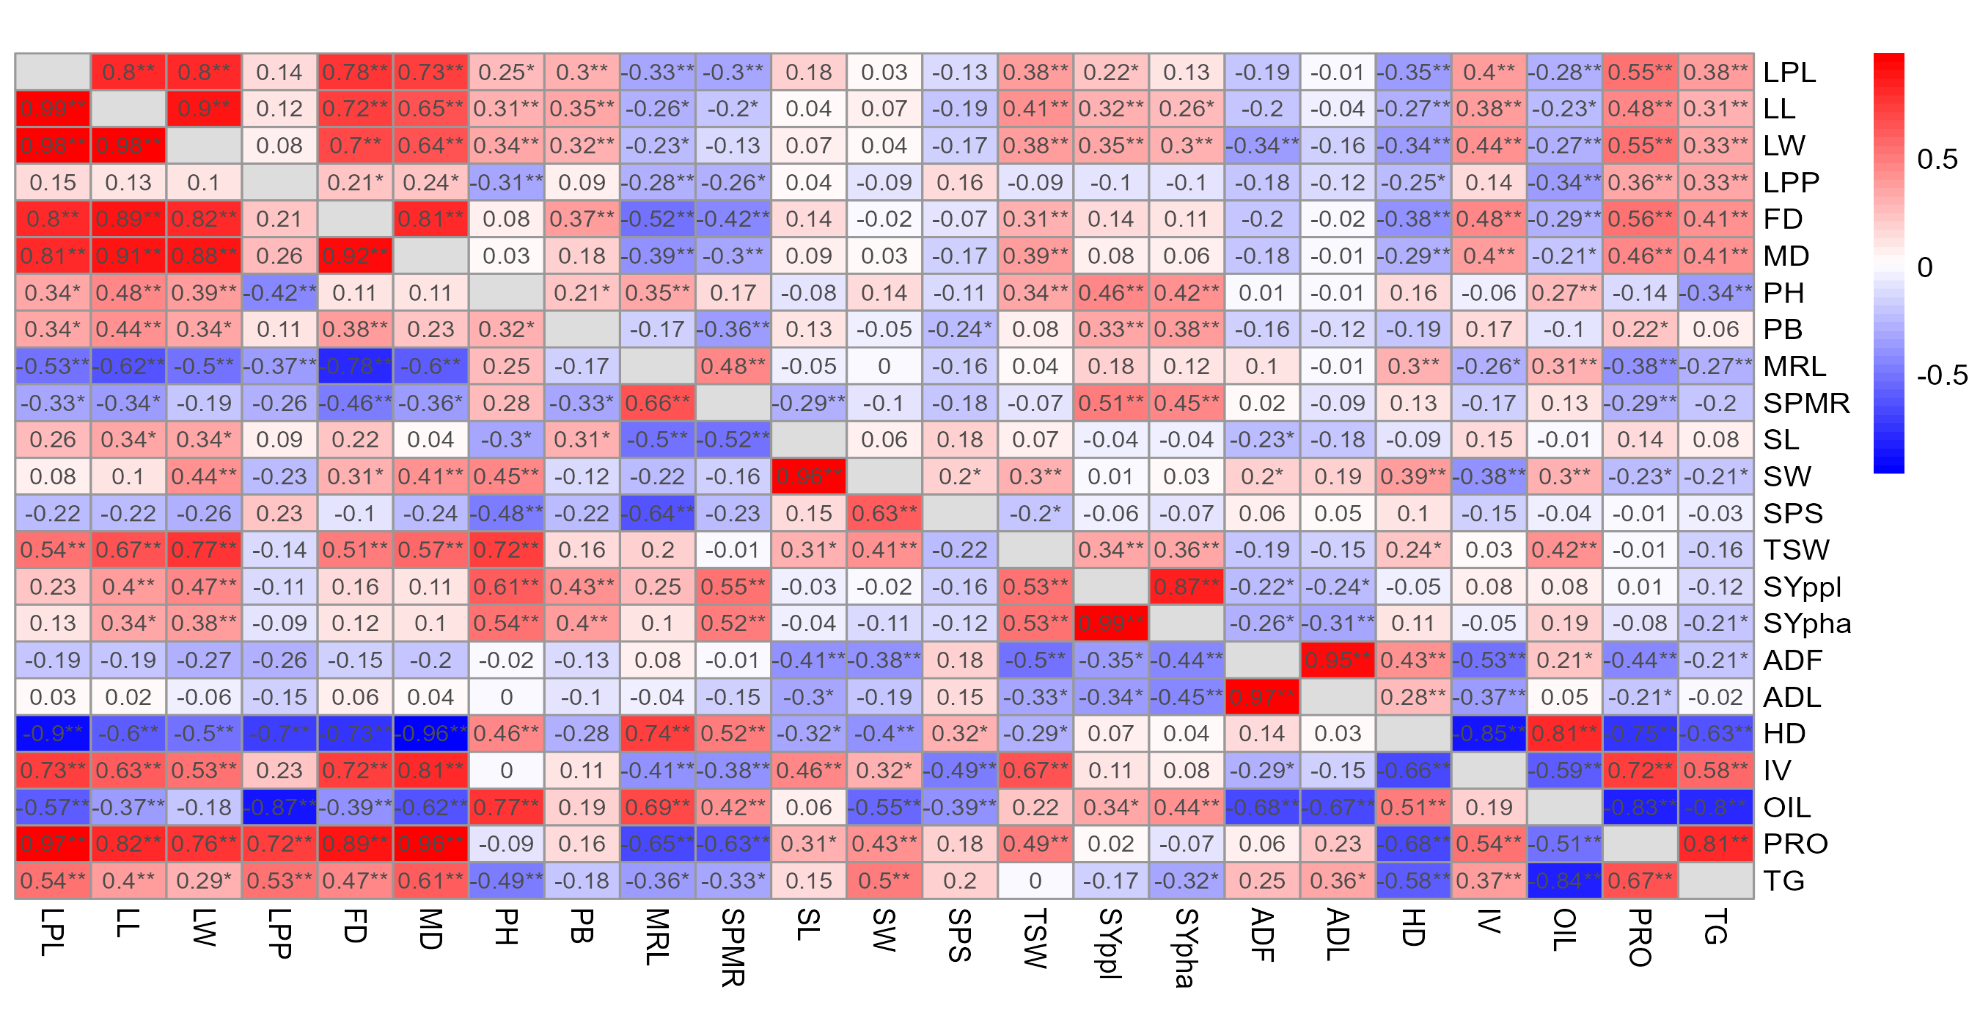
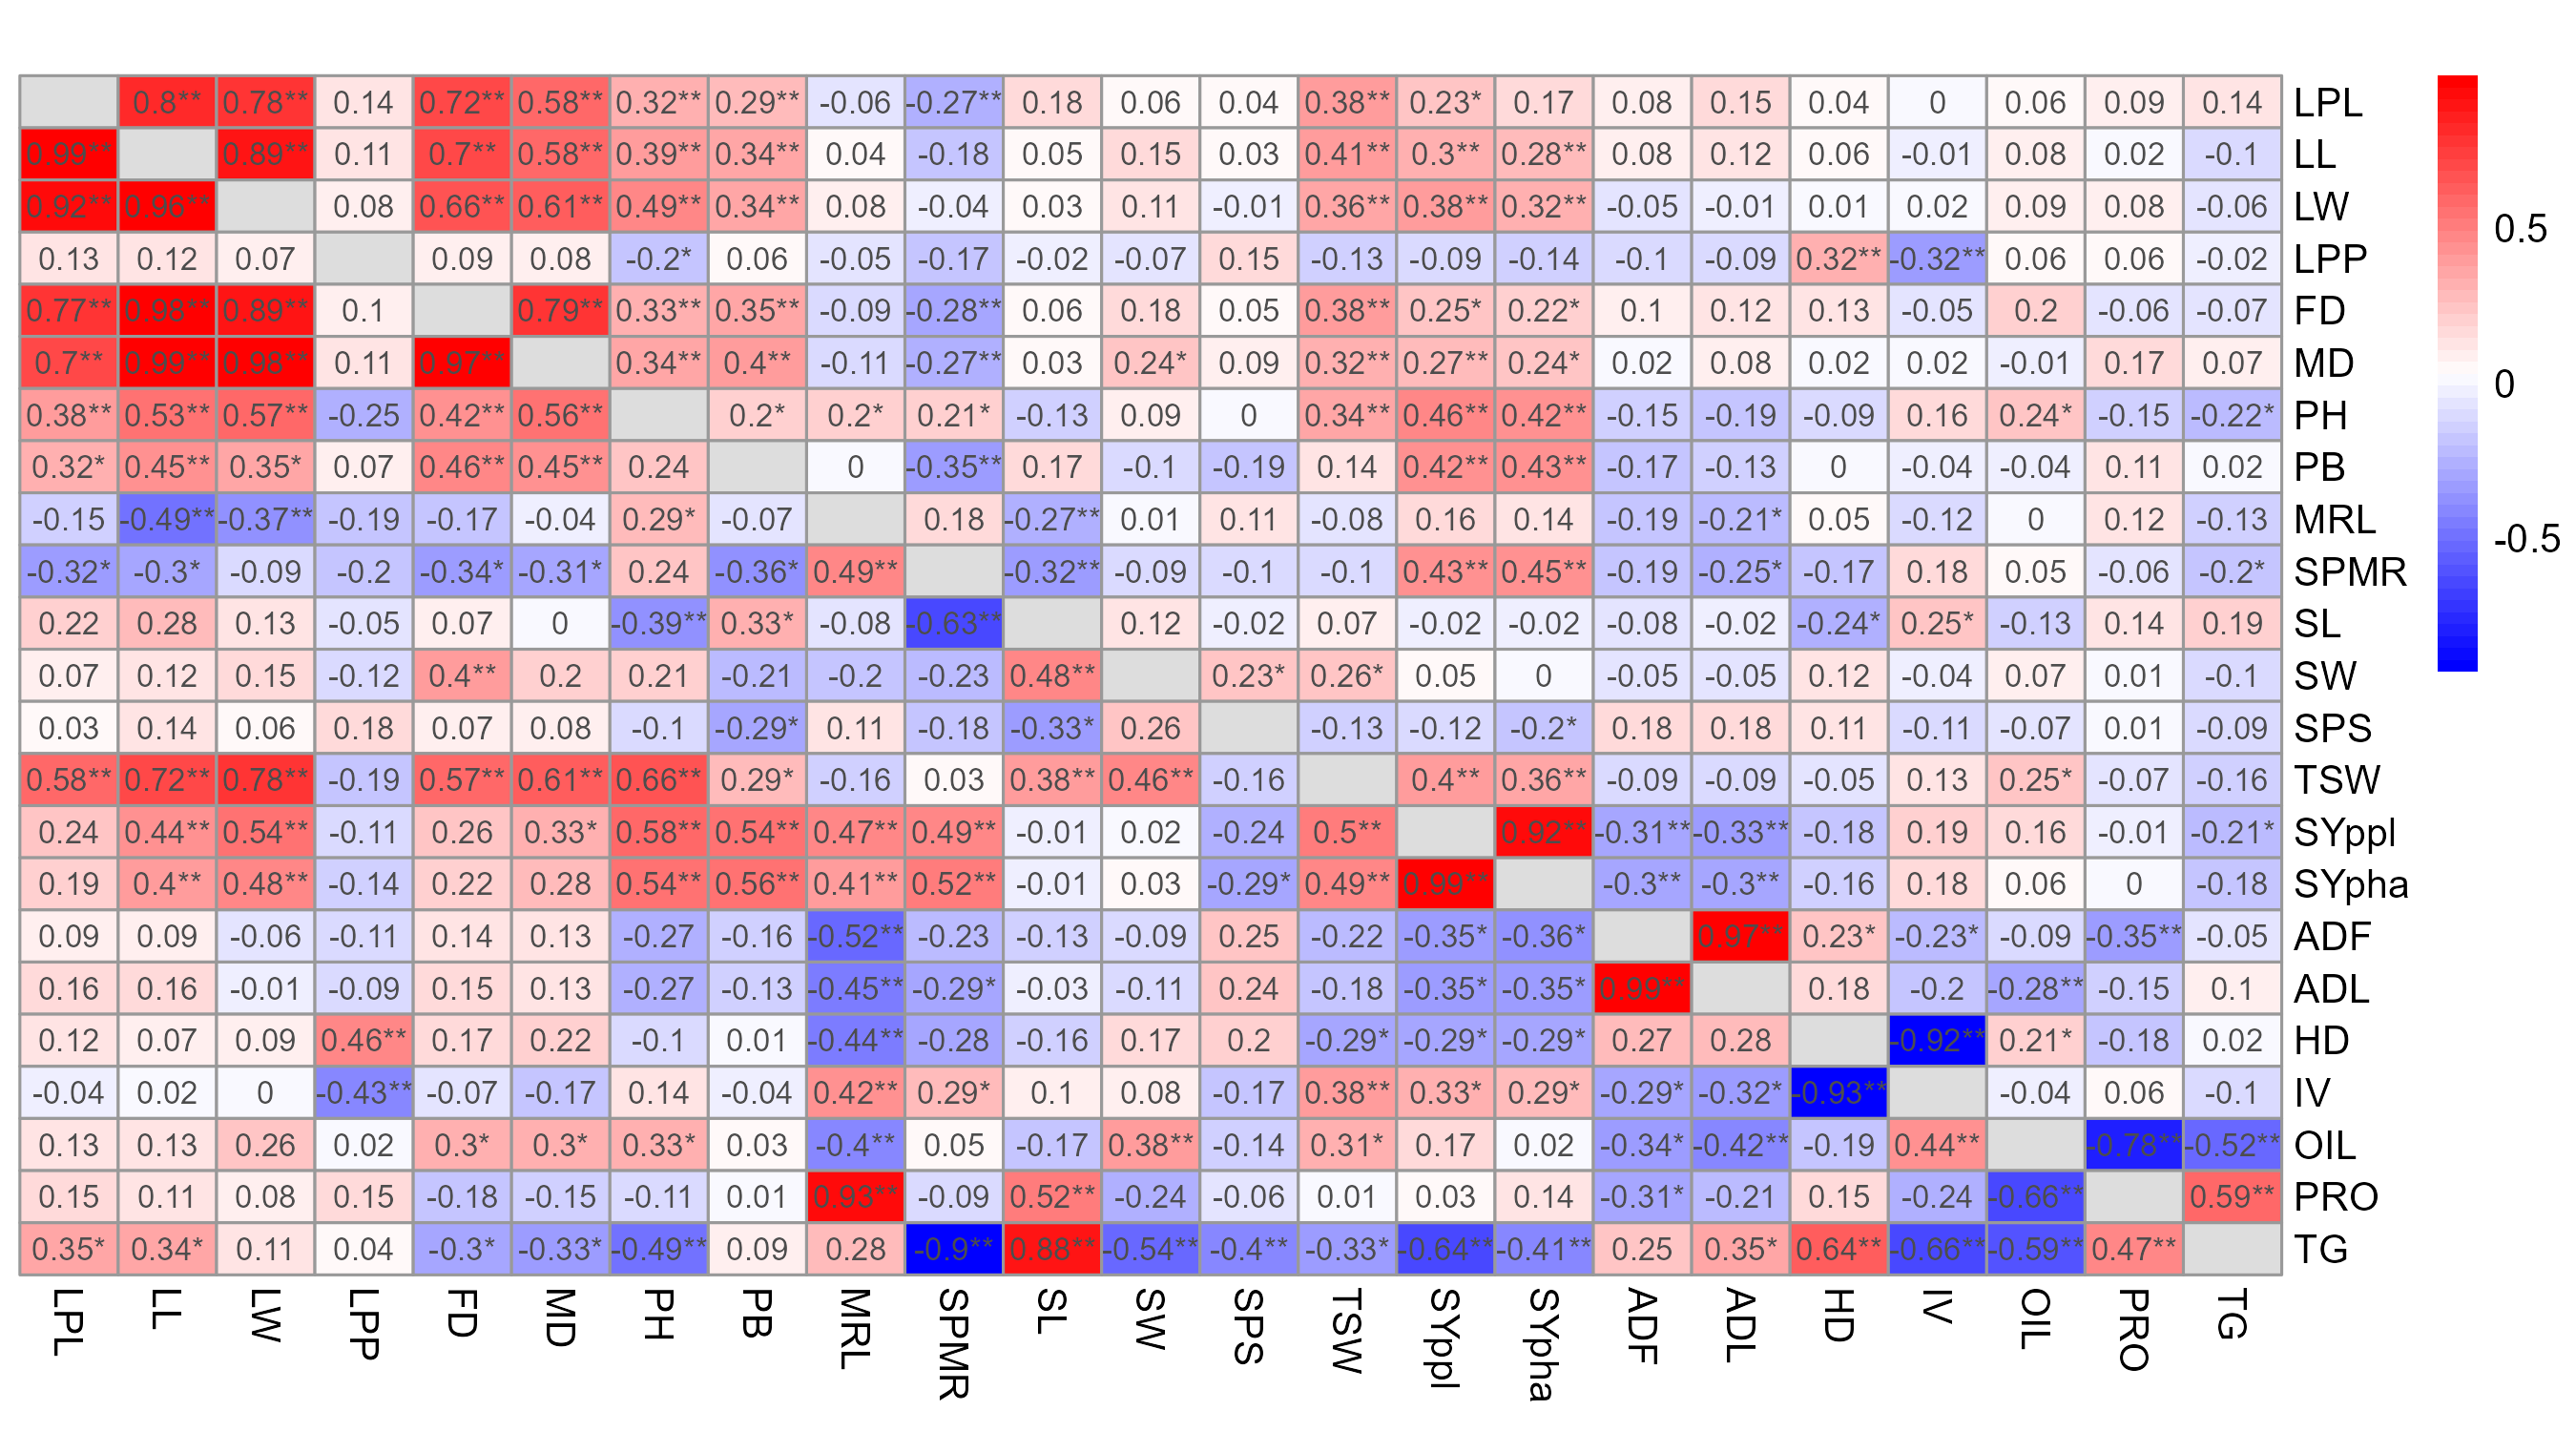
Phenotypic correlation analysis at the two locations revealed significant positive and negative associations among various agronomic and seed traits (Figure 2; Figure 1). Leaf and phenological traits exhibited the strongest positive phenotypic correlations at both locations, including leaf petiole length with leaf length (0.80, 0.80), leaf width (0.80, 0.78), flowering date (0.78, 0.72), and maturity date (0.73, 0.58); leaf length with leaf width (0.90, 0.89), flowering date (0.72, 0.70), and maturity date (0.65, 0.58); leaf width with flowering date (0.70, 0.66) and maturity date (0.64, 0.61); and flowering date with maturity date (0.81, 0.79). Additionally, strong positive phenotypic correlations were observed for seed yield per plant with seed yield per hectare (0.87, 0.92) and protein content with total glucosinolate content (0.81, 0.80) at Asela and Holeta, respectively. Similarly, consistently significant negative phenotypic correlations were recorded for oil content with protein content (-0.83, -0.78) and with total glucosinolate content (-0.80, -0.52) at Asela and Holeta, respectively.
To fully understand the genetic relationships underlying the observed phenotypic variation, analyzing genotypic correlations among the studied traits is essential. This analysis offers valuable insights into the genetic linkages between traits, aiding in the identification of potential breeding targets and providing a deeper understanding of the genetic limitations within B. carinata.
The genotypic correlation analyses of this study revealed several significant associations among the considered traits for both locations (Figure 2; Figure 1). Strong positive correlations were again observed among leaf and phenological traits, including leaf petiole length with leaf length (0.99, 0.99), leaf width (0.98, 0.92), flowering date (0.80, 0.77) and maturity date (0.81, 0.70); leaf length with leaf width (0.98, 0.96), flowering date (0.89, 0.98) and maturity date (0.91, 0.99); and leaf width with flowering date (0.82, 0.89) and maturity date (0.88, 0.98). Flowering date also showed high correlations with maturity date (0.92, 0.97). Additionally, strong positive genotypic correlations were recorded for seed yield per plant with seed yield per hectare (0.99, 0.99) and plant height (0.61, 0.58); and for thousand seed weight with leaf length (0.67, 0.72), leaf width (0.77, 0.78), maturity date (0.57, 0.61), and plant height (0.72, 0.66) at Asela and Holeta, respectively. Seed yield per hectare showed significant positive associations with the number of siliques per main raceme (0.52, 0.52) and thousand seed weight (0.53, 0.49). Negative significant correlations were recorded for oil content with protein content (-0.50, -0.66) and total glucosinolate content (-0.84, -0.59) at Asela and Holeta, respectively.
The strong positive correlations observed in this study between leaf traits (leaf length, leaf width, and leaf petiole length) are consistent with previous research by Yimer, Mohammed, Teju, and Pae (2021). This suggests a consistent genetic and environmental influence on these traits in B. carinata. As expected, the positive correlation between plant height and phenological traits (flowering and maturity dates) observed in this study aligns with Walle et al. (2014). This relationship is likely due to the natural elongation of the flowering spike contributing to plant height. However, confirming this correlation in B. carinata under the studied conditions helps strengthen its role in breeding for synchronized flowering and uniform plant architecture.
The positive correlations between seed yield per hectare and seed yield per plant are further supported by (Amsalu, 2020) and Belete (2011). These findings highlight the importance of seed yield per plant and the number of siliques per main raceme as key determinants of overall yield. Marjanović-Jeromela et al. (2007) provide additional evidence for the significance of these traits in Brassica species. The positive correlation of thousand seed weight with various traits, including leaf length and width, maturity date and plant height, aligns with the findings of (Tadessel & Alemu, 2019). This underscores the importance of seed weight in yield improvement.
The inverse relationship between oil content and protein and glucosinolate contents observed in this study is consistent with previous research by (Tadessel & Alemu, 2019), confirming the common trade-off between these seed quality traits in oilseed crops.
However, the positive genotypic correlations between thousand seed weight and phenological traits in this study differ from the negative associations reported by Khan et al. (2022) and Kumar-Singh, Yadav, and Singh (2018). Different B. carinata accessions possess distinct genetic architectures (Tesfaye et al., 2023). Discrepancies in correlation results may be partly attributed to the simple lattice design employed. Residual environmental heterogeneity within blocks, location-by-block interactions and incomplete blocking effects could have influenced trait correlations. Future studies should consider spatial analysis techniques to account for these factors. The observed inconsistencies in the correlations between main raceme length and protein and oil content, as well as silique width and total glucosinolate content, across different locations, suggest that environmental factors play a significant role in influencing the expression of these traits. This result highlights the need for future research that specifically investigates the G×E interactions governing these complex trait relationships in B. carinata.
The strong associations observed between leaf, phenological and seed traits in this study highlight their potential as target traits for breeding programmes aimed at improving B. carinata yield and quality. However, the influence of environmental factors on trait expression underscores the importance of conducting multi-location trials and considering genotype–environment interactions when selecting genotypes for specific regions.
Principal component analysis
A principal component analysis (PCA) was employed to examine the combined data from Asela and Holeta. This analysis identified six principal components (PCs), each with eigenvalues greater than 1 according to Kaiser’s criterion (Jolliffe, 2002). Together, these six PCs accounted for 82.0% of the total variability (Supplemental Table 2). The first two components (PC1 and PC2) represented 52.7% of the overall variation and were visualized in a biplot (Supplemental Table 2, Figure 3). The distribution of accessions on the biplot reveals considerable genetic diversity among the accessions. PC1, accounting for 31% of the variance, is characterized by strong positive loadings for leaf petiole length (0.90), leaf length (0.94), leaf width (0.92), days to flowering (0.89), and days to maturity (0.88), indicating that accessions with greater values for traits that influence plant structure and phenology grouped together in PC1 and suggests that selecting for plant leaf area could lead to later maturity. PC2, which explained a further 21.7% of the variation, was characterized by substantial contributions from plant height (0.69), seed yield per plant (0.73), seed yield per hectare (0.75) and the number of siliques per main raceme (0.61), implying a connection between taller plants with a prolific density of siliques that led to high seed yield. This association points to a potential breeding target: increasing plant height and silique density to enhance overall seed yield. However, it is crucial to consider the potential for lodging associated with taller plants and high silique density. Breeding efforts should also focus on improving stem strength and lodging resistance to ensure that increased yield is not compromised by plant instability.
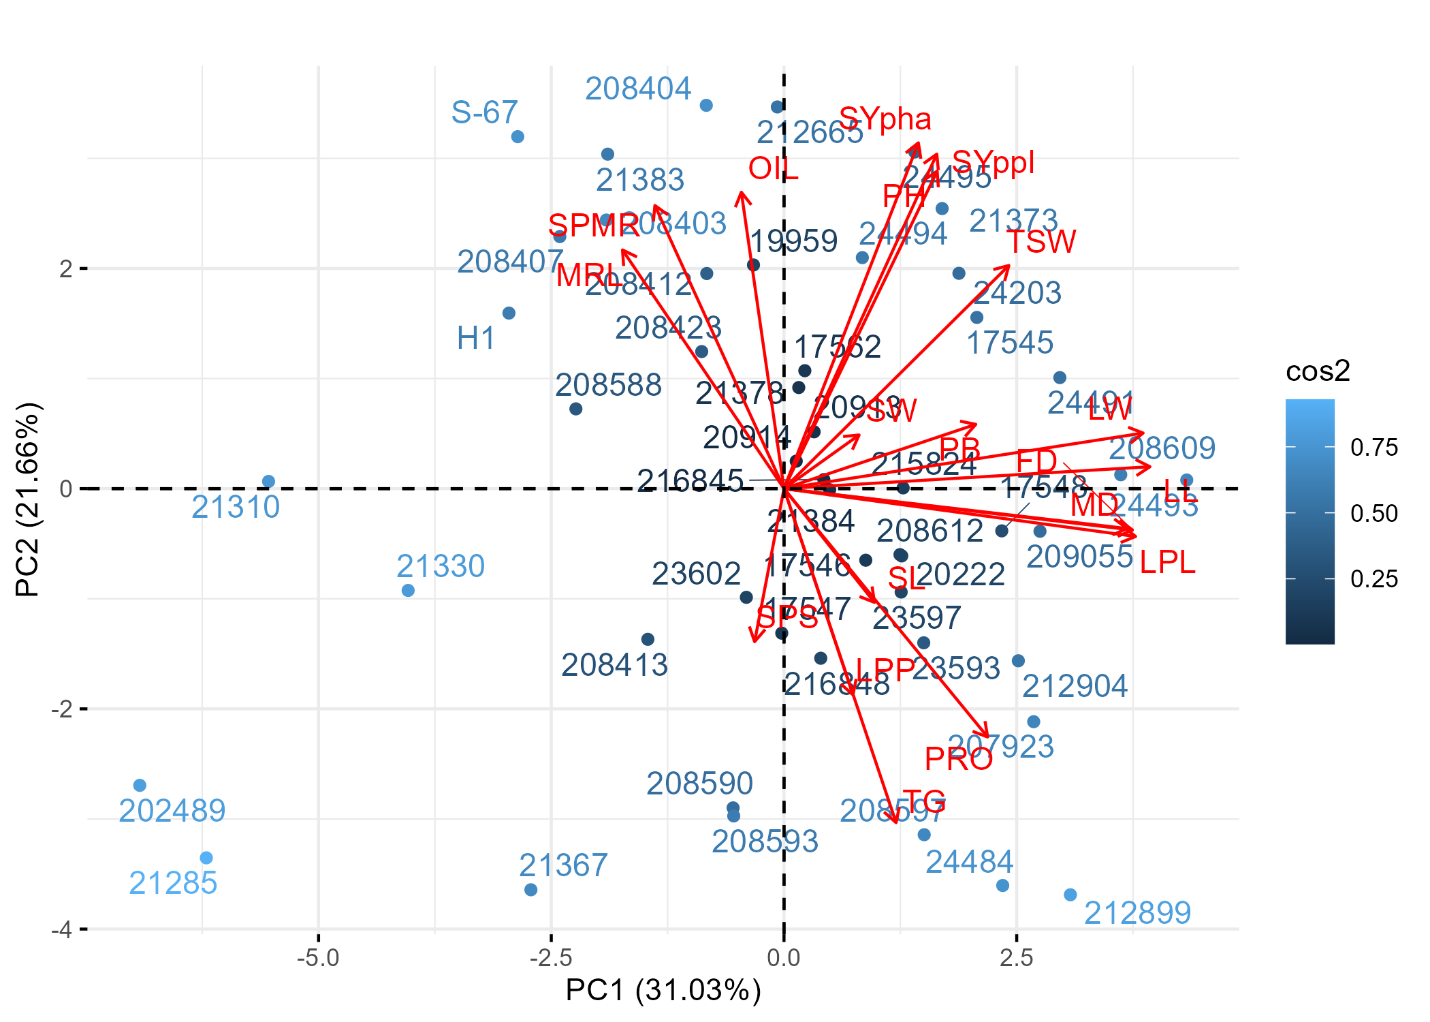
The distribution of accessions on the biplot reveals considerable genetic diversity, suggesting a rich resource for future breeding efforts and highlighting the potential for selecting lines with desirable trait combinations. The PCA biplot demonstrated that accessions 24494, 24495, 21373, 24203 and 17545 were closely aligned with traits such as plant height, seed yield per plant, seed yield per hectare and thousand seed weight, all of which exhibited strong positive loadings on PC2. This close relationship suggests that these accessions are strongly associated with increased plant height and seed yield potential. Similarly, accessions 21383, 208404, 212665, 19959 and 208412 were positioned near the oil content (Figure 3), demonstrating the potential for enhanced seed oil production. In contrast, the released varieties ‘S-67’ and ‘H1’ were not best suited for seed-related and oil traits.
(Abraha et al., 2024) used PCA for the classification of 313 B. carinata accessions for 18 traits and reported the first and second PCs accounted for 34.3% of the observed variability. PC1 explained 22.2% of the variability between the morphological attributes and most strongly accounted for the differences between the accessions, which is a lower proportion than this study PC1 variation (31.03%). The difference may be attributed to differences in the genetic diversity and population structure of the germplasms analyzed. Belete (2011) analyzed 36 B. carinata accessions for nine agro-morphological traits and reported that 91.4% of the total variation was contributed by the first five principal components, which is a comparable result to the 82.03% cumulative variance explained by the first six PCs in our study. Kumar et al. (2020) also applied principal component analysis using seven traits of 11 B. carinata accessions and found that only the first four principal components showed eigenvalues greater than one and they cumulatively explained a similar proportion (82.46%) of the total variability in this study. This suggests that all three datasets capture a large proportion of the total variability within a relatively small number of underlying PCs. The closeness in variability proportion suggests that, despite the differences in sample size and specific traits considered, the patterns of diversity within B. carinata germplasms are consistently captured by a relatively small number of PCs. These PCA results hold significant agricultural implications for informing B. carinata breeding programmes aimed at enhancing seed yield, oil content and overall agronomic performance.
Cluster analysis
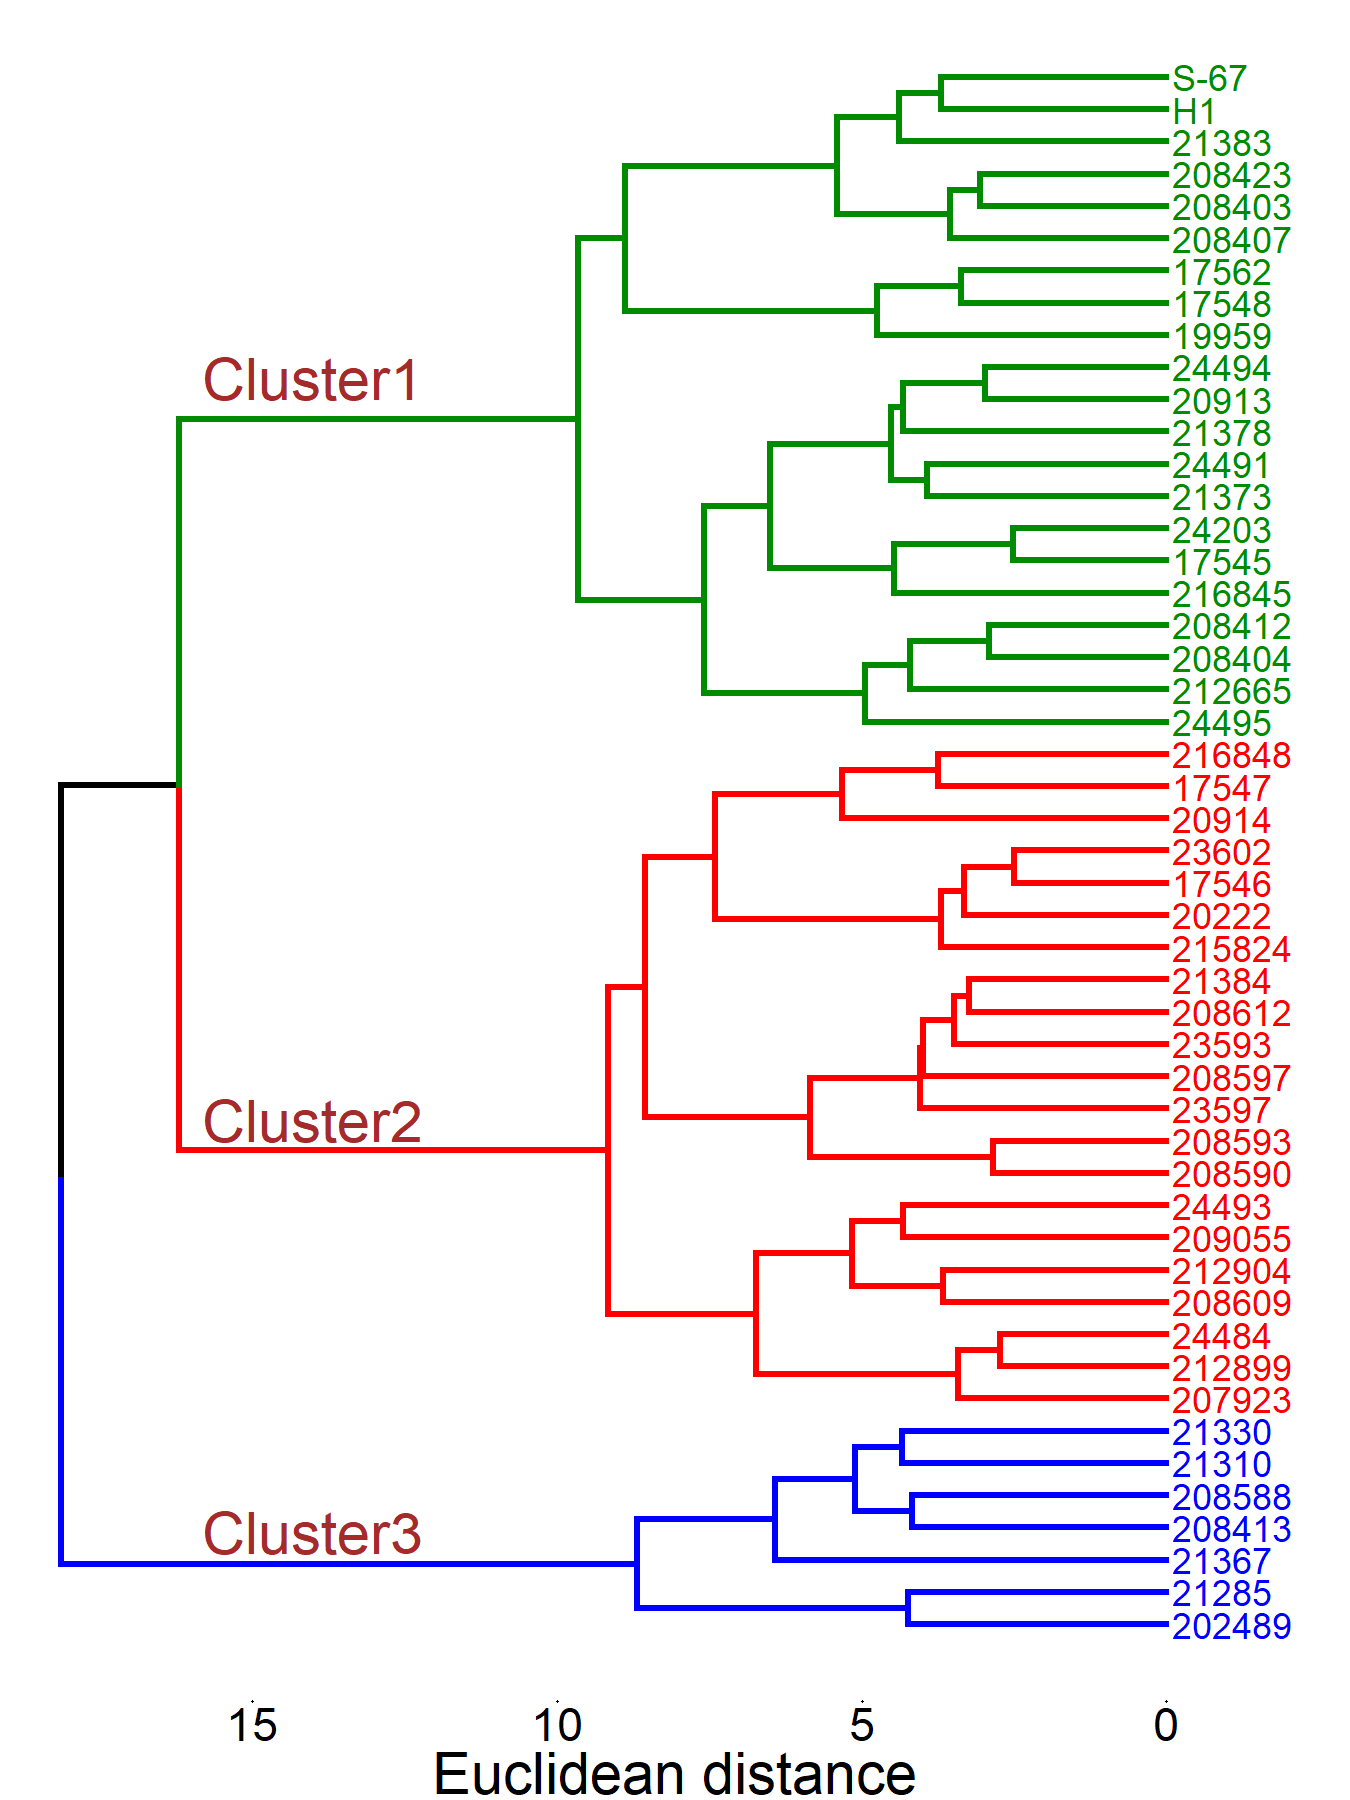
Cluster analysis can be applied to various samples and descriptors to examine the relationships and distances among them. In germplasm collections, it is useful for assessing genetic similarities and differences. Understanding genetic distance, the measure of dissimilarity between accessions, is key to predicting the success of crop improvement efforts (Peeters & Martinelli, 1989).
Cluster analysis conducted on the combined data from Asela and Holeta grouped the tested accessions into three distinct clusters of 21, 21, and 7 members, respectively (Figure 4). The two released varieties were both placed in Cluster I. Cluster I is characterized by the highest mean scores for seed yield per hectare, seed yield per plant, plant height and main raceme length (Supplemental Table 3). Cluster II is distinguished by the highest mean values for leaf petiole length, leaf length, leaf width, number of leaves per plant, days to flowering, days to maturity, number of primary branches per plant, silique length, protein content and total glucosinolate content. Cluster III has the highest mean values for number of siliques per main raceme, number of seeds per silique and seed oil content. Cluster III exhibited the highest intra-cluster distance (5.6), indicating a high level of genetic diversity among the accessions (Supplemental Table 3). The greatest inter-cluster distance was recorded between Cluster II and Cluster III (7.4), which suggests a high level of genetic divergence, making accessions from these clusters promising for hybridization. This was followed by the distance between Cluster I and Cluster III (7.3), and between Cluster I and Cluster II (6.0).
The clustering results from the dendrogram corresponded to the findings of both principal component analysis (PCA) and correlation studies. For instance, accessions 17545, 17562, 24203, 21373, 24494, 24495, 212665, 20913 and 24491 fall in the same quadrant of the PCA biplot and are closely associated with plant height, seed yield per plant, seed yield per hectare, thousand seed weight, number of siliques per main raceme, primary branches per plant, leaf length and leaf width; these traits are significantly positively correlated with seed yield per hectare. The primary distinctions between clusters are influenced by the same characteristics that are significant contributors to the first and second principal components. Accessions grouped within the same cluster exhibited greater similarity to each other than those in separate clusters, further confirming the relationships identified through these analytical methods.
The diversity in cluster numbers identified across B. carinata research, can be attributed to variations in genetic diversity, accession selection and study design. For example, the lower cluster counts reported by (Muthoni, 2010) (two clusters in 47 genotypes) and (Adeniji & Aloyce, 2012) (three clusters in 14 genotypes)are likely due to smaller sample sizes and limited genetic representation. Conversely, studies with larger numbers of more diverse accessions, such as those by (Zada et al., 2013), (Abraha et al., 2024) (eight clusters in 313 genotypes) and (Ambaw et al., 2024) (seven clusters in 386 genotypes), captured greater genetic diversity by incorporating genotypes from multiple geographic regions, agroecological zones and possibly wild relatives.
Our study, which identified three distinct clusters among 47 B. carinata landraces, aligns with the trend observed in these previous studies. The number of clusters we found is consistent with studies that utilized a moderate sample size and landrace accessions, which are known to exhibit substantial genetic diversity. This suggests that while our sample size was comparable to Muthoni (2010), the inclusion of diverse landraces contributed to the identification of a greater number of distinct groups.
These disparities also highlight the impact of methodological choices: more recent studies employing advanced genotyping tools (e.g. SNPs or SSRs) and sensitive clustering algorithms (e.g. STRUCTURE) have enabled a more precise analysis of population structure. In our study, we used phenotypic data for clustering, which, while informative, may not have captured the same level of genetic resolution as molecular markers. However, the congruence between our cluster analysis, PCA, and correlation studies suggests that the phenotypic data effectively revealed meaningful genetic relationships among the accessions.
The variability in cluster numbers underlines the need for standardized experimental approaches that integrate extensive, diverse germplasm collections with high-resolution markers to enhance genetic diversity, refine breeding strategies and preserve adaptive alleles in B. carinata.
Mean performance comparison
Mean seed yield per hectare values for the evaluated accessions showed a clear positive relationship between Asela and Holeta (Supplemental Figure 1). This finding is consistent with studies like Abu, Mengistu, and Molla (2022), who used the Additive Main Effects and Multiplicative Interaction (AMMI) analysis to identify six B. carinata accessions exhibiting relatively stable performance across environments. As mean yield increased at Asela, it also tended to increase at Holeta, indicating that accessions with high seed yield per hectare in one location generally performed well in the other.
Tukey’s mean difference test was applied to traits that showed significant results in the analysis of variance. Based on mean performance accessions 17545, 21373, 21378, 24203, 24493, 24494, 208609, 212665 and 216845 exhibited increased leaf length, increased leaf width, a greater number of primary branches, longer siliques, more seeds per silique, higher thousand seed weight, higher seed yield per hectare, higher oil content, higher protein content and a high total glucosinolate content at both locations (Supplemental Tables 4 and 5, respectively).
However, there were two exceptions: accession 21378 did not rank first in terms of the number of primary branches per plant at either location, and accession 24493 did not rank first for total glucosinolate content at Asela with respect to the traits under consideration. Despite these exceptions, the identified accessions showed strong potential for improving key traits like seed yield, oil content and protein content, all of which are economically valuable. The variability in rankings for 21378 and 24493 accessions with regard to specific traits suggests that these accessions may exhibit trait-specific responses depending on the environment.
In this study, genotypic variation was assessed based on phenotypic differences in the studied traits. Significant variations among the B. carinata accessions were observed, which is consistent with the findings of Tesfaye et al. (2023), who reported moderate genetic diversity in B. carinata populations (average expected heterozygosity = 0.31, polymorphism information content = 0.26), indicating variability among accessions. While our study assessed phenotypic diversity based on mean trait values, Thakur et al. (2020) reported a gene diversity of 0.37, which reflects the average genetic variation within populations. Khedikar et al. (2020) reported low molecular genetic diversity in B. carinata accessions (heterozygosity = 0.30, nucleotide diversity = 1.31×10⁻⁵), suggesting limited variability due to a narrow genetic base and potential inbreeding effects. Phenotypic diversity reflects the combined effects of genetic and environmental factors, while molecular diversity captures variation at the DNA level. Differences in sampling strategies, molecular markers and potential inbreeding effects can influence molecular genetic diversity estimates and contribute to discrepancies between studies. It is important to acknowledge that direct comparisons between phenotypic and molecular diversity estimates should be interpreted with caution, as they reflect different aspects of genetic variation. These differences in genetic diversity estimates could be attributed to variations in the B. carinata populations studied, the types of molecular markers used and the sampling strategies employed. Further research is needed to elucidate the underlying factors contributing to these discrepancies.
Positive correlations between seed yield per plant and siliques per main raceme suggest opportunities for enhancing overall yield (Dwivedi, Singh, & Yadav, 2023; Saini, Singh, Prajapati, & Yadav, 2023). PCA effectively identified key traits: plant height, seed yield per plant, seed yield per hectare, thousand seed weight and oil content driving variation within the B. carinata accessions. This helps in pinpointing promising genotypes for crop improvement, as the initial principal components capture a significant percentage of the total variance, focusing on genetic differences that influence important agronomic traits like seed and oil yield.
Moreover, clustering accessions based on trait similarities supports targeted breeding strategies. However, the variability in genotype rankings across different environments highlights the importance of considering G×E interactions in breeding programmes (Kumar et al., 2020; Tesfaye, Feyissa, Hailesilassie, & Mengistu, 2024). Thus, these findings underscore the need for robust multi-location and multi-season trials to effectively evaluate genotype adaptability and optimize crop improvement efforts for B. carinata. While our study revealed variability in accession rankings across the two locations, suggesting potential G×E interactions, the limited number of experimental sites (Haleta and Asela) restricts our ability to draw strong conclusions. As detailed in the Materials and Methods, seed limitations from EBI constrained our study to these two locations. Consequently, the observed variation may reflect random environmental noise rather than robust G×E patterns. Future studies should prioritize multi-location trials to capture a wider range of environmental influences and provide more reliable insights into genotype adaptability.
Conclusion
The study emphasizes the importance of genetic diversity within B. carinata and the need for multi-location trials to ensure the identification of accessions with stable performance and adaptability across different environments. However, due to limited seed availability from EBI, this study was restricted to two experimental locations, limiting the scope of G×E interaction analysis. Based on our findings, crop improvement efforts should prioritize accessions 24494, 24495, 21373, 24203 and 17545 for yield improvement (based on plant height, seed yield per plant, seed yield per hectare, and thousand seed weight) and accessions 21383, 208404, 212665, 19959 and 208412 for enhanced oil content (based on plant height, seed yield per plant, seed yield per hectare, and oil content). To maximize trait expression, especially for environmentally influenced traits like flowering date and seed yield, location-specific selection is crucial. Additionally, conducting multi-location trials is essential for understanding genotype adaptability and ensuring consistent performance across diverse environments, ultimately supporting more effective crop improvement strategies for B. carinata.
Our cluster analysis aligns with the trend of moderate cluster numbers. However, the use of phenotypic data for clustering, rather than high-resolution molecular markers, may have limited the precision of our genetic diversity assessment. Future studies should integrate advanced genotyping tools and diverse germplasm collections to enhance the understanding of genetic diversity and refine breeding strategies in B. carinata.
Supplemental data
Supplemental Table 1. Passport data of the accessions used and pedigree information of the released varieties
Supplemental Table 2. Loadings, eigenvalues, and variances of principal components with eigenvalues greater than one from PCA of 49 Brassica carinata accessions at Asela and Holeta
Supplemental Table 3. Cluster mean values and intra- and inter-cluster distances for 49 Brassica carinata accessions at Asela and Holeta
Supplemental Table 4. Mean performance evaluation results for 19 traits of 49 Brassica carinata accessions at Asela
Supplemental Table 5. Mean performance evaluation results for 19 traits of 49 Brassica carinata accessions at Holeta
Supplemental Figure 1. Mean Seed yield per hectare (SYpha, in kg) comparison of 49 Brassica carinata accessions in two locations: Asela vs. Holeta
Author Contributions
Ermias Estifanos was responsible for material preparation, data collection, analysis, and drafting the first version of the manuscript. Kassahun Tesfaye contributed to the study conception and design. Tileye Feyissa supervised the study and provided feedback on previous versions of the manuscript. Alemu Lencho facilitated the research process. Christina Eynck conducted the seed analysis, provided resources and provided comments on earlier drafts of the manuscript. All authors read and approved the final manuscript.
Acknowledgements
We are grateful to the Ethiopian Biodiversity Institute, Addis Ababa, Ethiopia, for providing Brassica carinata accessions. We also extend our thanks to Holeta and Kulumsa Agricultural Research Centers for facilitating the field trials, with special thanks to Holeta ARC for supplying seeds of released varieties. Our gratitude goes to Ambo University for partially covering the field trial costs. Lastly, we appreciate the collaboration of Saskatoon Research and Development Centre, Saskatchewan, Canada in determining seed quality traits.
Funding
The fieldwork was partially supported by Ambo University’s student research support fund, and the seed analysis was supported by Saskatoon Research and Development Centre, Agriculture and Agri-Food Canada, Saskatoon, SK, Canada.
Conflict of interest statement
The authors have no relevant financial or non-financial interests to disclose.
Data availability
The raw datasets generated and/or analyzed during the current study are not publicly available as they have not been uploaded to a data repository but are available from the corresponding author upon reasonable request.