Selection of a core collection from the US castor bean germplasm collection
J. Bradley Morrisa,*, Brandon Tonnisa, Zhenbang Chenb and Ming Li Wanga,*
a USDA, ARS, Plant Genetic Resources Conservation Unit, Griffin, GA, 30223, USA
b Department of Crop and Soil Sciences, University of Georgia, Griffin, GA, 30223, USA
* Corresponding authors: J. Bradley Morris (Brad.Morris@usda.gov), Ming Li Wang (MingLi.Wang@usda.gov)
Abstract: Castor bean (Ricinus communis L.) is a medicinal, industrial and biodiesel crop that is adapted to marginal soils in hot, dry and semi-arid environments, but its genetic potential is not fully exploited. Genetic variation exists in different castor bean genebanks, which hold many germplasm accessions. Since there are large numbers of accessions (normally over 1,000 accessions) in any genebank, the efficient way to exploit genetic diversity is to establish a core collection (i.e. 10% of the collection, but maximally representing the genetic diversity of the entire collection). There are 1,033 accessions in the United States Department of Agriculture (USDA) castor genebank, but a castor bean core collection was not available. For assessment of the genetic variation, we evaluated up to 347 accessions with available morphological and seed production data in the Germplasm Resources Information Network (GRIN) for seven qualitative and quantitative descriptors (plant height, maturity, raceme length, seed colour, seed size, stem colour and seed numbers) and then analyzed seeds chemically using nine quantitative traits (oil percentage, palmitic acid, stearic acid, oleic acid, linoleic acid, linolenic acid, gadoleic acid, ricinoleic acid and dihydrosterculic acid content).
Principal component analysis (PCA) was performed and showed that plant architecture, maturity, seed yield, oil percentage, and fatty acid profiles displayed the greatest genetic variation. Based on results from the above analysis, a core collection with 126 accessions was established. The selected accessions were classified into four groups. The results from morphological and chemical analysis were consistent. This core collection represents the genetic diversity of the entire USDA castor bean germplasm collection and can be used for genetic research and breeding improvement programmes.
Keywords: Ricinus communis L., core collection, principal component analysis, fatty acid, morphology
Introduction
Castor bean (Ricinus communis L.) is in the Euphorbiaceae family (Mubofu, 2016) and is distributed in deserts, forests, sand dunes, coastal regions, riverbeds, hill tops, valleys, roadsides, tropical, and wasteland worldwide (Anjani, 2012). Castor oil is the primary economical portion used worldwide, especially for medicinal products, as an ingredient in bath lotions and soaps, and industrial uses such as biodiesel (Morris, 2004; Senthilvel et al, 2017). Castor bean oil content has been shown to range from 37.2 to 60.6% (Wang et al, 2010) among 1,033 accessions in the USDA, Plant Genetic Resources Conservation Unit gene bank collection. An earlier study by Wang et al, 2011 showed that castor oil consisted of mainly eight fatty acids: 1.48% palmitic (C16:0), 1.58% stearic (C18:0), 4.41% oleic (C18:1), 6.42% linoleic (C18:2), 0.68% linolenic (C18:3), 0.45% gadoleic (C20:1), 84.51% ricinoleic (C18:1 – 1OH), and 0.47% dihydroxystearic (C18:0 – 2OH) acids (DHSA). Castor beans have important health considerations because of their use as a laxative (FDA, 2003; Morris et al, 2023). Castor beans have phytochemicals with potential health effects, such as ricin, which can induce cell death in cancers (Olsnes and Pihl, 1981; Calvete et al, 1994; Schnell et al, 1996; Herrera et al, 2003; Herrera et al, 2009; Park et al, 2022), including small-cell lung cancer (Derbyshire and Wawrzynczak, 1992; Zangemeister-Wittke et al, 1993). Castor oil has also been shown to be useful for improving dry eye (Khanal et al, 2007).
Castor bean is grown in Brazil, China, Ethiopia, India, Mozambique, Paraguay and Thailand (Singh et al, 2015; Landoni et al, 2023) with worldwide seed yields of more than 1,3 million tonnes in 2008 (FAO, 2008) and 1.76 million tonnes in 2010 (Cheema et al, 2021). The crop is also cultivated in the Mediterranean area (Cafaro et al, 2025). Pathogens, insects, water and high temperature are the main drivers of low seed yield. Therefore, improving biotic and abiotic resistances are the main objectives for breeding programmes. Genomic technology, bioinformatics, marker trait relations and faster screening tests will improve breeding programmes (Morris et al, 2023).
Genetic resources are required for improving castor bean traits with agronomic importance. Since it is difficult to manage large numbers of castor bean accessions, it is crucial to develop core collections which represent the genetic variation of the entire collection. Castor bean core collections were developed in India (Sarada and Anjani, 2011; Anjani et al, 2018) and China (Xu et al, 2019). The genetic diversity and population structure of castor bean germplasm from 574 accessions of the US castor bean collection were evaluated using 22 polymorphic expressed sequence tag-simple sequence repeats (EST-SSR) markers (Wang et al, 2017). However, a castor bean core collection has not been developed from the United States Department of Agriculture (USDA) castor bean germplasm because the entire collection (1,033 accessions) had not been previously evaluated by EST-SSR markers. A smaller group of accessions representing the diversity of the entire germplasm collection of a species, is the method needed to strengthen the use of germplasm in cultivar development (Upadhyaya et al, 2014). Castor bean germplasm originating from across the globe will aid in the development of a core collection, which represents the genetic variation of the entire collection. Therefore, the main objective of this study was to establish a core collection from the entire USDA castor bean germplasm collection (1,033 accessions) based on fatty acid composition and EST-SSR and up to 347 accessions with available morphological and seed production data in GRIN using principal component analysis (PCA) and genetic diversity analysis.
Materials and methods
Plant material and morphological descriptors
Castor bean seeds used in this study originated from the entire US castor bean germplasm collection consisting of 1,033 accessions, which are maintained at the USDA, ARS, Plant Genetic Resources Conservation Unit (PGRCU), Griffin, Georgia and the National Center for Genetic Resources Preservation (NCGRP), Ft. Collins, Colorado. The regeneration field was rotovated prior to planting castor accessions. Data recorded originated from 1,033 castor accessions in cold storage at -18°C for oil content and fatty acids. However, up to 347 accessions were planted by hand or using a cone planter and grown during 1995 to 2015 in regeneration cycles and evaluated for morphological and seed production data. The additional castor accessions require evaluating in the future. Approximately 20 plants/accession were grown in each cycle. Plants were irrigated using an overhead water gun and fertilized with 20:20:20 side dressing as needed. Climatic conditions showed an average maximum and minimum temperature of 22.6°C and 10.7°C, respectively. Total precipitation was 125.88cm and 118 total rainy days.
Oil content
The seed oil content was measured for the entire castor bean collection (1,033 accessions) using a mini spec mq10 nuclear magnetic resonance (NMR) analyzer (Bruker Optics Inc., Houston, TX). All accessions were measured in triplicate to verify the precision of the NMR signal. The castor oil content was averaged from three replications. The NMR analyzer was operated at a resonance frequency of 9.95MHz and was maintained at 40°C. Our earlier results showed that even small differences in sample temperature can have a substantial effect on the NMR signal of castor oil. To avoid this effect, all samples were tempered to 40°C for 90 min before measurements.
Fatty acid profiling
The fatty acid composition of castor bean seeds was analyzed for the entire castor bean collection (1,033 accessions) by gas chromatography (GC) using a Hewlett Packard 5890 Series II gas chromatograph equipped with a flame ionization detector (FID) and an HP-7673 autosampler. A fatty acid methyl ester (FAME) standard mix RM-3 (purchased from Sigma) was used to establish peak retention times. Peak separation was performed on a DB-225 capillary column (15m × 0.25mm i.d. with a 0.25μm film) from Agilent Technologies. The carrier gas was helium set to a flow rate of 1.2ml/min. One μl of sample was injected into the column maintained isothermally at 200°C, with an injection temperature of 280°C and a detection temperature of 300°C. Total run time for each sample was 12 minutes. Fatty acid composition was determined by identifying and calculating relative peak areas. For sample preparation, 10–15 castor bean seeds were pressed by a hydraulic jack to release castor oil. One drop of castor oil was transferred into a 16 × 100mm disposable test tube, and 5.0ml of n-heptane (Fisher Scientific) was added to extract the oil. For the conversion of fatty acids to methyl esters, 500μl of 0.5 N sodium methoxide (NaOCH3) in methanol solution was added to the test tube and mixed with the sample. The reaction proceeded for 2 hours, and then 7.0ml of distilled water was added to the test tube to separate the organic layer from the aqueous layer and castor bean residue (45 min). Afterwards, 1.5ml from the organic layer containing methyl esters was transferred to a 2.0ml autosampler vial for GC analysis.
SSR marker analysis
DNA was extracted from three seed tissue samples (~150mg), which had been used for fatty acid analysis. This would ensure that the generated DNA would be reliable for future oil and fatty acid association analysis. Publicly available EST-SSR markers (Qiu et al, 2010) were used to evaluate eight chosen castor bean accessions. Twenty-two polymorphic EST-SSR markers were used for genotyping 574 castor bean accessions.
Cluster analysis
Clustering for the core was then performed on the morphological and chemical data by entering the similarity matrix into PROC CLUSTER for cluster analysis with the unweighted paired group method using mathematical averages (UPGMA, Sneath and Sokal, 1973; Rohlf, 2000) by specifying the AVERAGE option (SAS Institute, 2012). Following the method proposed by Nei and Li (1979), genetic diversity among 126 accessions for the core collection was calculated using NTAYA-pc software (version 2.10e, Numerical Taxonomy and Multivariate Analysis System, Rohlf, 2000). Genetic dissimilarity matrix was calculated by using SIMINT (similarity for interval data), the average genetic distance between any two accessions was calculated using the following formula:
DISTij = .
In the formula, i and j represent different accessions, k represents the traits investigated, and n represents the total number of traits investigated. Cluster analysis was conducted according to the unweighted pair group method and arithmetic average (UPGMA, Sneath and Sokal, 1973; Rohlf, 2000). Dissimilarity coefficient (Rohlf, 2000) was used to measure the genetic diversity between any two accessions.
Principal component analysis
Principal component analysis using PROC PRINCOMP (SAS Institute, 2012) was used for multivariate analysis of the data. Descriptor data has not been determined for the entire castor bean collection in the USDA, ARS, PGRCU collection, consisting of 1,033 accessions. Up to 347 accessions with descriptor characteristic data recorded from the field from 1996 to 2015 were used in the development of the core collection. Eigenvalues, the percentage of variances explained by each principal component, eigenvectors, and Pearson correlation coefficients were also determined for the core collection.
Results
Development of a core collection
The entire castor bean collection (1,033 accessions) was used in the development of a core collection by analyzing these accessions for oil content and fatty acid composition. Based on the variation for oil content (ranging from 37.2 to 60.6%) and fatty acid profiles in castor bean including 1.48% palmitic (C16:0), 1.58% stearic (C18:0), 4.41% oleic (C18:1), 6.42% linoleic (C18:2), 0.68% linolenic (C18:3), 0.45% gadoleic (C20:1), 84.51% ricinoleic (C18:1-1OH), and 0.47% dihydroxystearic (C18:0-2OH) acid profiles, the number of accessions was reduced to 574. These were genotyped with 22 SSR markers, and the number of accessions was reduced further by removing similar accessions. After the first cluster analysis using neighbour-joining analysis (Wang et al, 2017) with 273 accessions, 45 accessions, which showed identical branching and 5 accessions with missing data were removed from further cluster analysis. A second cluster analysis using neighbour-joining analysis (Wang et al, 2017) included 223 accessions, which showed a total genetic distance coefficient reduction from 798.31 to 788.27, meaning the number of accessions could be reduced by 18.3% with only a 1.2% total genetic diversity loss. After this second cluster analysis, 97 accessions were removed from the branches, including multiple accessions showing less than ten dissimilarity coefficient units. The total genetic dissimilarity coefficient among the core of 126 accessions still shows 755.45. More than 95% of the genetic diversity was retained from only 46% (126 accessions) (Figure 1) of the total 273 accessions.
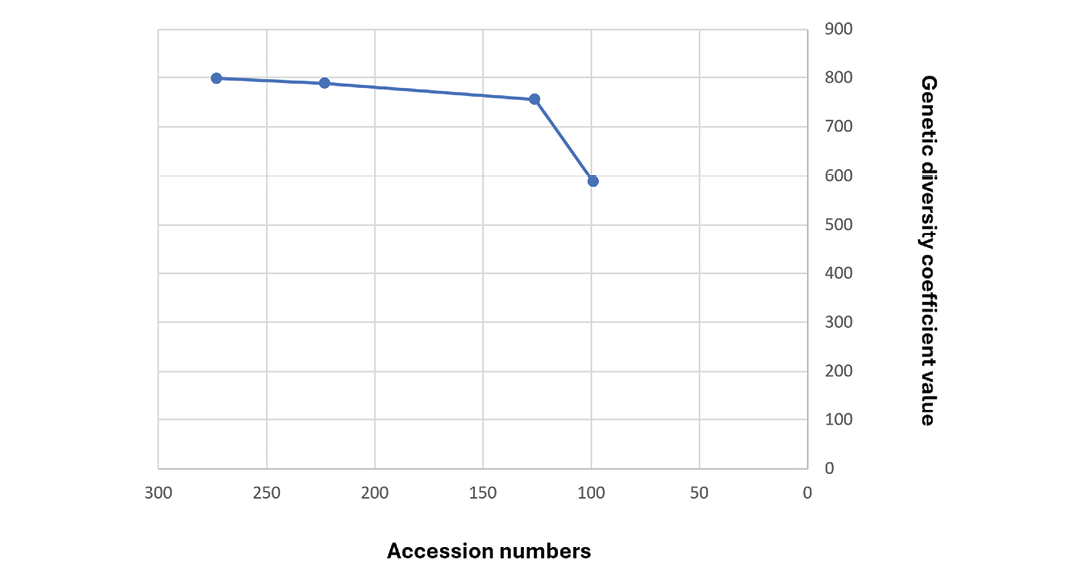
A further reduction of 27 accessions would significantly reduce the genetic diversity by 23%. Therefore, these 126 accessions will be utilized for core development in the castor bean collection. This castor bean core collection (Supplemental Table 1) represents accessions from Afghanistan (1), Algeria (3), Argentina (4), Benin (1), Brazil (9), Bulgaria (1), Colombia (1), Cuba (2), Democratic Republic of the Congo (1), Egypt (2), Greece (1), India (36), Iran (16), Jordan (1), Kenya (1), Mexico (2), Morocco (2), Pakistan (1), Panama (1), Paraguay (1), Peru (2), Serbia (1), South Africa (14), former Soviet Union (3), Syria (1), Turkey (13), United States (3), and Uruguay (2).
The scheme showing how the castor core collection was selected is outlined below:
- Chemical analysis based on oil content and fatty acid profiles (1,033 accessions).
- Based on the variation for oil content and fatty acid profiles, the number of accessions was reduced to 574 and these were genotyped with 22 SSR markers.
- First cluster analysis (273 accessions).
- 50 accessions showing identical branching and missing data were removed.
- Second cluster analysis (223 accessions).
- 97 accessions removed from branches including multiple accessions with <10 dissimilarity coefficient units.
- 95% of genetic diversity retained (126 accessions used to form the core collection).
- Confirmation using principal component and cluster analysis of chemical, morphological, and reproductive traits (up to 347 accessions) was used to verify the core collection of 126 accessions.
Descriptor data
Castor bean descriptor data in the Germplasm Resources Information Network (GRIN) (USDA, 2024) was used for recording qualitative and quantitative observations on up to 347 accessions over the period of 1995 - 2015. Plant characteristics for plant height (dm), maturity (early, midseason, late), raceme length (cm), and stem colour (green, red, mixture of green and red) were recorded from an average of 20 plants/accession at 50% maturity. Seed colour (brown, tan, reddish brown), seed size (small, medium, large) and seed numbers were recorded from all plants after seed drying. The qualitative characteristics were measured according to the scales shown in Supplemental Table 2. The data may represent different accessions for each of the descriptors and GRIN may not be up to date.
Confirmation of diversity of the core collection
Confirmation analysis using principal component and cluster analysis was used to verify this core collection. The number of accessions used in this analysis consisted of 262 to 347 accessions for the original collection. This range was necessary because not all of the original castor accessions had been characterized for morphological, reproductive and phenological data. The means for morphological, phenological and reproductive traits in the core and original accessions were similar (Table 1).
Table 1. Comparison of means, ranges, and variances for seven morphological, phenological, and reproductive traits in the core and original accessions after removal of similar accessions based on EST-SSR markers. SE, Standard error; SD Standard deviation.
|
Original collection |
||||||
|
Trait |
N |
Mean ± SE |
SD |
Range |
Variance |
T-value |
|
Plant height (cm) |
285 |
21 ± 0.54 |
9.05 |
5–43 |
81.9 |
< 0.0001 |
|
Maturity |
293 |
4.2 ± 0.19 |
3.19 |
1–9 |
10.2 |
< 0.0001 |
|
Raceme length (cm) |
262 |
27.6 ± 0.71 |
11.49 |
10–61 |
132.1 |
< 0.0001 |
|
Seed colour |
275 |
1.6 ± 0.05 |
0.83 |
1–3 |
0.69 |
< 0.0001 |
|
Seed size |
273 |
4.2 ± 0.14 |
2.28 |
1–9 |
5.2 |
< 0.0001 |
|
Stem colour |
295 |
1.6 ± 0.04 |
0.64 |
1–3 |
0.42 |
< 0.0001 |
|
Seed number |
347 |
523 ± 30.1 |
560.26 |
44–4321 |
313,898 |
< 0.0001 |
|
Core collection |
||||||
|
Trait |
N |
Mean ± SE |
SD |
Range |
Variance |
T-value |
|
Plant height (cm) |
126 |
22 ± 0.85 |
9.5 |
5–43 |
90.3 |
<0.0001 |
|
Maturity |
126 |
4.1 ± 0.27 |
3.08 |
1–9 |
9.5 |
<0.0001 |
|
Raceme length (cm) |
126 |
29.3 ± 1.11 |
12.47 |
10–61 |
155.5 |
<0.0001 |
|
Seed colour |
126 |
2 ± 0.08 |
0.84 |
1–3 |
0.72 |
<0.0001 |
|
Seed size |
126 |
4 ± 0.21 |
2.35 |
1–9 |
5.5 |
<0.0001 |
|
Stem colour |
126 |
2 ± 0.06 |
0.62 |
1–3 |
0.38 |
<0.0001 |
|
Seed number |
126 |
750 ± 69.2 |
776.83 |
44–4321 |
603469 |
<0.0001 |
The range of mean values were identical in the core when compared to the original accessions. Variances between the core and original accessions (262 to 347 accessions), except for seed number, were homogenous, indicating that the diversity of the original accessions was represented in the core collection (Table 1). The correlation patterns for morphological, phenological and reproduction traits (Table 2) were similar in the original accessions and core collection, showing that associations observed in the original accessions were well represented in the core collection.
Table 2. Pearson correlation coefficients for morphological, phenological, and reproductive traits in the core and original castor bean core collection. Above the diagonal are correlation coefficients involving core collection accessions; below the diagonal are correlation coefficients involving the original accessions after removal of similar phytochemical accessions based on EST-SSR markers. *, Significant at p = 0.05; **, Significant at p = 0.01; ***, Significant at p = 0.001.
|
Trait |
Plant height |
Maturity |
Raceme length |
Seed colour |
Seed size |
Stem colour |
Seed number |
|
Plant height |
-0.01 |
0.25** |
-0.1 |
-0.0008 |
0.04 |
-0.08 |
|
|
Maturity |
-0.1 |
0.12 |
0.11 |
0.02 |
-0.04 |
0.02 |
|
|
Raceme length |
0.29*** |
0.15* |
-0.01 |
0.01 |
0.04 |
-0.05 |
|
|
Seed colour |
-0.04 |
0.13* |
0.04 |
0.37*** |
0.2* |
-0.21* |
|
|
Seed size |
0.03 |
-0.02 |
0.04 |
0.29*** |
0.21* |
-0.22** |
|
|
Stem colour |
0.05 |
-0.06 |
0.06 |
0.19** |
0.24*** |
-0.02 |
|
|
Seed number |
-0.01 |
-0.01 |
-0.01 |
-0.14* |
-0.2** |
0.02 |
Six of the 21 correlation coefficients in the core collection were significant (P = 0.01, P = 0.05, P = 0.001) and ranged from 0.2 to 0.37.
The means and ranges for oil percentage and fatty acid traits were nearly identical between the core and original accessions (Table 3).
Table 3. Comparison of means, ranges, and variances for nine oil and fatty acid traits in the core and original accessions after removal of similar accessions based on EST-SSR markers.
|
Original collection |
||||||
|
Trait |
N |
Mean ± SE |
SD |
Range |
Variance |
T-value |
|
Oil % |
347 |
48.7 ± 0.14 |
2.72 |
35–61 |
7.41 |
> 0.0001 |
|
Palmitic (16:0) |
346 |
1.5 ± 0.01 |
0.19 |
1.04–2.44 |
0.03 |
> 0.0001 |
|
Stearic (18:0) |
346 |
1.6 ± 0.02 |
0.42 |
0.87–4.6 |
0.18 |
> 0.0001 |
|
Oleic (18:1) |
346 |
4.9 ± 0.06 |
1.12 |
2.41–9.77 |
1.25 |
> 0.0001 |
|
Linoleic (18:2) |
346 |
6.4 ± 0.03 |
0.61 |
4.76–8.79 |
0.38 |
> 0.0001 |
|
Linolenic (18:3) |
346 |
0.7 ± 0.009 |
0.16 |
0.46–1.45 |
0.02 |
> 0.0001 |
|
Gadoleic (20:1) |
346 |
0.5 ± 0.007 |
0.13 |
0.18–0.91 |
0.01 |
> 0.0001 |
|
Ricinoleic |
346 |
83.9 ± 0.08 |
1.58 |
78.59–87.73 |
2.52 |
> 0.0001 |
|
Dihydroxystearic |
346 |
0.5 ± 0.005 |
0.1 |
0.19–0.92 |
0.01 |
> 0.0001 |
|
Core collection |
||||||
|
Trait |
N |
Mean ± SE |
SD |
Range |
Variance |
T-value |
|
Oil % |
126 |
48.9 ± 0.28 |
3.19 |
35–61 |
10.18 |
< 0.0001 |
|
Palmitic (16:0) |
126 |
1.5 ± 0.2 |
0.17 |
1.14–2.12 |
0.03 |
< 0.0001 |
|
Stearic (18:0) |
126 |
1.6 ± 0.03 |
0.33 |
0.87–3 |
0.11 |
< 0.0001 |
|
Oleic (18:1) |
126 |
5 ± 0.09 |
1 |
3.05–8.26 |
1 |
< 0.0001 |
|
Linoleic (18:2) |
126 |
6.4 ± 0.05 |
0.6 |
4.76–8.68 |
0.36 |
< 0.0001 |
|
Linolenic (18:3) |
126 |
0.7 ± 0.01 |
0.15 |
0.46–1.41 |
0.02 |
< 0.0001 |
|
Gadoleic (20:1) |
126 |
0.5 ± 0.01 |
0.13 |
0.22–0.9 |
0.01 |
< 0.0001 |
|
Ricinoleic |
126 |
83.8 ± 0.12 |
1.35 |
79.05–86.99 |
1.84 |
< 0.0001 |
|
Dihydroxystearic |
126 |
0.5 ± 0.008 |
0.09 |
0.27–0.74 |
0.008 |
< 0.0001 |
The variances for oil percentage and fatty acid traits were homogenous, indicating that diversity from the original accessions was captured in the core collection (Table 3). The correlation pattern for oil percentage and fatty acid traits (Table 4) was similar in the original accessions and core collection, showing that associations observed in the original accessions were well represented in the core collection.
Table 4. Pearson correlation coefficients for oil percentage and fatty acid traits in the core and original accessions after removal of similar phytochemical accessions based on EST-SSR markers. Above the diagonal are correlation coefficients involving core collection accessions; below the diagonal are correlation coefficients involving the original accessions after removal of similar phytochemical accessions based on EST-SSR. *, Significant at p = 0.05; **, Significant at p = 0.01; ***, Significant at p = 0.0001.
|
Trait |
Oil % |
16:0 |
18:0 |
18:1 |
18:2 |
18:3 |
20:1 |
Ricinoleic |
DHSA |
|
Oil % |
-0.04 |
-0.05 |
0.17* |
0.11 |
-0.31** |
0.05 |
-0.13 |
0.004 |
|
|
16:0 |
0.02 |
0.18* |
-0.04 |
0.7*** |
0.25** |
-0.05 |
-0.42*** |
-0.53*** |
|
|
18:0 |
-0.03 |
0.23*** |
0.29** |
-0.03 |
-0.11 |
0.05 |
-0.43*** |
-0.31** |
|
|
18:1 |
0.1* |
-0.02 |
0.36*** |
-0.01 |
-0.42*** |
0.45*** |
-0.76*** |
-0.33** |
|
|
18:2 |
0.06 |
0.71*** |
0.04 |
0.01 |
0.1 |
0.32** |
-0.53*** |
-0.12 |
|
|
18:3 |
-0.28*** |
0.32*** |
0.09 |
-0.39*** |
0.16** |
-0.16 |
0.18* |
-0.06 |
|
|
20:1 |
-0.006 |
-0.04 |
0.12* |
0.51*** |
0.32*** |
-0.11* |
-0.56*** |
0.1 |
|
|
Ricinoleic |
-0.06 |
-0.44*** |
-0.57*** |
-0.79*** |
-0.53*** |
0.06 |
-0.59*** |
0.37*** |
|
|
DHSA |
-0.04 |
-0.54*** |
-0.26*** |
-0.25*** |
-0.15** |
-0.18** |
0.13* |
0.32*** |
Eighteen of the 36 correlation coefficients in the core collection were significant (P = 0.01, P = 0.05, P = 0.0001) and were in the range from 0.17 to 0.76.
Cluster analysis
Average distance cluster analysis from morphological data grouped the core castor accessions into four well-defined clusters with distinct plant height, raceme length and seed numbers (Supplemental Figure 1).
Twelve accessions in clusters 1 and 2 showed the shortest plants (mean of 16dm) and raceme length (mean of 21cm), and the highest mean seed numbers (2,949). Thirty-nine accessions in cluster 3 showed the tallest plants (25dm), the second-longest raceme length (29cm), and medium seed numbers (1,021). Seventy-five accessions in cluster 4 showed a mean of medium height (21dm), longest raceme length (30cm), and the lowest seed number (305).
Average distance cluster analysis from the chemical data grouped the core castor accessions into four well-defined clusters with distinct oil content and fatty acid concentrations. (Supplemental Figure 2).
Cluster 1 had three accessions and showed the highest DHSA content (0.52%), second-highest stearic, oleic, gadoleic acid content (1.8, 5.1, 0.52%, respectively), and the lowest linoleic acid and linolenic acid content (6.1 and 0.61%, respectively). Clusters 1 and 3 showed the highest ricinoleic acid content (84%), and the lowest oil content (45%). Cluster 2 (2 accessions) showed the highest oil, stearic, oleic, linoleic, gadoleic acid content (49, 2.2, 8.2, 6.8, and 0.59%, respectively), and the lowest mean DHSA and ricinoleic acid content (0.36 and 79.6% respectively). Cluster 3 (29 accessions) showed the highest linolenic acid content (0.75%), the third highest mean stearic, linoleic, DHSA content (1.7, 6.4, 0.47%, respectively), and lowest gadoleic acid content (0.46%). Cluster 4 (92 accessions) showed the second highest mean oil, linoleic, and DHSA content (48, 6.5 and 0.5%, respectively), lowest mean stearic acid (1.6%), third highest gadoleic, and DHSA content (0.64 and 0.5, respectively). Clusters 3 and 4 had the third-highest oleic acid content (5%). Clusters 2 and 4 had the second-highest linolenic acid content (0.64%). These results show variation for oil, stearic, oleic, linoleic, linolenic, gadoleic, ricinoleic acid, and DHSA seed traits in castor beans. Average distance cluster analysis was also performed using both morphological and chemical data (Figure 2). The core collection was still grouped into four clusters with the same accession numbers for each group (Cluster 1 with 4 accessions, Cluster 2 with 8 accessions, Cluster 3 with 39 accessions, and Cluster 4 with 75 accessions). However, some accession listed orders were switched within each cluster. This means that our cluster analysis was very robust and consistent.

Principal component analysis
Phenotypic, maturity, and seed reproduction principal component analysis accounted for 24% and 22% of the total variation at the first principal component in the core and the original accessions, respectively (Table 5).
Table 5. Eigenvalues and the proportion of total phenotypic, maturity, seed reproduction, oil, and fatty acid variability among the core and original castor bean accessions as explained by the principal components.
|
Principal component |
Eigenvalue |
% Variability |
% Cumulative |
|||
|
Core |
Original |
Core |
Original |
Core |
Original |
|
|
Phenotypic, maturity, and seed reproduction |
||||||
|
1 |
1.677 |
1.749 |
23.96 |
21.86 |
23.96 |
21.86 |
|
2 |
1.3014 |
1.5019 |
18.59 |
18.77 |
42.55 |
40.64 |
|
3 |
1.0744 |
1.1584 |
15.35 |
14.48 |
57.9 |
55.12 |
|
4 |
0.9739 |
1.0328 |
13.91 |
12.91 |
71.81 |
68.03 |
|
5 |
0.7032 |
0.8104 |
10.05 |
10.13 |
81.86 |
78.16 |
|
6 |
0.6737 |
0.6983 |
9.63 |
8.73 |
91.49 |
86.89 |
|
Oil and fatty acids |
||||||
|
1 |
2.9463 |
3.0218 |
32.74 |
33.58 |
32.74 |
33.58 |
|
2 |
1.9622 |
2.0021 |
21.8 |
22.25 |
54.54 |
55.82 |
|
3 |
1.348 |
1.2053 |
14.98 |
13.39 |
69.52 |
69.21 |
|
4 |
1.0663 |
1.1695 |
11.85 |
12.99 |
81.37 |
82.21 |
|
5 |
0.6688 |
0.6791 |
7.43 |
7.55 |
88.8 |
89.76 |
|
6 |
0.57 |
0.5461 |
6.33 |
6.07 |
95.13 |
95.82 |
The amount of variation accounted for, cumulatively, by adding principal components 2 through 6 was 43, 58, 72, 82, 91%, and 41, 55, 68, 78, 87% for the core and original castor bean accessions, respectively. The first principal component was most correlated with seed colour and seed size in the core and plant height and raceme length in the original accessions (Table 6).
Table 6. Eigenvectors, principal components for seven phenotypic, maturity, seed, and nine oil, fatty acid traits in the core and original castor bean accessions.
|
Original collection |
||||||
|
Principal components |
||||||
|
Trait |
1 |
2 |
3 |
4 |
5 |
6 |
|
Plant height (dm) |
0.57 |
-0.007 |
-0.21 |
-0.23 |
0.08 |
0.36 |
|
Maturity |
-0.12 |
0.23 |
0.76 |
0.2 |
0.1 |
-0.05 |
|
Raceme length (cm) |
0.52 |
0.05 |
0.28 |
0.09 |
0.4 |
-0.33 |
|
Seed colour |
-0.11 |
0.61 |
0.05 |
0.15 |
-0.27 |
0.52 |
|
Seed size |
-0.04 |
0.55 |
-0.25 |
-0.14 |
0.65 |
0.05 |
|
Stem colour |
0.17 |
0.36 |
-0.39 |
0.52 |
-0.28 |
-0.5 |
|
Seed number |
0.02 |
-0.34 |
-0.09 |
0.75 |
0.33 |
0.42 |
|
Oil % |
0.05 |
-0.15 |
0.1 |
-0.77 |
0.48 |
0.35 |
|
Palmitic (16:0) |
0.35 |
0.48 |
0.09 |
-0.19 |
-0.08 |
-0.23 |
|
Stearic (18:0) |
0.33 |
-0.01 |
-0.48 |
0.19 |
0.62 |
-0.31 |
|
Oleic (18:1) |
0.38 |
-0.43 |
-0.2 |
0.004 |
-0.25 |
0.13 |
|
Linoleic (18:2) |
0.35 |
0.28 |
0.55 |
-0.08 |
-0.006 |
-0.23 |
|
Linolenic (18:3) |
0.008 |
0.51 |
-0.03 |
0.37 |
0.3 |
0.61 |
|
Gadoleic (20:1) |
0.31 |
-0.32 |
0.41 |
0.31 |
0.008 |
0.39 |
|
Ricinoleic |
-0.55 |
0.12 |
-0.01 |
-0.08 |
-0.03 |
0.03 |
|
Dihydrosterculic |
-0.28 |
-0.28 |
0.46 |
0.26 |
0.45 |
-0.32 |
|
Core collection |
||||||
|
Principal components |
||||||
|
Trait |
1 |
2 |
3 |
4 |
5 |
6 |
|
Plant height (dm) |
0.02 |
0.67 |
-0.28 |
-0.03 |
0.63 |
0.11 |
|
Maturity |
0.09 |
0.16 |
0.86 |
0.1 |
0.32 |
-0.25 |
|
Raceme length (cm) |
0.09 |
0.67 |
0.15 |
0.11 |
-0.68 |
0.14 |
|
Seed colour |
0.57 |
-0.18 |
0.19 |
0.005 |
-0.02 |
0.1 |
|
Seed size |
0.58 |
-0.07 |
-0.04 |
-0.007 |
0.11 |
0.59 |
|
Stem colour |
0.37 |
0.01 |
-0.31 |
0.69 |
0.006 |
-0.5 |
|
Seed number |
-0.4 |
-0.12 |
0.14 |
0.69 |
0.09 |
0.52 |
|
Oil % |
0.11 |
-0.23 |
0.24 |
-0.75 |
0.07 |
0.54 |
|
Palmitic (16:0) |
0.31 |
0.54 |
0.03 |
-0.17 |
0.07 |
-0.2 |
|
Stearic (18:0) |
0.27 |
-0.02 |
-0.51 |
0.13 |
0.73 |
0.24 |
|
Oleic (18:1) |
0.41 |
-0.37 |
-0.17 |
0.06 |
-0.37 |
0.02 |
|
Linoleic (18:2) |
0.33 |
0.35 |
0.5 |
-0.06 |
0.2 |
-0.17 |
|
Linolenic (18:3) |
-0.13 |
0.49 |
0.01 |
0.31 |
-0.21 |
0.73 |
|
Gadoleic (20:1) |
0.31 |
-0.25 |
0.4 |
0.45 |
-0.06 |
0.17 |
|
Ricinoleic |
-0.55 |
0.05 |
-0.04 |
-0.12 |
0.009 |
-0.06 |
|
Dihydrosterculic |
-0.31 |
-0.25 |
0.46 |
0.23 |
0.47 |
0.01 |
The second principal component accounted for 19% of the variation in the core and original accessions, and was mostly due to plant height and raceme length in the core, while seed colour and seed size were mostly correlated in the original accessions. The third principal component explained 15% and 14% of the variation in the core and original accessions, respectively, and was composed primarily of maturity. The fourth principal component accounted for 14% and 13% of the variation in the core and original castor accessions and was most correlated with stem colour and seed number. The fifth principal component explained 10% of the variation in the core and original accessions and mostly correlated with plant height and raceme length in the core and seed size in the original accessions. The sixth principal component explained 10% and 9% of the variation in the core and original accessions and was composed primarily of seed size, stem colour, and seed number in the core. However, seed colour and stem colour were mostly correlated in the original accessions. Therefore, castor bean cultivars from this core collection could be developed with improved architecture, early or late maturity, and low or high seed yield.
Percent oil and fatty acids accounted for 33% and 34% of the total variation in the core and original accessions, respectively, at the first principal component (Table 5). The cumulative amount of variation for components 2 through 6 was 55% to 96% in the core and original accessions. The first principal component was mostly correlated with ricinoleic acid in the core and original accessions, while the second principal component correlated with palmitic and linolenic acid (Table 6). The third principal component was mostly correlated with stearic and linoleic acid. The fourth principal component was primarily correlated with oil percentage, while the fifth principal component correlated mostly with stearic acid. The sixth principal component mostly correlated with linolenic acid. Therefore, potential exists to develop castor bean cultivars from this core collection with improved oil percentage and fatty acid profiles.
Discussion
Genebanks worldwide curate collections containing many accessions and may restrict uses of genetic diversity (Gireesh et al, 2023). Genetic variation in genetic resource collections is essential for plant breeding. Since large germplasm collections may inhibit use, smaller core collections could be developed from these larger collections to represent diversity for target traits (Frankel, 1984). Core collections were developed in sugarcane (Saccharum spontaneum L.) (Tai and Miller, 2001), Medicago (Diwan et al, 1994), barley (Hordeum vulgare L.) (Yuan et al, 2024), sorghum (Sorghum bicolor L.) (Upadhyaya et al, 2009), peanut (Arachis hypogaea L.) (Holbrook and Dong, 2005), and foxtail millet (Setaria italica L.) (Choi et al, 2018). A barley core collection was shown to consist of disease-resistant loci and can be used in strengthening barley hardiness (Yuan et al, 2024). Comparing means, variances, and correlation coefficients for the castor bean traits in the entire and core collections (Tables 1, 2, 3 and 4) in this study show that genetic variation has been preserved in the core collection containing 126 accessions. This core collection, developed based on fatty acid profiling, provides sources of variation useful in castor bean improvement. Multivariate analysis, including cluster and principal component analysis, is useful for constructing core collections (van Hintum et al, 2000; Ruperao, 2024), and have been used on sugarcane (Tai and Miller, 2001), perennial Medicago (Basigalup et al, 1995), sesame (Sesamum indicum L.) (Yol and Uzun, 2012) and tea (Camelliasinensis L. O. Kuntze) (Kottawa-Arachchi et al, 2024).
Generally, core collections should be 10% of the whole collection and less than 2,000 accessions and contain approximately 70% of the variation (Brown, 1989). However, some core collections represent 5–10% showing 75–90% of the variation (Charmet and Balfourier, 1995; Bisht et al, 1998). Core collections have ranged in size from 600 (Gireesh et al, 2023) to 2,500 (van Hintum et al, 2000) accessions representing 1.5% and 31% for sorghum and Solanum, respectively. This castor core collection containing 126 accessions, represents 12% of the entire collection, which is an ideal number.
Conclusion
The USDA castor bean germplasm collection was characterized by morphological descriptors for up to 347 accessions with available data in GRIN and analyzed chemically for fatty acid composition from 1,033 accessions. These accessions were clustered into four groups from morphological and chemical data. Part of the collection (574 accessions) was genotyped using EST-SSR markers and clustered into four groups. The morphological, chemical and genetic data supported each other. Based on the results from the above analysis, 126 accessions were selected to form the core collection (12% of the entire collection), which well represented the genetic diversity of the entire collection. The accessions in the core collection are freely available and can be requested online for genetic research and breeding programmes by the castor research community.
Supplemental Table 1. Relevant morphological, seed production, oil content, and fatty acid data from 126 castor bean accessions selected for the core collection.
Supplemental Table 2. Descriptive scales of qualitative traits in the entire collection.
Supplemental Figure 1. Unweighted pair group method using mathematical averages (UPGMA) dendrogram of 126 selected core accessions for morphological and seed number data.
Supplemental Figure 2. Unweighted pair group method using mathematical averages (UPGMA) dendrogram of 126 selected core accessions for ٪ oil and fatty acid data.
Author contributions
J. Bradley Morris: Conceptualization; analysis; methodology; writing. Brandon Tonnis: Methodology. Zhenbang Chen: Analysis; methodology. Ming Li Wang: Conceptualization; analysis; methodology; writing.
Acknowledgments
Authors acknowledge support from Lee Ann Chalkley for providing castor bean seeds; and Ken Manley for planting, maintenance, and harvesting field plots. USDA is an equal opportunity provider and employer.
Conflict of interest statement
The authors have declared that no competing interests exist.
References
Anjani, K. (2012). Castor genetic resources: a primary gene pool for exploitation. Ind. Crops &Prod. 35, 1-14. https://doi.org/10.1016/j.indcrop.2011.06.011.
Anjani, K., Raoof, M.A., Prasad, M.S.L., Duraimurugan, P., Lucose, C., Yadav, P., Prasad, R.D., Lal, J.J., Sarada, C. (2018). Trait-specific accessions in global castor (Ricinus communis L.) germplasm core set for utilization in castor improvement. Ind.l Crops & Prod. 112, 766-774. https://doi.org/10.1016/j.indcrop.2018.01.002.
Basigalup, D.H., Barnes, D.K., Stucker, R.E. (1995). Development of a core collection for perennial Medicago plant introductions. Crop Sci. 35, 949-1244. https://doi.org/10.2135/cropsci1995.0011183X003500040042xop.
Bisht, I.S., Mahajan, R.K., Lokknathan, T.R., Agrawal, R.C. (1998). Diversity in Indian sesame collection and stratification of germplasm accessions in different diversity groups. Genet. Resour. and Crop Evol. 45, 325-335. http://dx.doi.org/10.1023/A:1008652420477
Brown, A.H.D. (1989). The case for core collections. In The use of plant genetic resources, eds. A.H.D. Brown, O.H. Frankel, D.R. Marshall, & J.T. Williams (Cambridge University Press), 136-156.
Cafaro, V., Testa, G., Patanè, C. (2025). Castor: A renewed oil crop for the Mediterranean environment. Agron. 15, 1402. https://doi.org/10.3390/agronomy15061402.
Calvete, J.A., Newell, D.R., Wright, A.F., Rose, M.S. (1994). In vitro and in vivo antitumor activity of ZENECA ZD0490, a recombinant ricin A-chain immunotoxin for the treatment of colorectal cancer. Cancer Res. 54, 4684-4690. PMID: 8062265.
Charmet, G., Balfourier, F. (1995). The use of geostatistics for sampling a core collection of perennial ryegrass populations. Genet. Resour. and Crop Evol. 42, 303-309. https://doi.org/10.1007/BF02432134.
Cheema, N.M., Shabbir, G., Nawaz, N. (2021). Quality characteristics of castor bean oil (Ricinus communis L.) under sub-tropical divergent pothwar environment of Pakistan. Pakistan J. Agric. Res. 34, 813-818. https://dx.doi.org/10.17582/journal.pjar/2021/34.4.813.818.
Choi, Y.-M., Kim, K.-M., Lee, S., Oh, S., Lee, M-C. (2018). Development of a core collection based on EST-SSR markers and phenotypic traits in foxtail millet [Setaria italica (L.) P. Beauv.]. J. Crop Sci. and Biotech. 21, 395-405. https://doi.org/10.1007/s12892-018-0189-0
Derbyshire, E.J., Wawrzynczak, E.J. (1992). An anti-mucin immunotoxin BrE-3-ricin A-chain is potently and selectively toxic to human small-cell lung cancer. Internat. J. Cancer 52, 624-630. https://doi.org/10.1002/ijc.2910520422
Diwan, N., Bauchan, G.R., McIntosh, M.S. (1994). A core collection for the United States annual Medicago germplasm collection. Crop Sci. 34, 279-285. https://doi.org/10.2135/cropsci1994.0011183X003400010051x
FDA. (2003). OTC Drug review ingredient report. Food and Drug Administration, Washington, DC.
Food and Agriculture Organization of the United Nations (2008). World crop production statistics. FAOSTAT statistical database, Rome.
Frankel, O.H. (1984). Genetic perspectives of germplasm conservation. In Genetic manipulation: Impact on man and society, eds. W.K. Arber, K. Llimensee, W.J. Peacock, and P. Starlinger (Cambridge University Press), 161-170.
Gireesh, C., Anantha, M.S., Senguttuvel, P., Basavaraj, K., Rathod, S., Raveendra, C., Uday, V., Subba Rao, L.V., Sundaram, R.M. (2023). Development of core collection for plant genetic resource management and utilization. In Advanced statistical tools and techniques for biometrical data analysis, eds. S. Rathod, B. Sailaja, N. Bandumula, S.A. Kumar, P. Jeyakumar, A. Waris, P. Muthuraman, & R.M. Sundaram (ICAR – Indian Institute of Rice Research, Hyderabad), 197-206.
Herrera, L., Yarbrough, S., Ghetie, V., Aquino, D.B., Vitetta, E.S. (2003). Treatment of SCID/Human B cell precursor ALL with anti-CD19 and anti-CD22 immunotoxins. Leukemia 17, 334-338. https://doi.org/10.1038/sj.leu.2402790.
Herrera, L., Bostrom, B., Gore, L., Sandler, E., Lew, G., Schlegel, P.G., Aquino, V., Ghetie, V., Vitetta, E.S., Schindler, J. (2009). A phase 1 study of combotox in pediatric patients with Refractory B-lineage acute lymphoblastic leukemia. J. Ped. Hematol./Oncol. 31, 936-941. DOI: https://doi.org/10.1097/MPH.0b013e3181bdf211.
Holbrook, C.C., Dong, W. (2005). Development and evaluation of a mini core collection for the U.S. peanut germplasm collection. Crop Sci. 45, 1203-1684.https://doi.org/10.2135/cropsci2004.0368.
Khanal, S., Tomlinson, A., Pearce, E.I., Simmons, P.A. (2007). Effect of an oil-in-water emulsion on the tear physiology of patients with mild to moderate dry eye. Cornea 26, 175-181. https://doi/10.1097/ICO.0b013e31802b492d.
Kottawa-Arachchi, J., Ranatunga, M.A.B., Sharma, R.K., Chaudhary, H.K., Attanayake, R.N., Amarakoon, A.M.T., Gunasekare, M.T.K., Sharma, B., Kumar, N., Sood, V.K. (2024). Morpho-molecular genetic diversity and population structure analysis to enrich core collections in tea [Camellia sinensis (L.) Kuntze] germplasm of Sri Lanka and India. Genet. Resour. Crop Evol. 71, 2597-2616. https://doi.org/10.1007/s10722-023-01792-5
Landoni, M., Bertagnon, G., Ghidoli, M., Cassani, E., Adani, F., Pilu, R. (2023). Opportunities and challenges of castor bean (Ricinus communis L.) genetic improvement. Agron. 13, 8. https://doi.org/10.3390/agronomy13082076.
Morris, J.B. (2004). Phytochemical traits in the genetic resources of castorbean. Current Topics in Plant Biol. 5, 63-67.
Morris, J.B., Dierig, D., Heinitz, C., Hellier, B., Bradley, V., Marek, L. (2023). Vulnerability of U.S. new and industrial crop genetic resources. Industrial Crops & Products 206, 117364. https://doi.org/10.1016/j.indcrop.2023.117364.
Mubofu, E.B. (2016). Castor oil as a potential renewable resource for the production of functional materials. Sustainable Chemical Processes 4, 1-12. Doi https://doi.org/10.1186/s40508-016-0055-8
Nei, M., Li, W. H. (1979). Mathematical model for studying genetic variation in terms of restriction endonucleases. Proceedings of the National Academy of Science USA 76, 5269–5273. https://doi.org/10.1073/pnas.76.10.5269.
Olsnes, S., Pihl, A. (1981). Chimeric toxins. Pharmacol. & Therapeut. 15, 355-381. https://doi.org/10.1016/0163-7258(81)90050-4.
Park, S.G., Kim, H., Jun, H., Choi, S.Y., Kim, E., Kang, S. (2022). Directing ricin-based immunotoxins with targeting affibodies and KDEL signal peptide to cancer cells effectively induces apoptosis and tumor suppression. J. of Nanobiotech. 20, 1-17. https://doi.org/10.1186/s12951-022-01601-8.
Qiu, L., Yang, C., Tian, B., Yang, J.B., Liu, A. (2010). Expoloiting EST databases for the development and characterization of EST-SSR markers in castor bean (Ricinus communis L.). BMC Plant Biol. 10, 278. http://www.biomedcentral.com/1471-2229/10/278.
Rohlf, J. (2000). Numerical taxonomy and multivariate analysis system Version 2.10e. Department of Ecology and Evolution, Sata University of New York at Stony Brook.Manual Applied Biostatistics, Inc N.Y.
Ruperao, P. (2024). Development of a core set from large germplasm collections in genebank. In Bioinformatics for plant research and crop breeding, ed. J.T. Chen (John Wiley & Sons Ltd.), 269-282. https://doi.org/10.1002/9781394209965.ch11.
Sarada, C., Anjani, K. (2011) Self-organizing mapping (SOM) networks for the development of castor core collection. In: Abstracts annual conference, society of statistics computers applications. Society of Statistics Computers Applications, 23 p.
SAS Institute Inc. (2012). SAS/STAT 9.3 User’s Guide. Cary, NC, USA: SAS Institute Inc.
Schnell, R., Katouzi, A.A., Linnartz, C., Schoen, G., Drillich, S., Hansmann, M.-L., Schiefer, D., Barth, S., Zangemeister-Wittke, U., Stahel, R.A., Diehl, V., Engert, A. (1996). Potent anti-tumor effects of an anti-CD24 ricin A-chain immunotoxin in vitro and in a disseminated human Burkitt’s lymphoma model in SCID mice. Internat. J. Cancer 66, 526-531. https://doi.org/10.1002/(sici)1097-0215(19960516)66:4%3C526::aid-ijc17%3E3.0.co;2-5
Senthilvel, S., Shaik, M., Anjani, K., Shaw, R.K., Kumari, P., Sarada, C., Kiran, B.U. (2017). Genetic variability and population structure in a collection of inbred lines derived from a core germplasm of castor. J. Plant Biochem. Biotechnol. 26, 27-34. https://doi.org/10.1007/s13562-016-0356-8
Singh, A.S., Kumari, S., Modi, A.R., Gajera, B.B., Narayanan, S., Kumar, N. (2015). Role of conventional and biotechnological approaches in genetic improvement of castor (Ricinus communis L.) Ind. Crops & Prod. 74, 55-62. https://doi.org/10.1016/j.indcrop.2015.05.001
Sneath, P. H., Sokal, R. R. (1973). Numerical taxonomy: The principles and practice of numerical classification. (San Francisco: Freeman), 573 p.
Tai, P.Y.P., Miller, J.D, (2001). A core collection for Saccharum spontaneum L. from the world collection of sugarcane. Crop Sci. 41, 879-885. https://doi.org/10.2135/cropsci2001.413879x.
Upadhyaya, H.D., Pundir, R.P.S., Dwivedi, S.L., Gowda, L.L., Reddy, V.G., Singh, S. (2009). Developing a mini core collection of sorghum for diversified utilization of germplasm. Crop Sci. 49, 1539-1939. https://doi.org/10.2135/cropsci2009.01.0014.
Upadhyaya, H.D., Dwivedi, S.L., Singh, S.K., Singh, M., Vetriventhan, M., Sharma, S. (2014). Forming core collections in barnyard, kodo, and little millets using morphoagronomic descriptors. Crop Sci. 54, 2673-2682. https://doi.org/10.2135/cropsci2014.03.0221.
USDA, Agricultural Research Service, National Plant Germplasm System. Data from: Germplasm Resources Information Network (GRIN-Global). National Germplasm Resources. (2024) https://npgsweb.ars-grin.gov/gringlobal/search.aspx.
van Hintum, Th.J.L., Brown, A.H.D., Spillane, C., Hodgkin, T. (2000). Core collections of plant genetic resources (Rome, Italy: IPGRI Technical Bulletin No. 3), 51 p.
Wang, M.L., Morris, J.B., Pinnow, D.L., Davis, J., Raymer, P., Pederson, G.A. (2010). A survey of the castor oil content, seed weight and seed-coat colour on the United States Department of Agriculture germplasm collection. Plant Gen. Res.:Charact. and Util. 8, 229-231.https://doi.org/10.1017/S1479262110000262.
Wang, M.L., Morris, J.B., Tonnis, B., Pinnow, D., Davis, J., Raymer, P., Pederson, G.A. (2011). Screening of the entire USDA castor germplasm collection for oil content and fatty acid composition for optimum biodiesel production. J. of Agric. and Food Chem. 59, 9250-9256. https://doi.org/10.1021/jf202949v.
Wang, M. L., Dzievit, M., Chen, Z., Morris, J. B., Norris, J. E., Barkley, N. A., Tonnis, B., Pederson, G. A. (2017). Genetic diversity and population structure of castor (Ricinus communis L.) germplasm within the US collection assessed with EST-SSR markers. Genome 60, 193-200. https://doi.org/10.1139/gen-2016-0116.
Xu, W., Yang, T., Qiu, L., Chapman, M.A., Li, D.Z., Liu, A. (2019). Genomic analysis reveals rich genetic variation and potential targets of selection during domestication of castor bean from perennial woody tree to annual semi-woody crop. Plant Direct 3, e00173. https://doi.org/10.1002/pld3.173.
Yol, E., Uzun, B. (2012). Geographical patterns of sesame accessions grown under Mediterranean environmental conditions, and establishment of a core collection. Crop Sci. 52, 1971-2421. https://doi.org/10.2135/cropsci2011.07.0355.
Yuan, Z., Rembe, M., Mascher, M., Stein, N., Jayakodi, M., Börner, A., Oldach, K., Jahoor, A., Jensen, J.D., Rudloff, J., Dohrendorf, V.-E., Kuhfus, L.P., Dyrszka, E., Conte, M., Hinz, F., Trouchaud, S., Reif, J.C., El Hanafi, S. (2024). Capitalizing on genebank core collections for rare and novel disease resistance loci to enhance barley resilience. J. Exper. Bot. 75, 5940-5954. https://doi.org/10.1093/jxb/erae283
Zangemeister-Wittke, U., Collinson, A.R., Fisch, I., Jones, R.M.L., Waibel, R., Lehman, H.-P., Stahel, R.A. (1993). Anti-tumor activity of a blocked ricin immunotoxin with specificity against the cluster-5A antigen associated with human small-cell lung cancer. Internat. J. Cancer 54, 1028-1035. https://doi.org/10.1002/ijc.2910540628.